XRP Price Playbook Reveals a Painful Pattern, but an 11% Bounce Is Still Possible
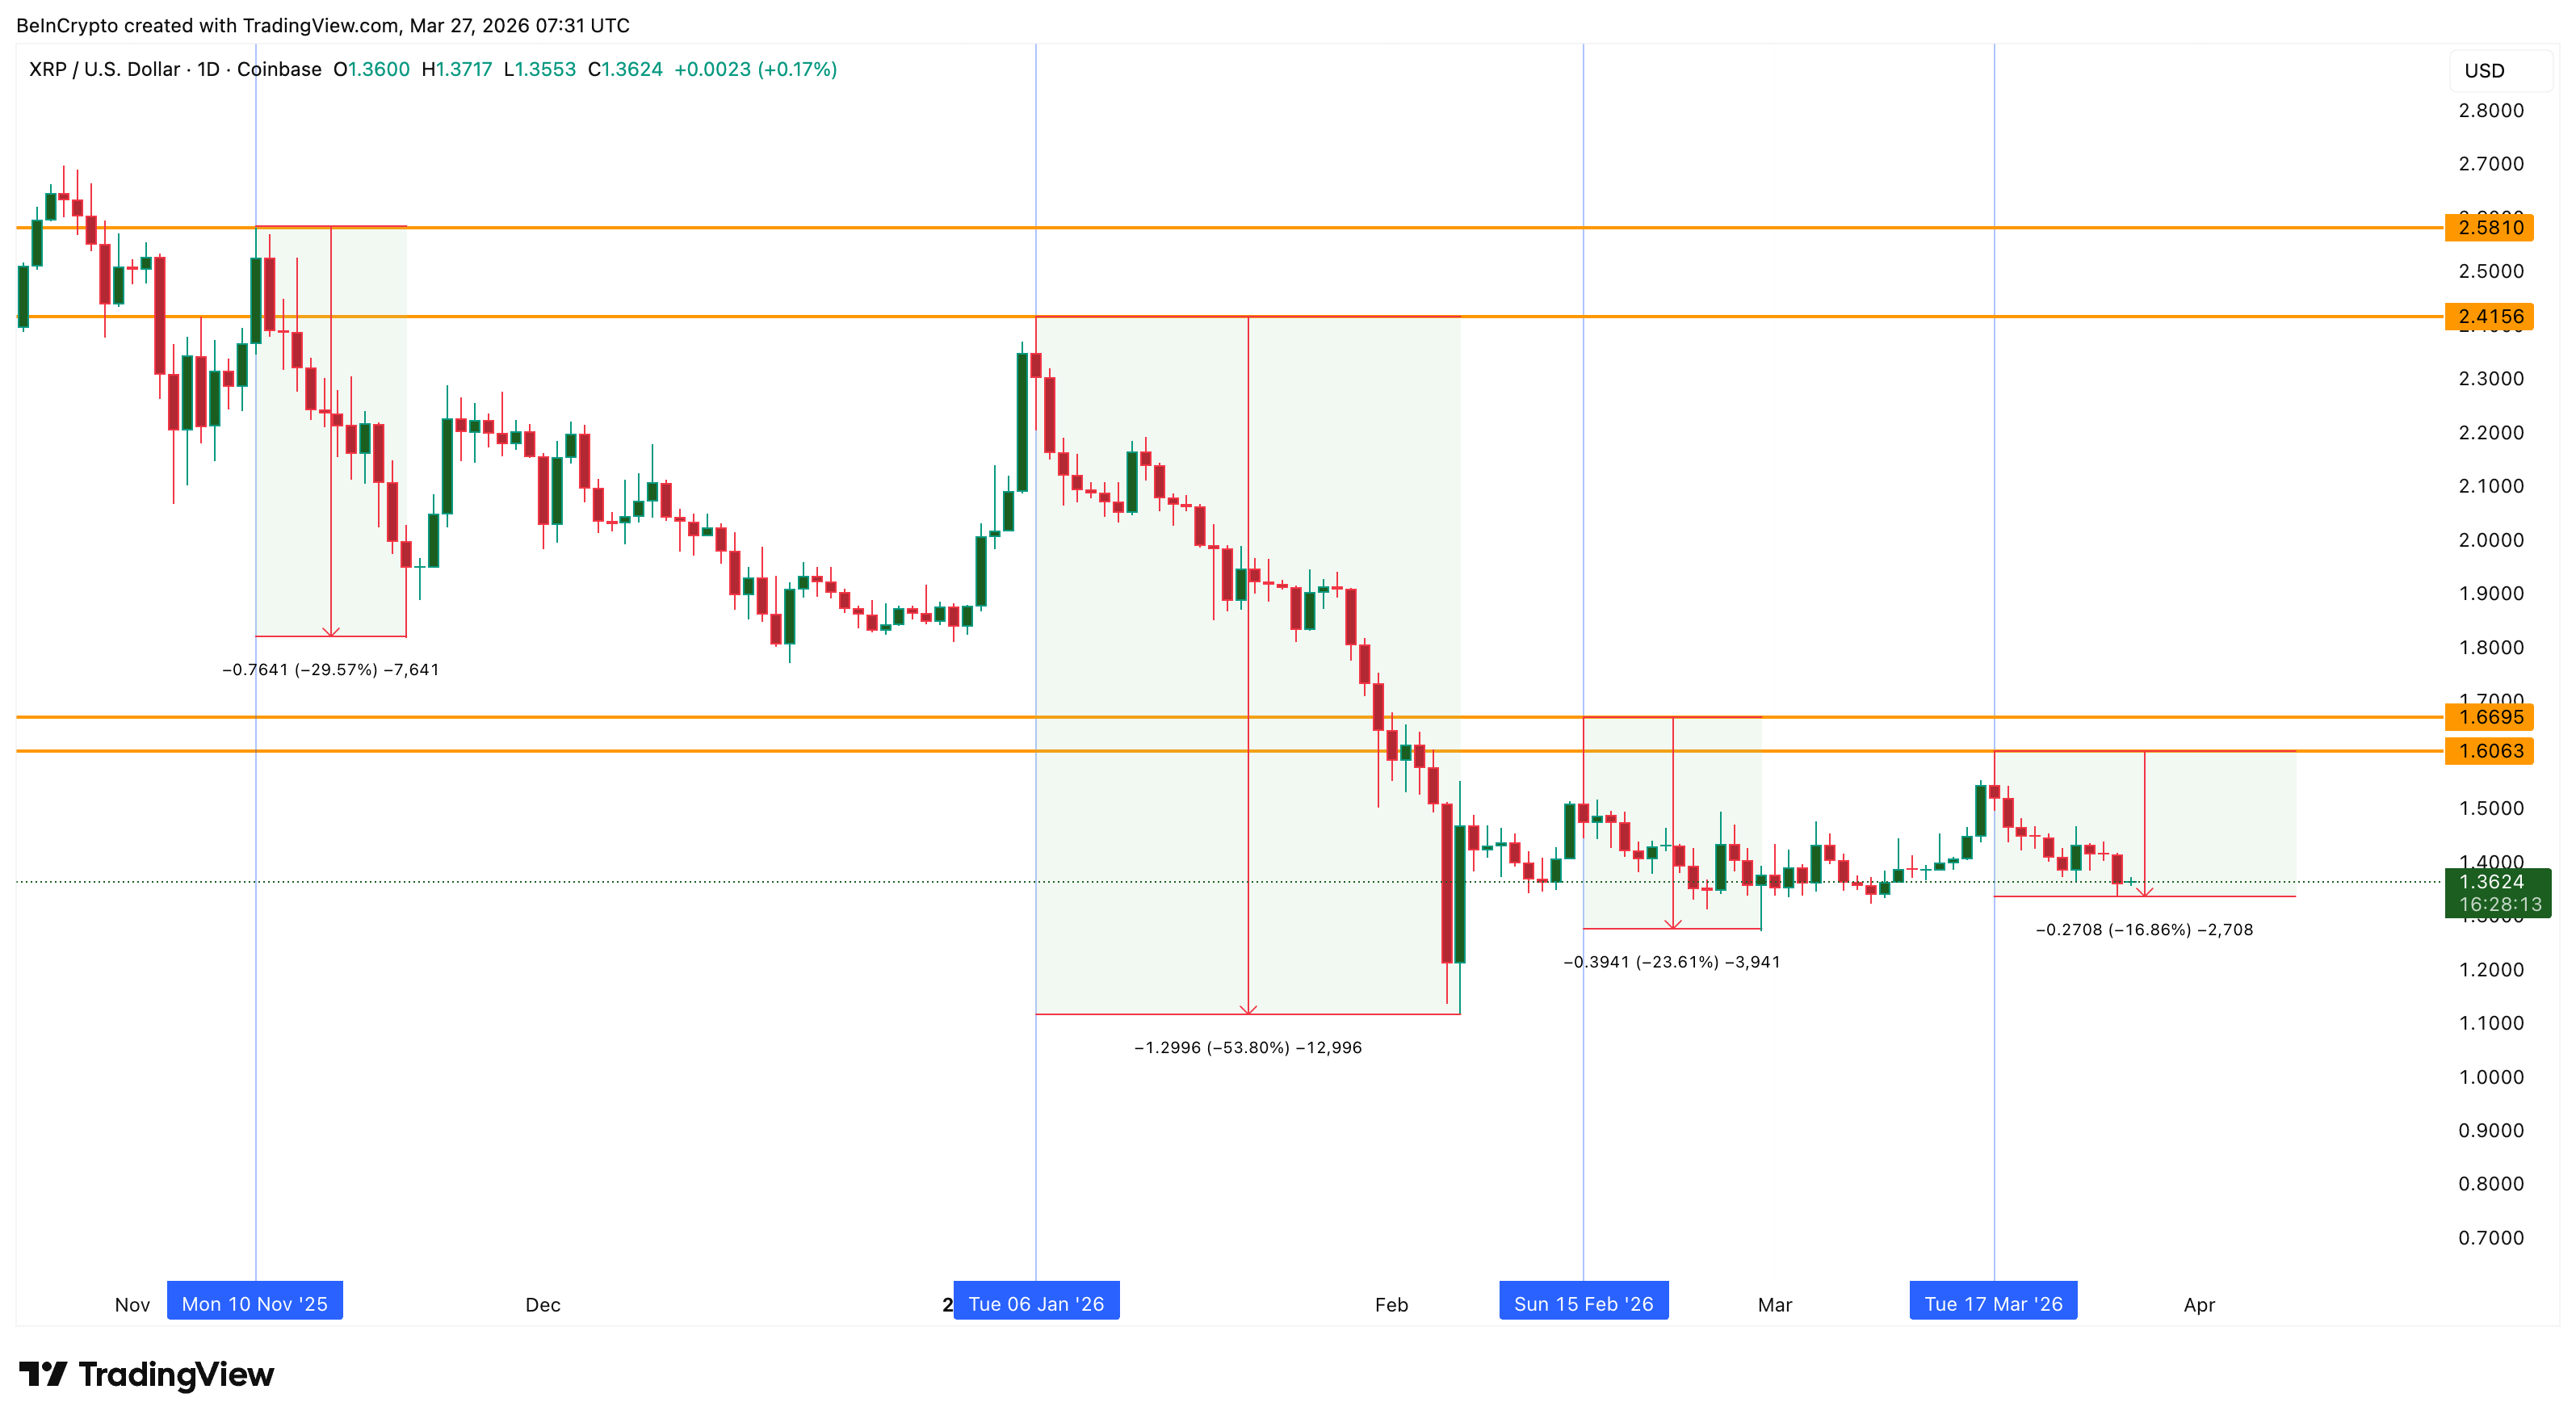
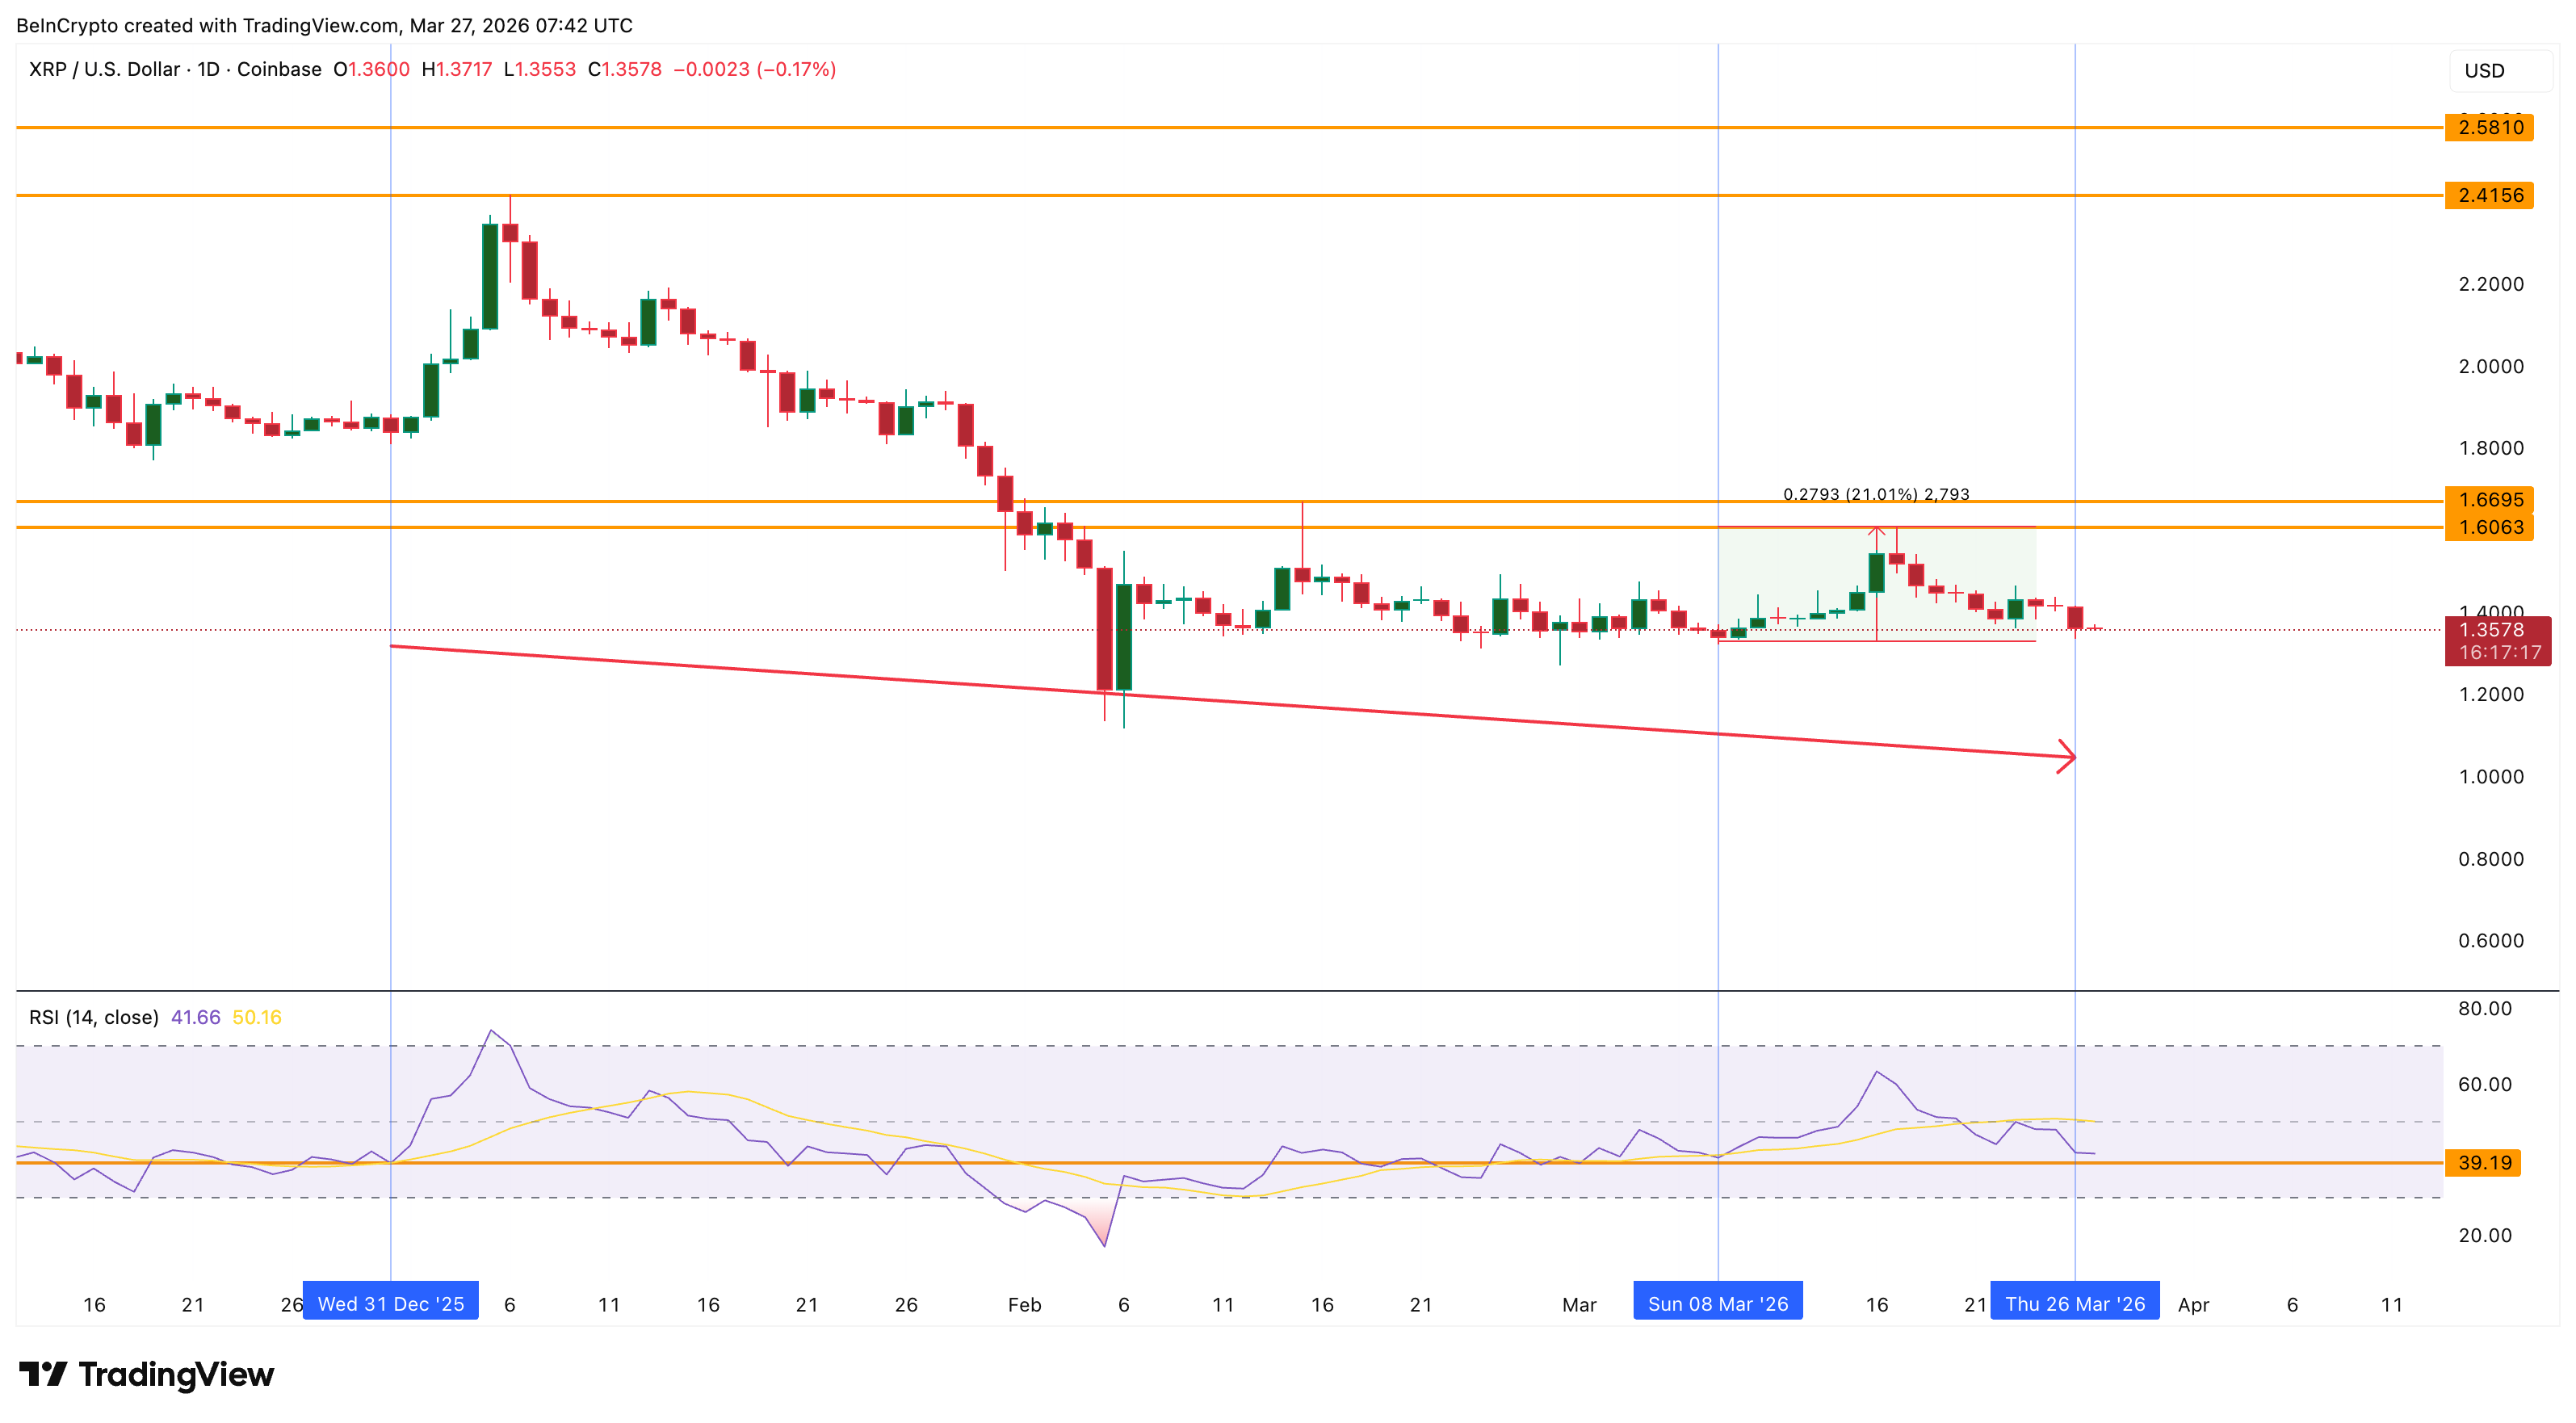
XRP price is trading near $1.36, continuing a pattern of lower peaks that has defined its recent trading playbook. Each rally since November 2025 has been met with progressively weaker conviction and immediate selling.
However, the same RSI setup that preceded XRP’s last 21% bounce has now appeared again. Whether this bounce can break the cycle or simply add another lower high to the chart depends on one level.
Trading Playbook and the Loss-Booking Cycle
The daily XRP chart tells a clear story. Since November 10, 2025, when XRP price peaked at $2.58, every subsequent rally has topped out below the previous one. January 6 peaked at $2.41. February 15 peaked at $1.66. March 17 peaked at $1.60. The corrections between those peaks have varied in depth, ranging from 29% to 53% to 24% and the current 16%, but the direction has been consistent.
Want more token insights like this? Sign up for Editor Harsh Notariya’s Daily Crypto Newsletter here.
The net unrealized profit/loss (NUPL) for short-term XRP holders, a Glassnode metric measuring whether recent buyers are sitting on paper gains or losses, explains why. At every one of those peaks, short-term holders were deep in negative territory. Their selling was not profit-taking. It was loss minimization.
On November 10, NUPL sat at -0.06, barely below breakeven. Holders used that proximity to zero losses as an exit. On January 5, NUPL reached -0.003, essentially flat, and selling followed immediately. By February 5, NUPL had plunged to -0.80, deep capitulation territory. When it recovered to -0.40 by mid-February, holders sold again. On March 16, NUPL improved to -0.31, and the same pattern repeated. The selling timeline coincides with the price dumps highlighted earlier.
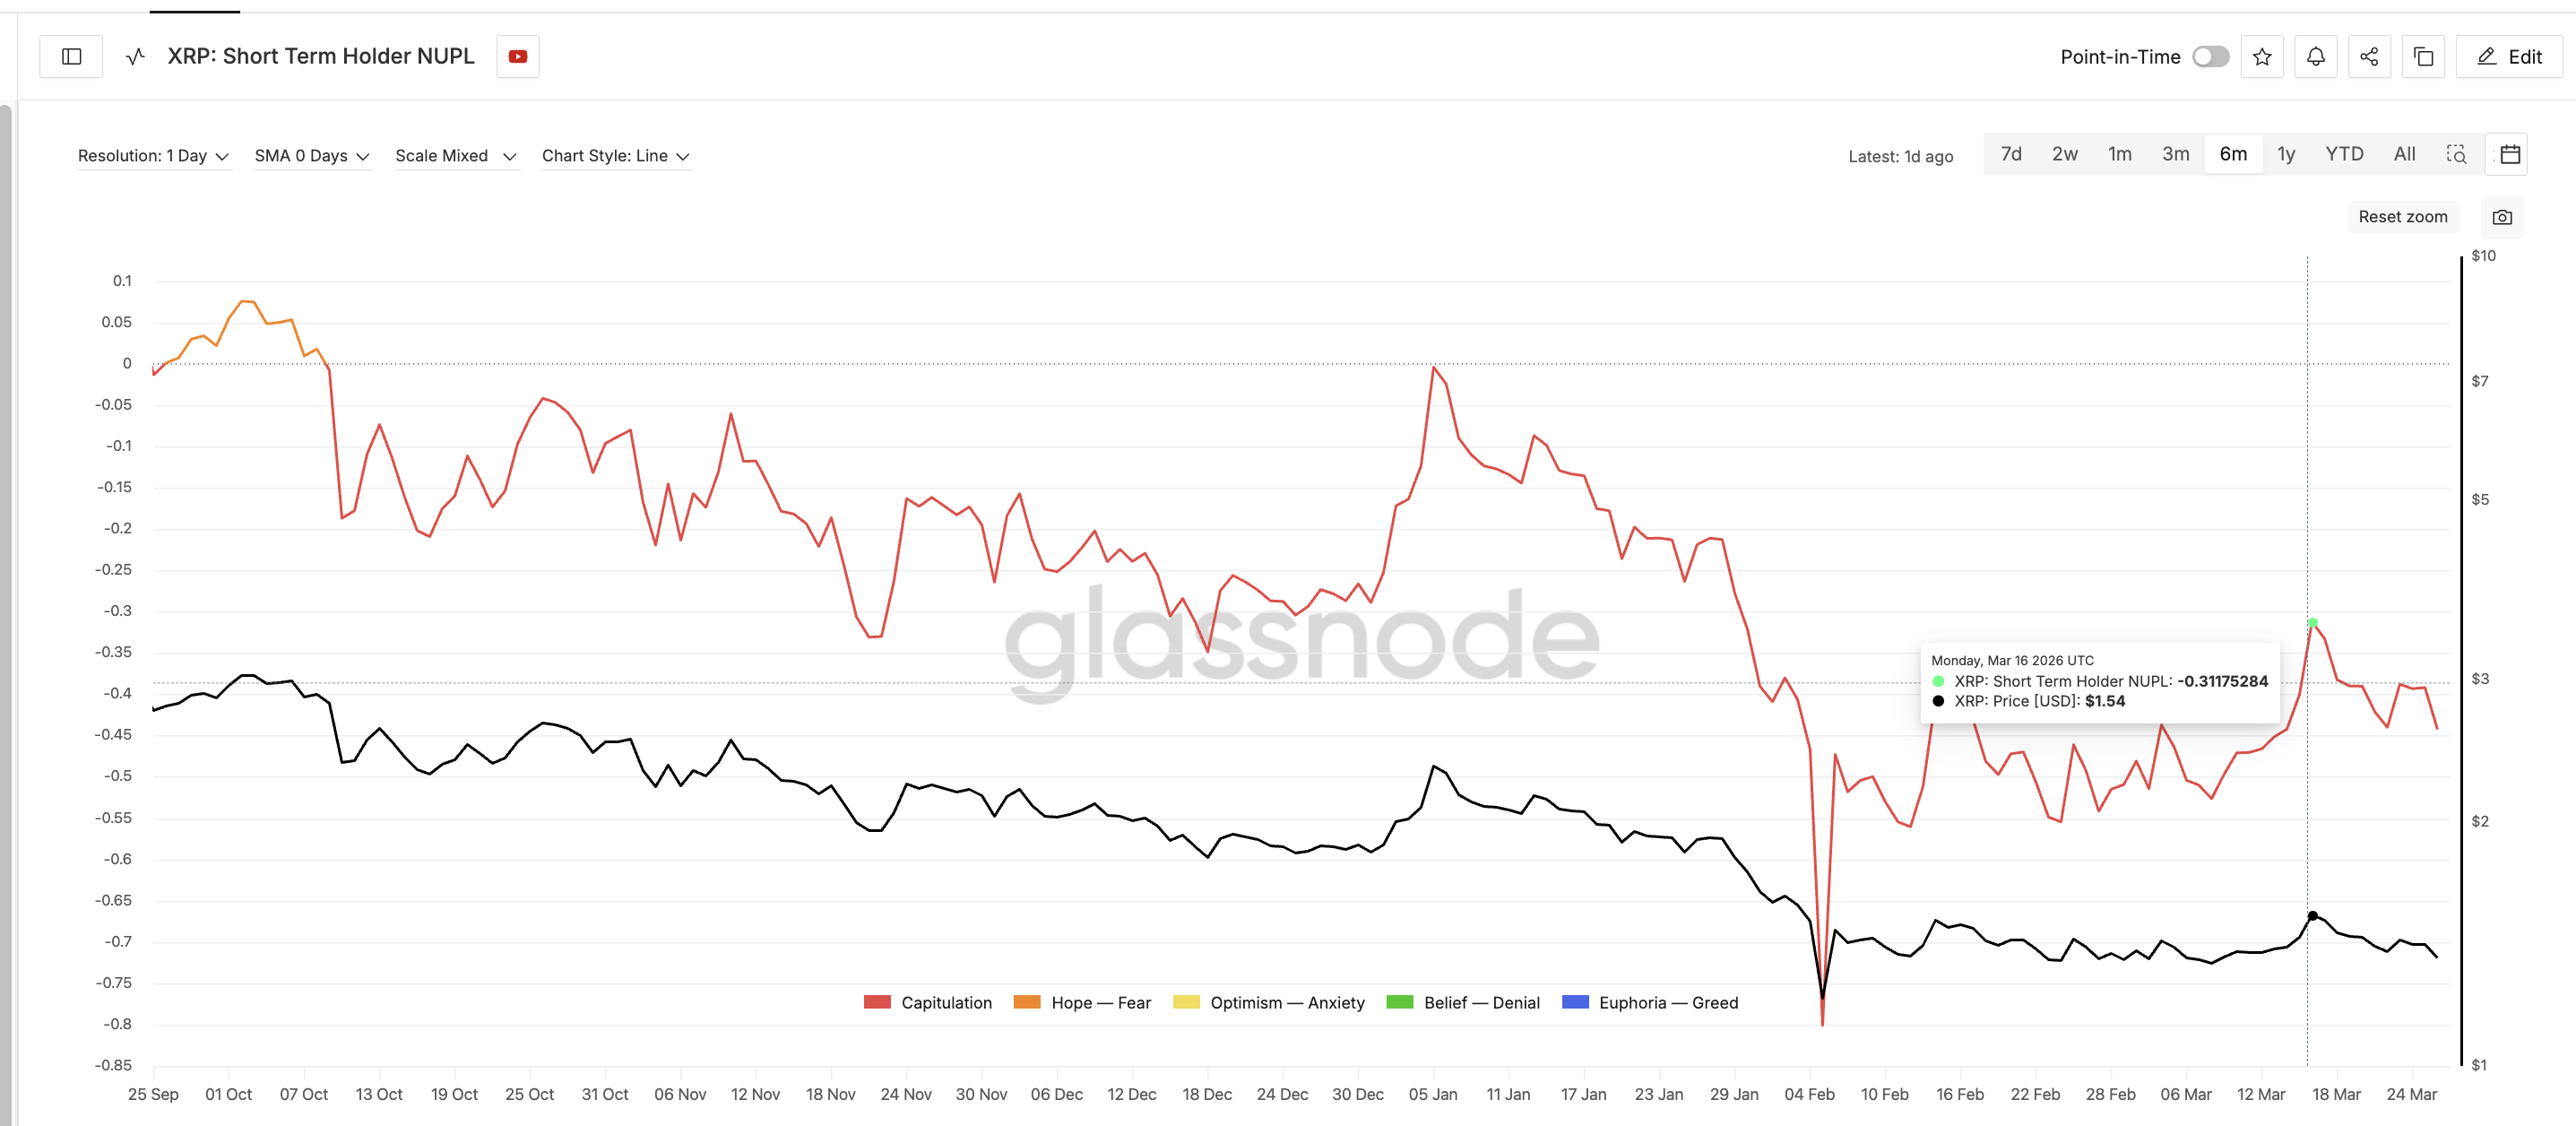
The pattern is self-reinforcing. Short-term holders are not waiting for profits. They are exiting the moment their losses shrink, which caps every rally before it can gain meaningful traction. The question is what is driving this complete absence of conviction.
Whales Have Dumped 1.32 Billion XRP Since October
The answer sits in the whale data. The biggest XRP whale wallets holding between 100 million and 1 billion XRP, the most active large-player cohort, held 9.61 billion tokens in early October 2025. That balance has declined steadily over the past six months to 8.29 billion currently, a net reduction of 1.32 billion XRP.
This is not a single dump. It is a sustained, multi-month distribution. And short-term holders can see it. When the largest wallets are steadily reducing exposure during a downtrend (XRP down 42% YoY), smaller holders lose confidence in any recovery attempt. Every bounce becomes a chance to exit, not a reason to stay.
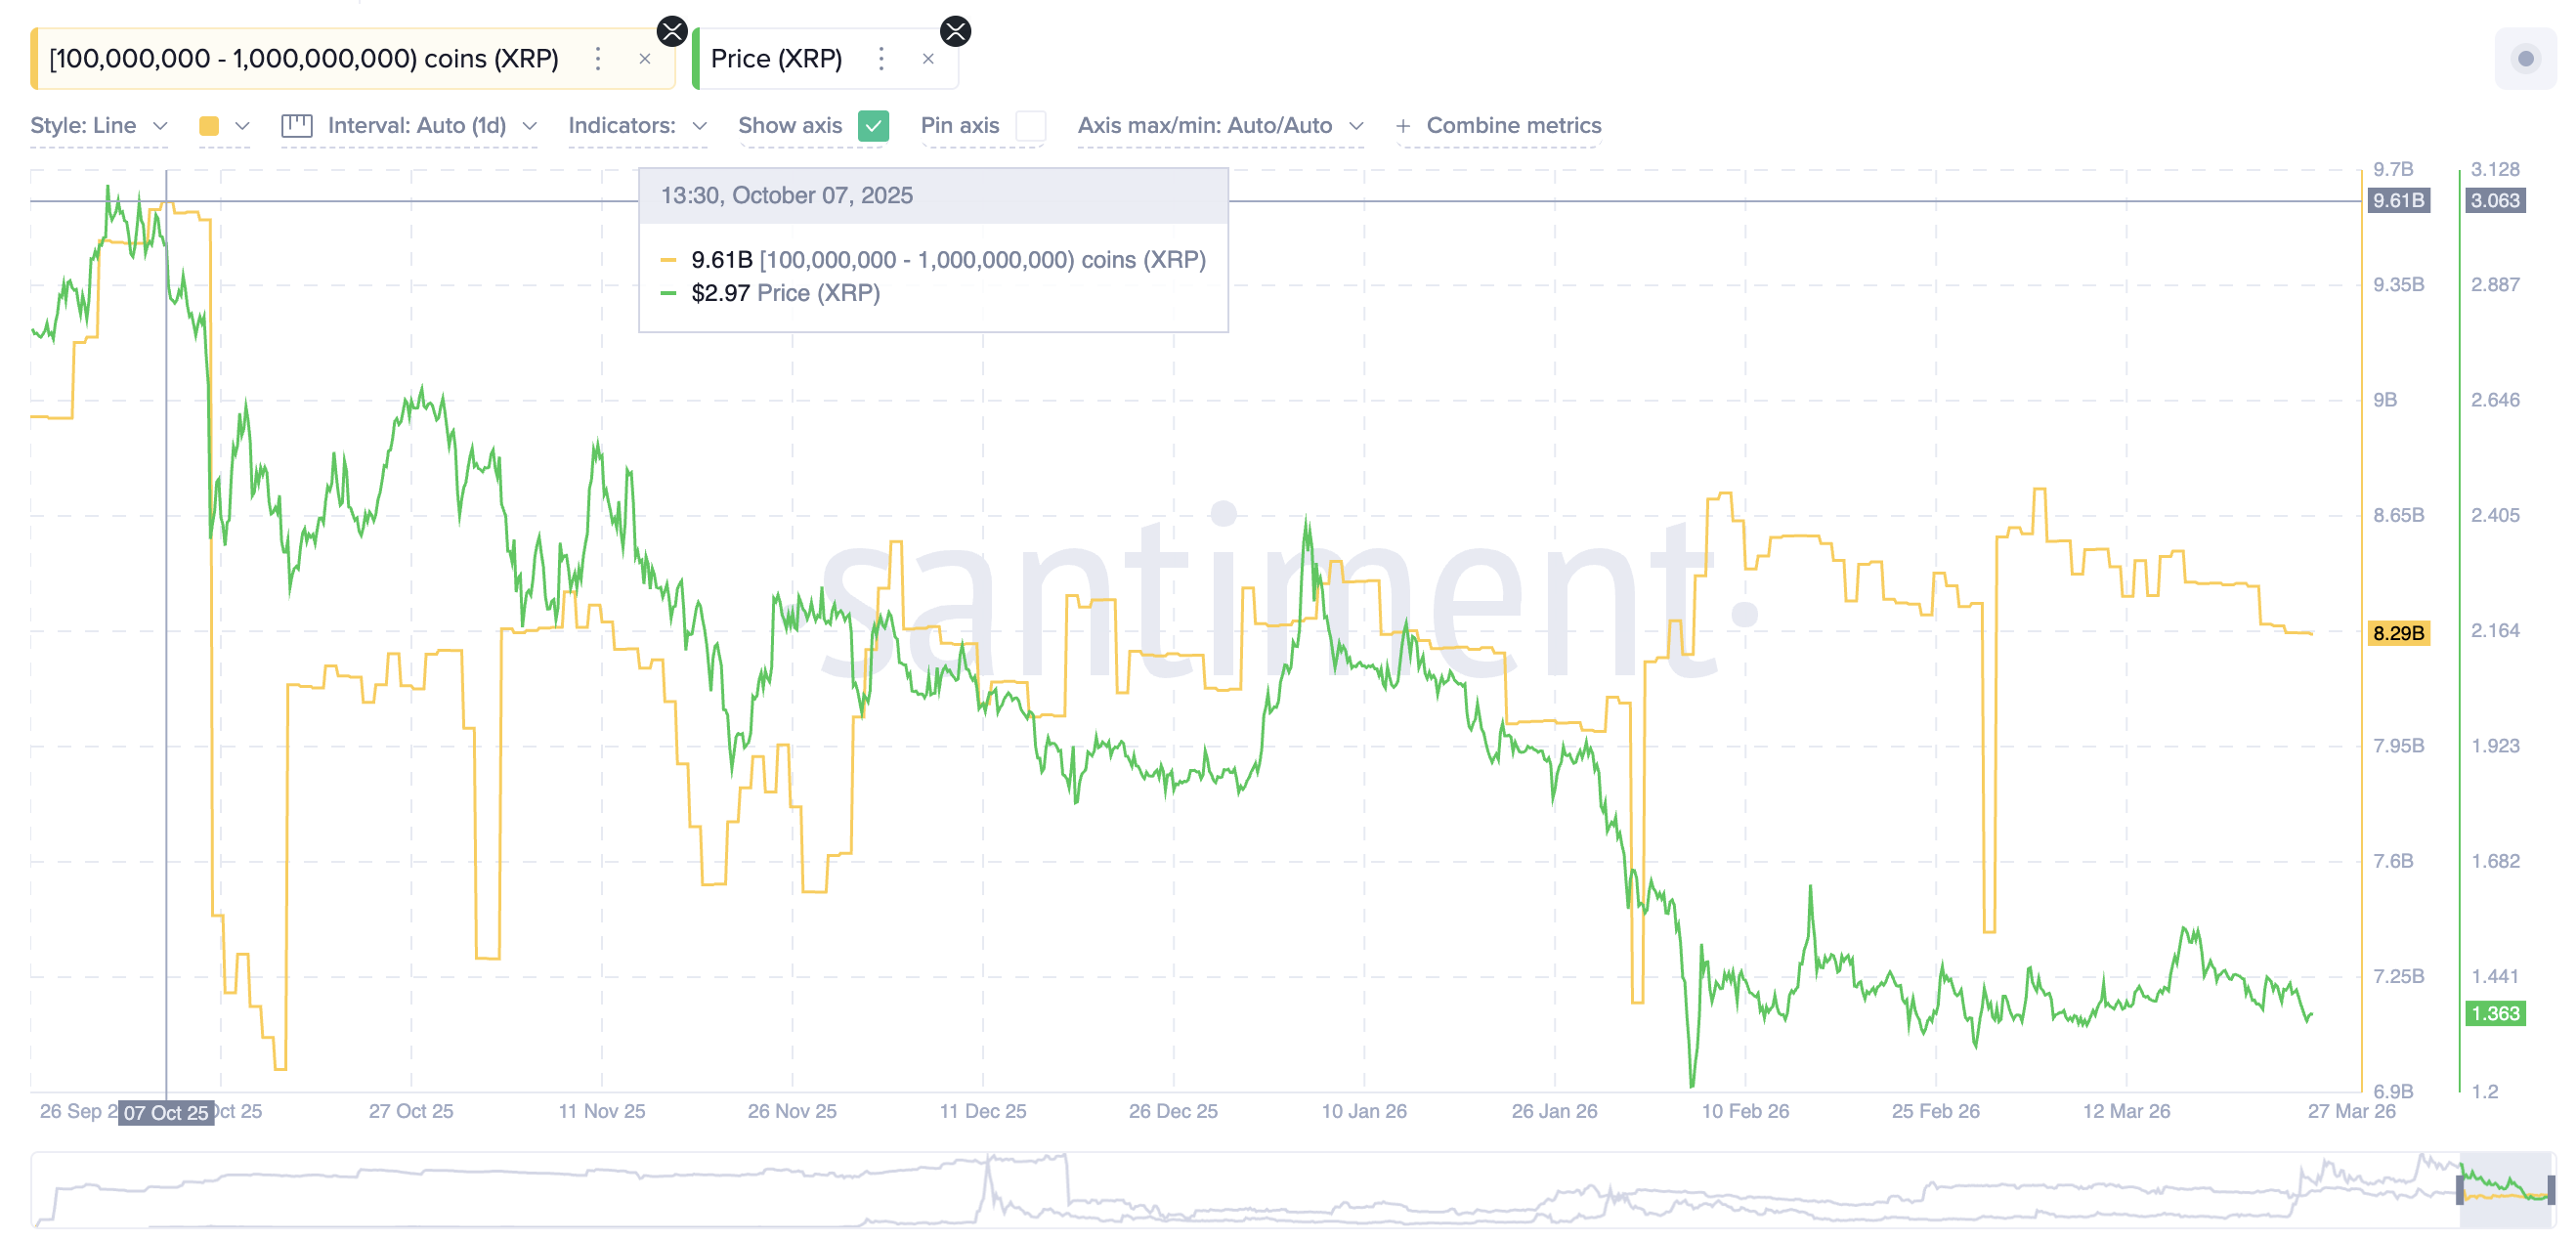
The whale selling also explains why each XRP correction has started from a lower peak. Persistent distribution from the top of the supply chain removes the bid support that would normally sustain rallies. Without that support, each recovery attempt exhausts faster than the one before.
However, the daily chart’s momentum indicator now shows a divergence that has historically interrupted this cycle, at least temporarily.
XRP Price Forecast and the $1.36 Line
Between December 31, 2025, and March 26, 2026, the XRP price has printed a lower low while the Relative Strength Index (RSI), a momentum oscillator, has formed a higher low. That standard bullish divergence often precedes trend reversals.
This is not the first time the setup has appeared in this cycle. A similar divergence formed between December 31 and March 8, and it preceded a 21% bounce that took XRP to $1.60.
The current divergence points to another potential bounce, but the playbook demands caution. Every prior rebound has produced a lower peak, meaning the bounce is real but the follow-through is not.
A daily close above $1.36, the 0.618 Fibonacci level, would confirm the bounce and keep XRP on track for a move toward $1.40, then $1.45, and the $1.50 ($1.51 to be precise) psychological zone. Reclaiming $1.50 would represent an 11% gain from current levels. However, based on the playbook and technical levels, $1.50 could be the zone where short-term holders are likely to start minimizing losses again, as it would mark another lower peak.
For the bounce to become a genuine trend reversal rather than just another lower top, XRP must reclaim $1.60, the most recent local peak. Only above that level does the lower-high structure break.
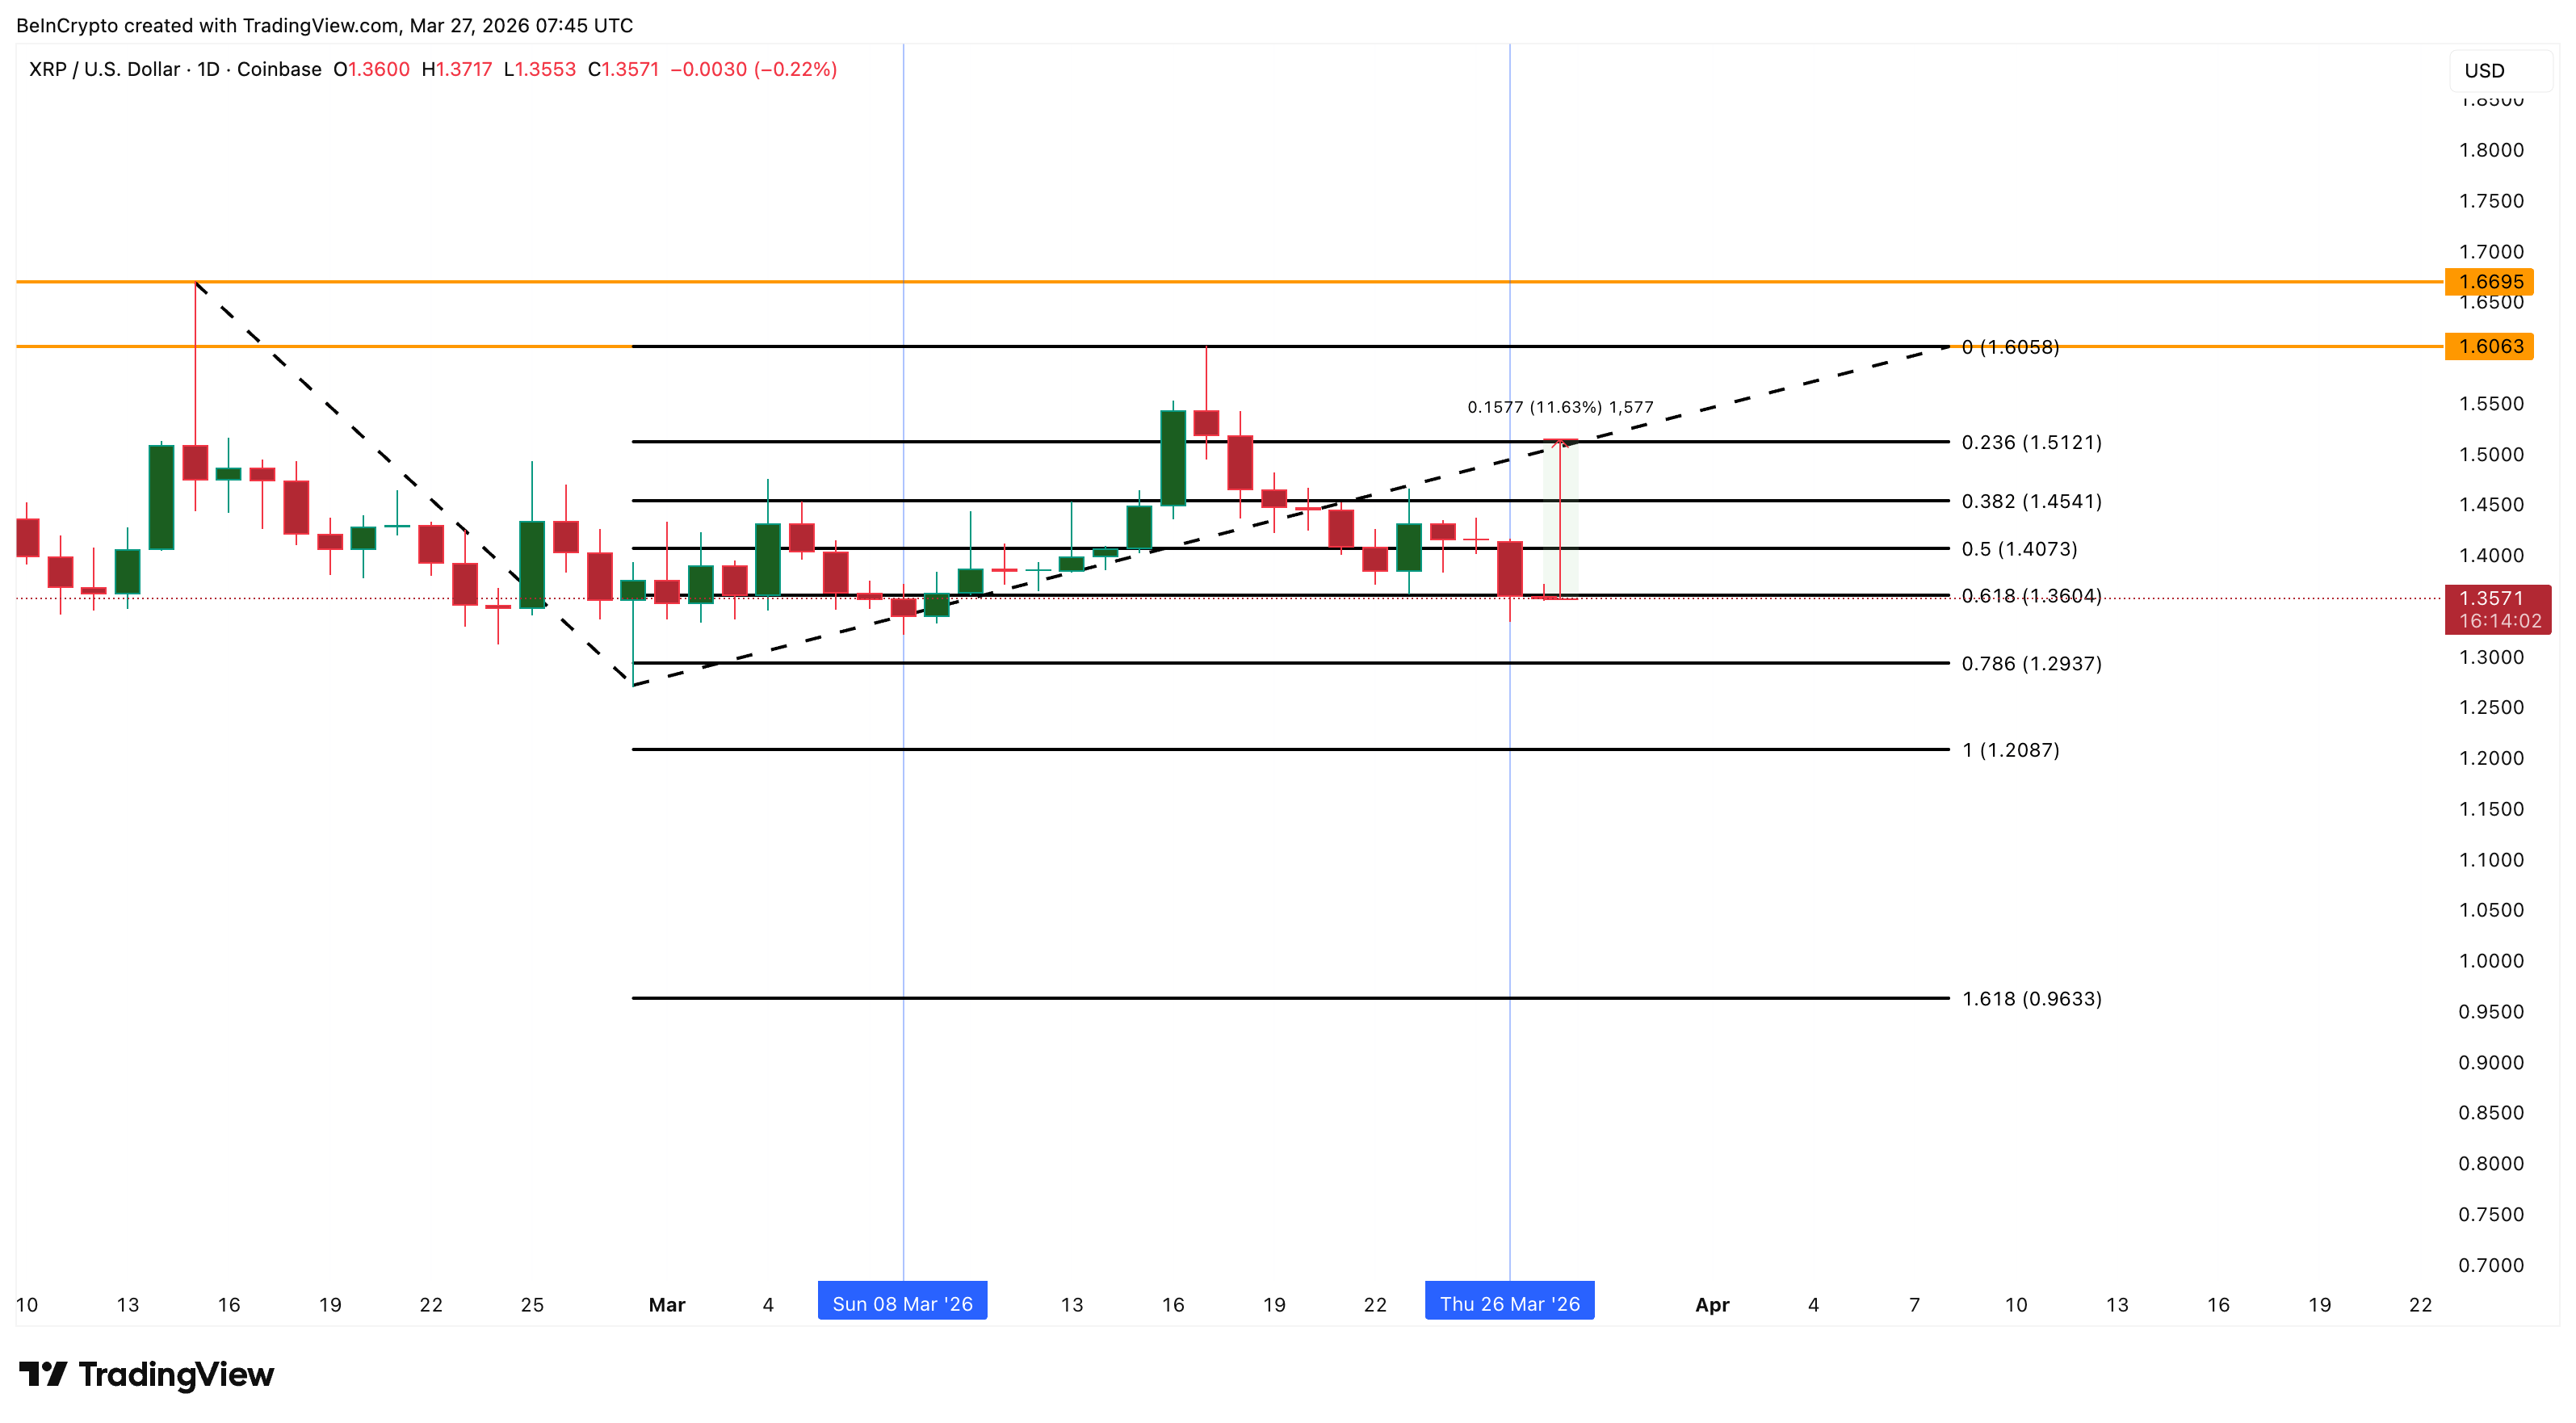
On the downside, a failure to hold $1.36 would put $1.29 and $1.20 in play. Those levels would signal that the current floor is not yet in, and the loss-booking cycle has further to run. For now, $1.36 separates an 11% bounce toward $1.50 from a deeper slide to $1.20.
The post XRP Price Playbook Reveals a Painful Pattern, but an 11% Bounce Is Still Possible appeared first on BeInCrypto.
Read moreLatest News