XRP Price Outlook For April 2026
XRP is entering April 2026, trapped in a descending channel that has defined its trend since mid-July 2025. March is closing at roughly -1.94%, extending a red streak to six consecutive months since 2025.
A death cross on the 3-day chart, weakening conviction among mid-term holders, and a risky leverage buildup all point to continued pressure.
However, April has historically been one of XRP’s stronger months. Whether seasonal strength can override the structural damage will define the token’s path in April.
History Offers Hope, but the 3-Day XRP Chart Warns Otherwise
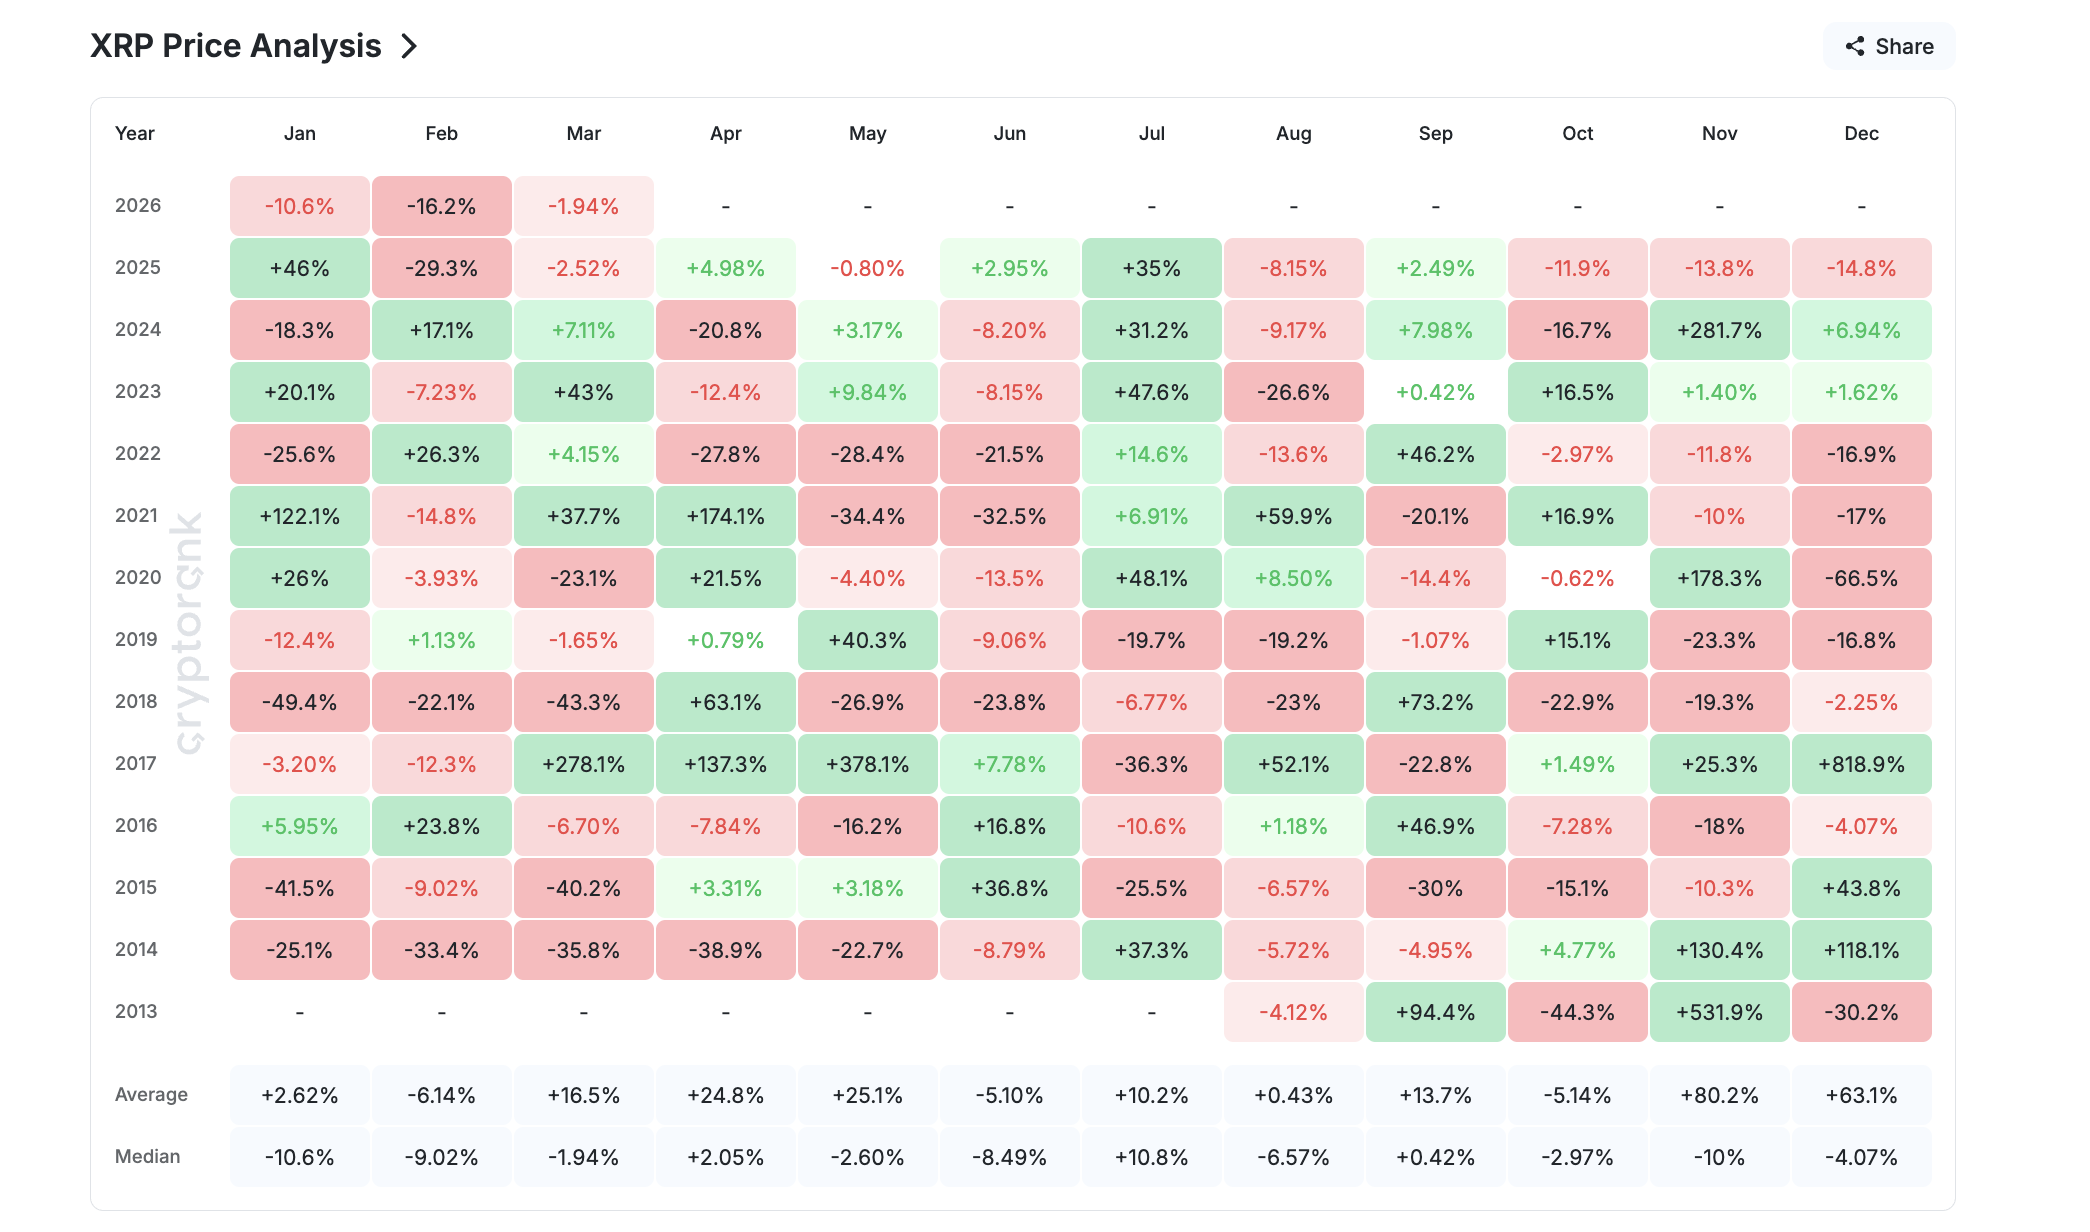
The monthly returns chart shows that XRP price has struggled throughout 2026. Historically, January, February, and March have carried negative median returns, so their declines were somewhat expected.
April tells a different story on paper. The historical average return for XRP in April sits at +24.8%, with a positive median of +2.05%. Yet, given that 2026 has already defied multiple seasonal patterns for BTC and ETH, relying on history alone would be risky.
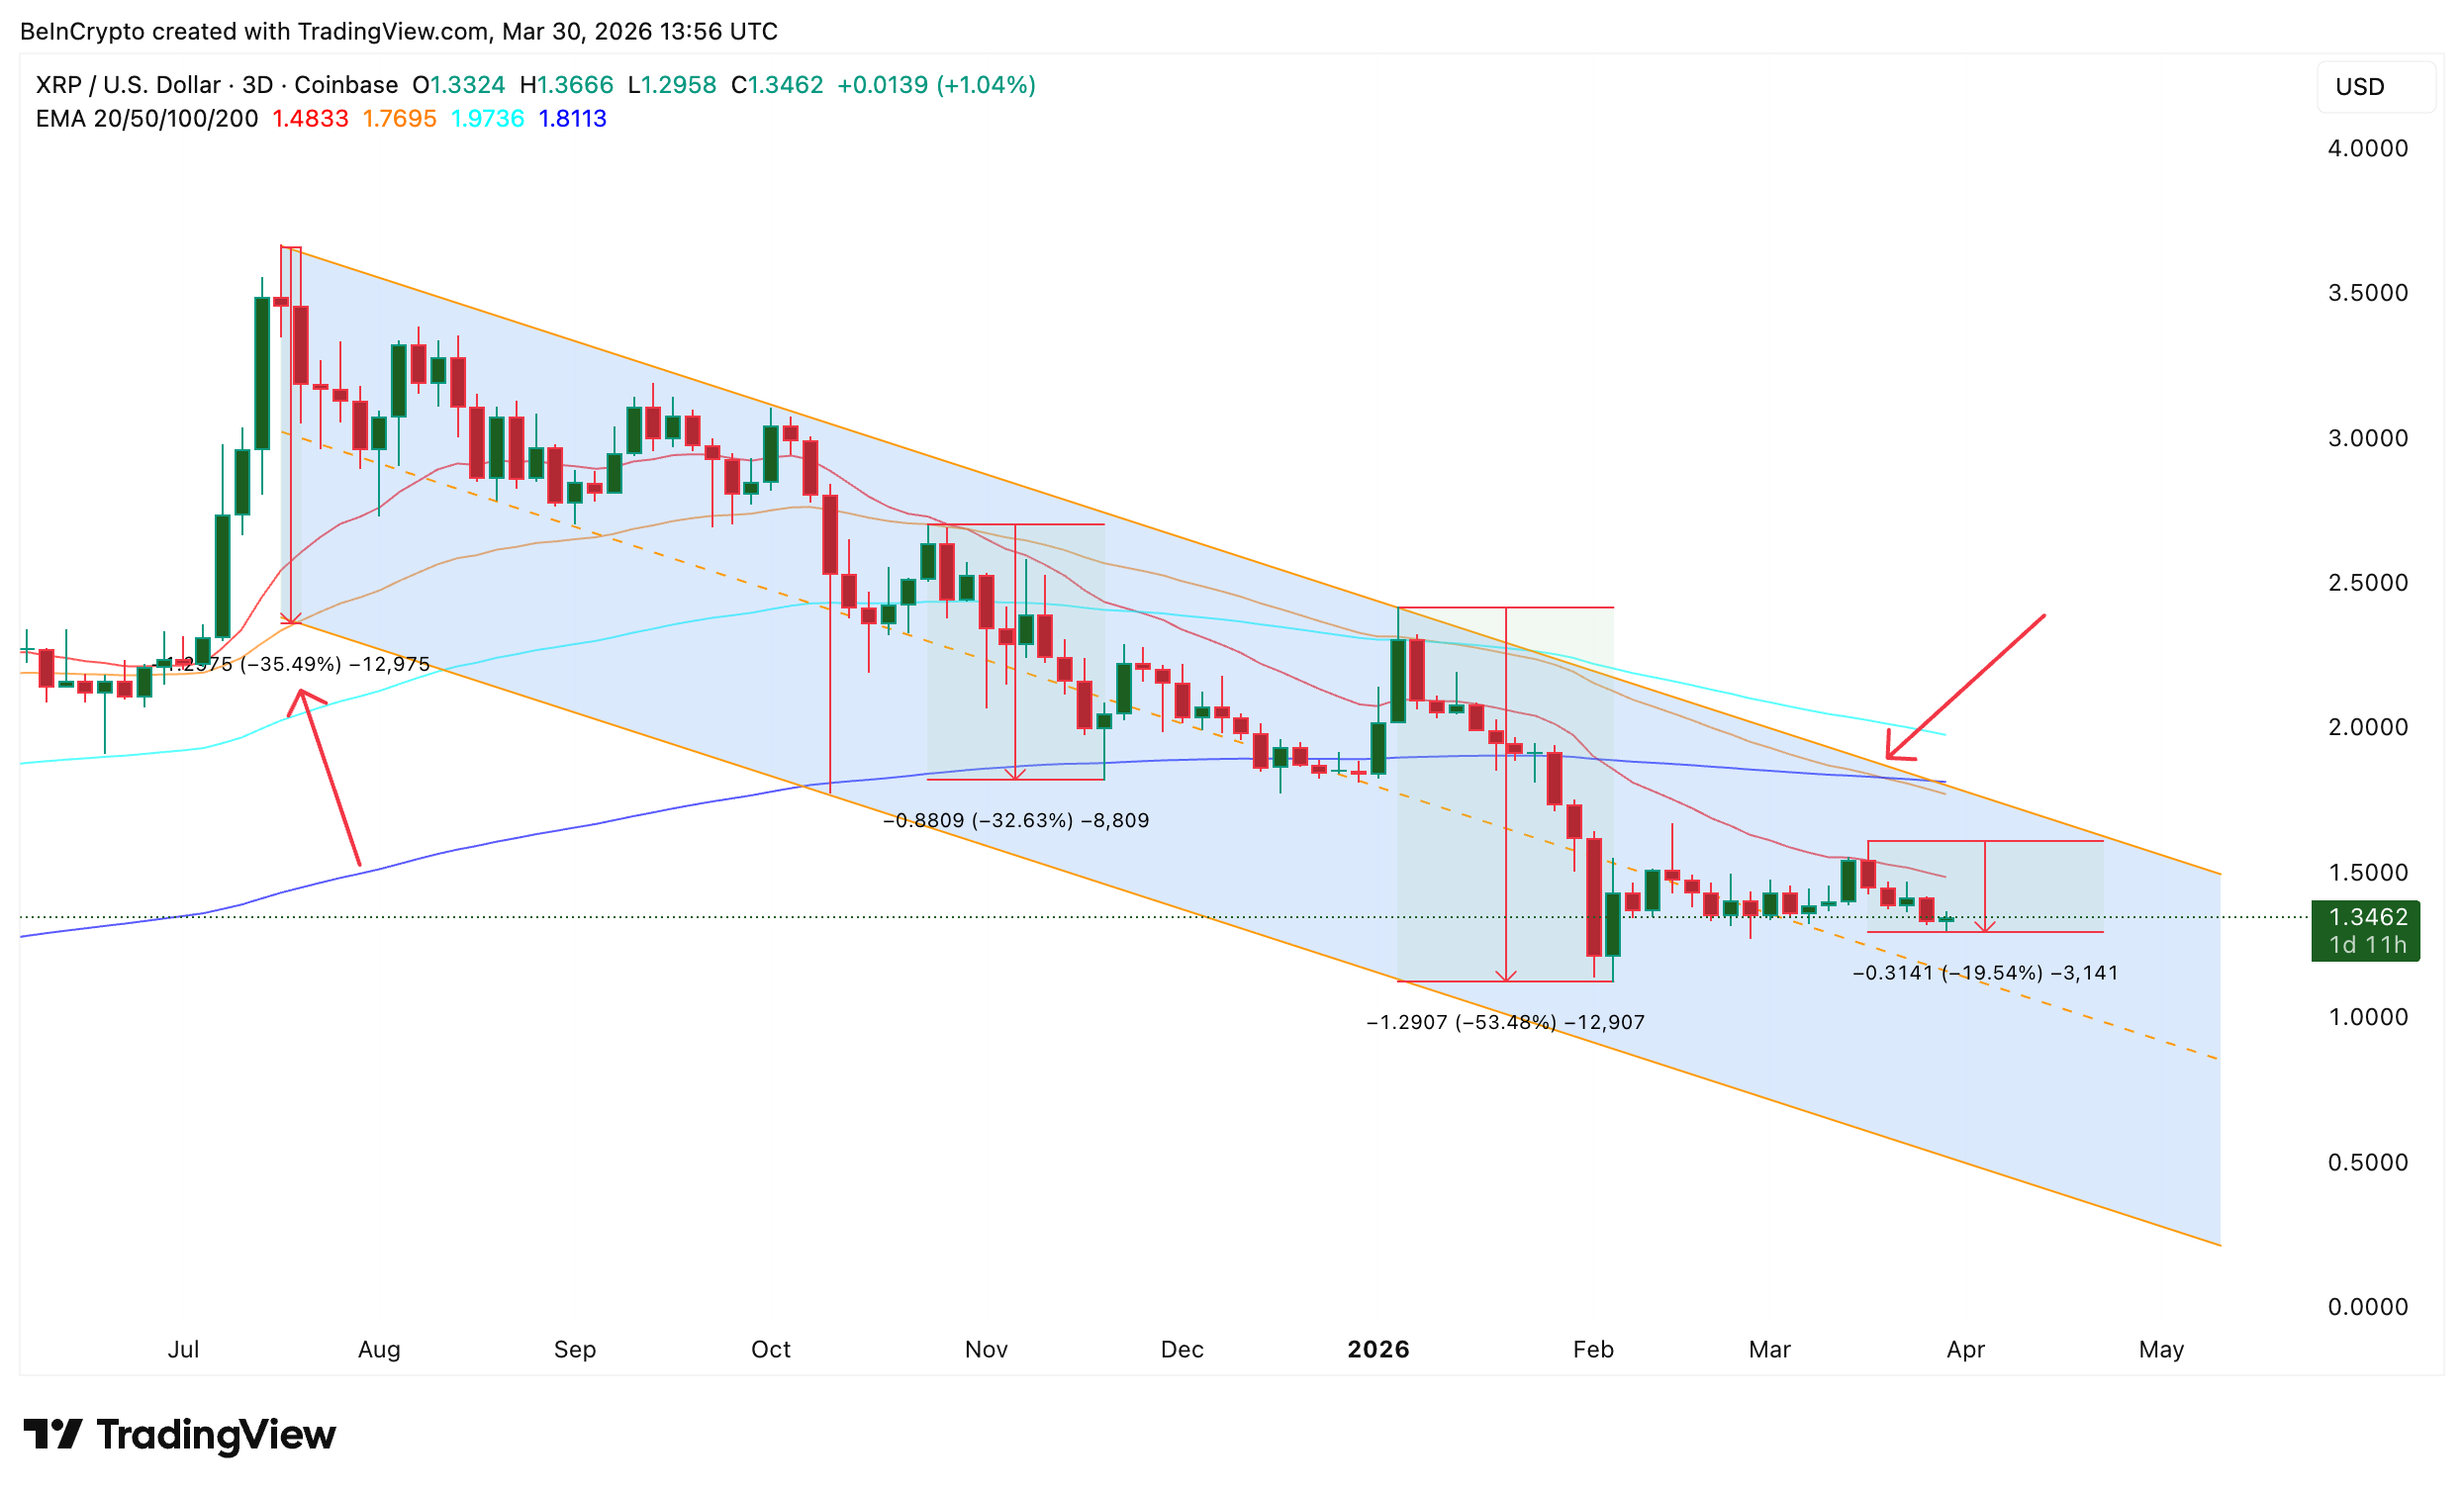
The 3-day chart explains why caution is warranted. XRP has been falling within a descending channel since mid-July 2025, and the downtrend recently produced a death cross, in which the 50-day Exponential Moving Average (EMA), a trend indicator that gives greater weight to recent price movements, crossed below the 200-day EMA.
Previous EMA crossovers on this timeframe have delivered significant corrections. An October crossover in which the 20 EMA crossed below the 50 EMA led to a 32% decline.
A January crossover triggered a 54% drop. The current death cross has so far returned a 19% correction.
If the pattern continues toward the lower trendline of the descending channel, the conservative breakdown target sits near 35%. Taking the channel’s widest part into account, the correction could reach as much as 54%.
Between November 24 and March 23 on the 3-day chart, XRP made a lower high in price while the Relative Strength Index (RSI), a momentum indicator, touched the same level.
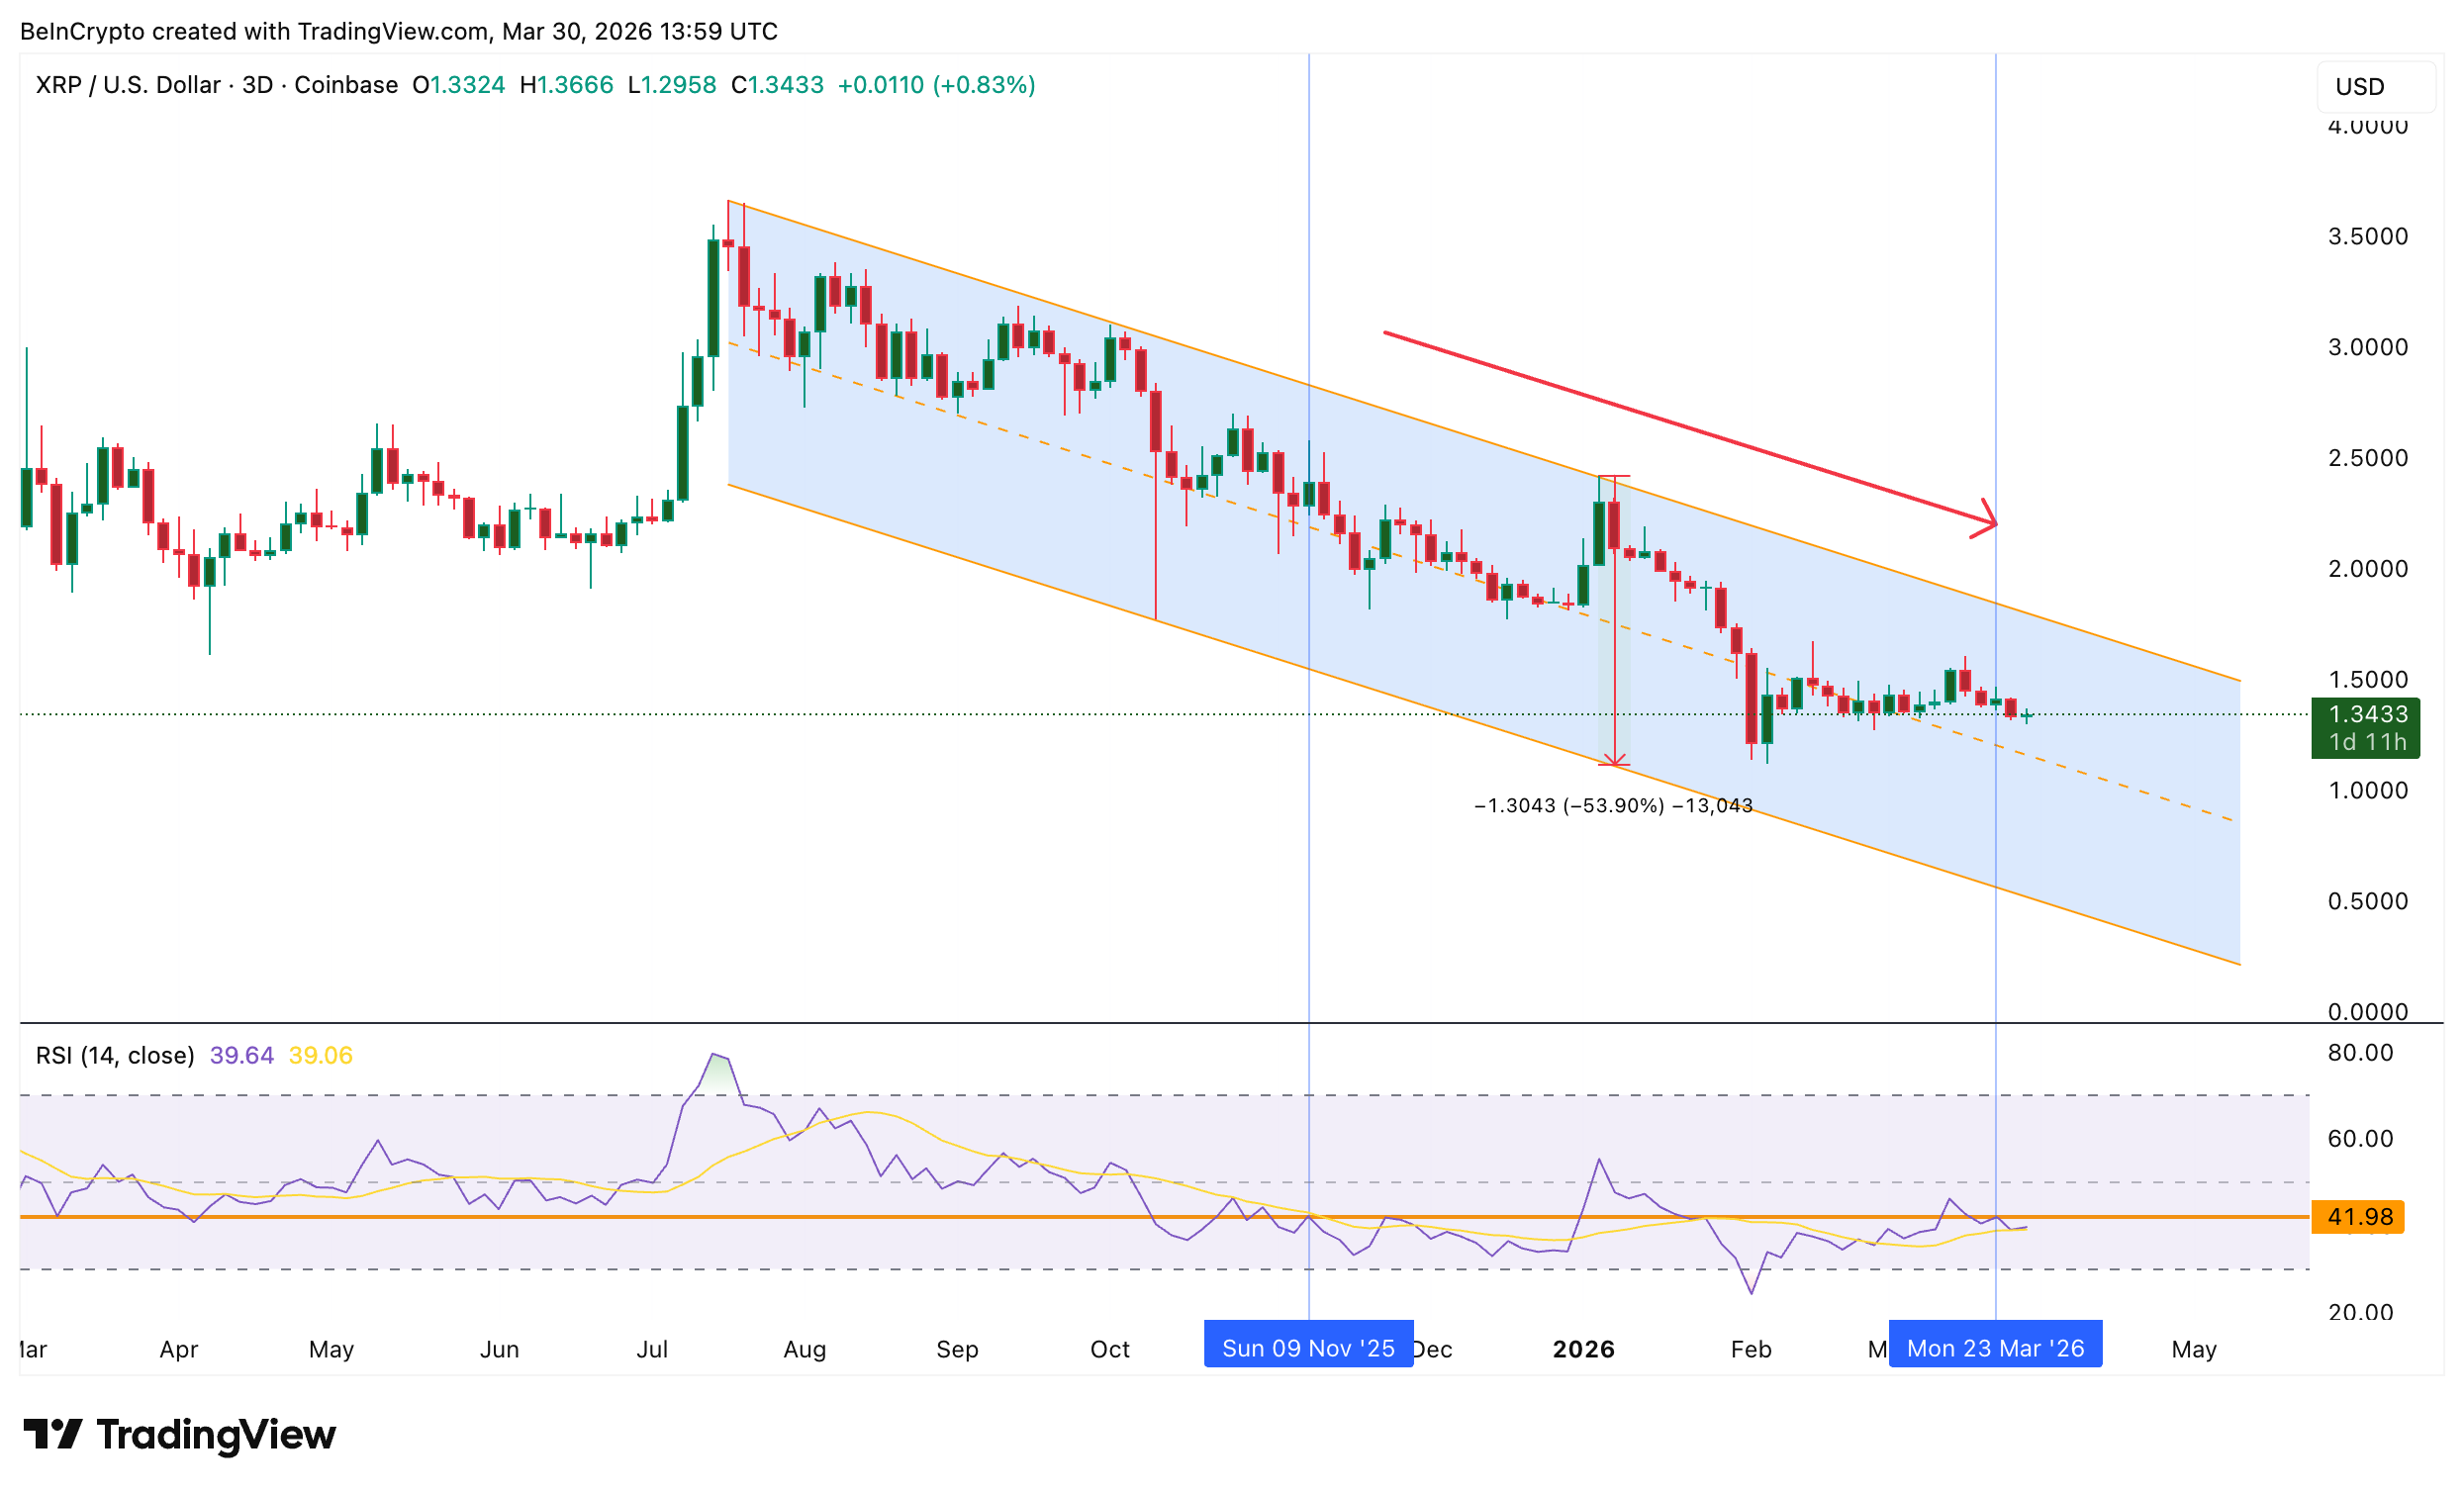
The RSI failing to rise with the broader structure and hidden bearish divergence suggest the pullback that began on March 17 could extend further, validating the hypothesis that the EMA-led correction is not yet complete.
Conviction Holders Start to Waver
However, technicals alone do not confirm a deeper correction. We need to go on-chain for an additional layer of confirmation.
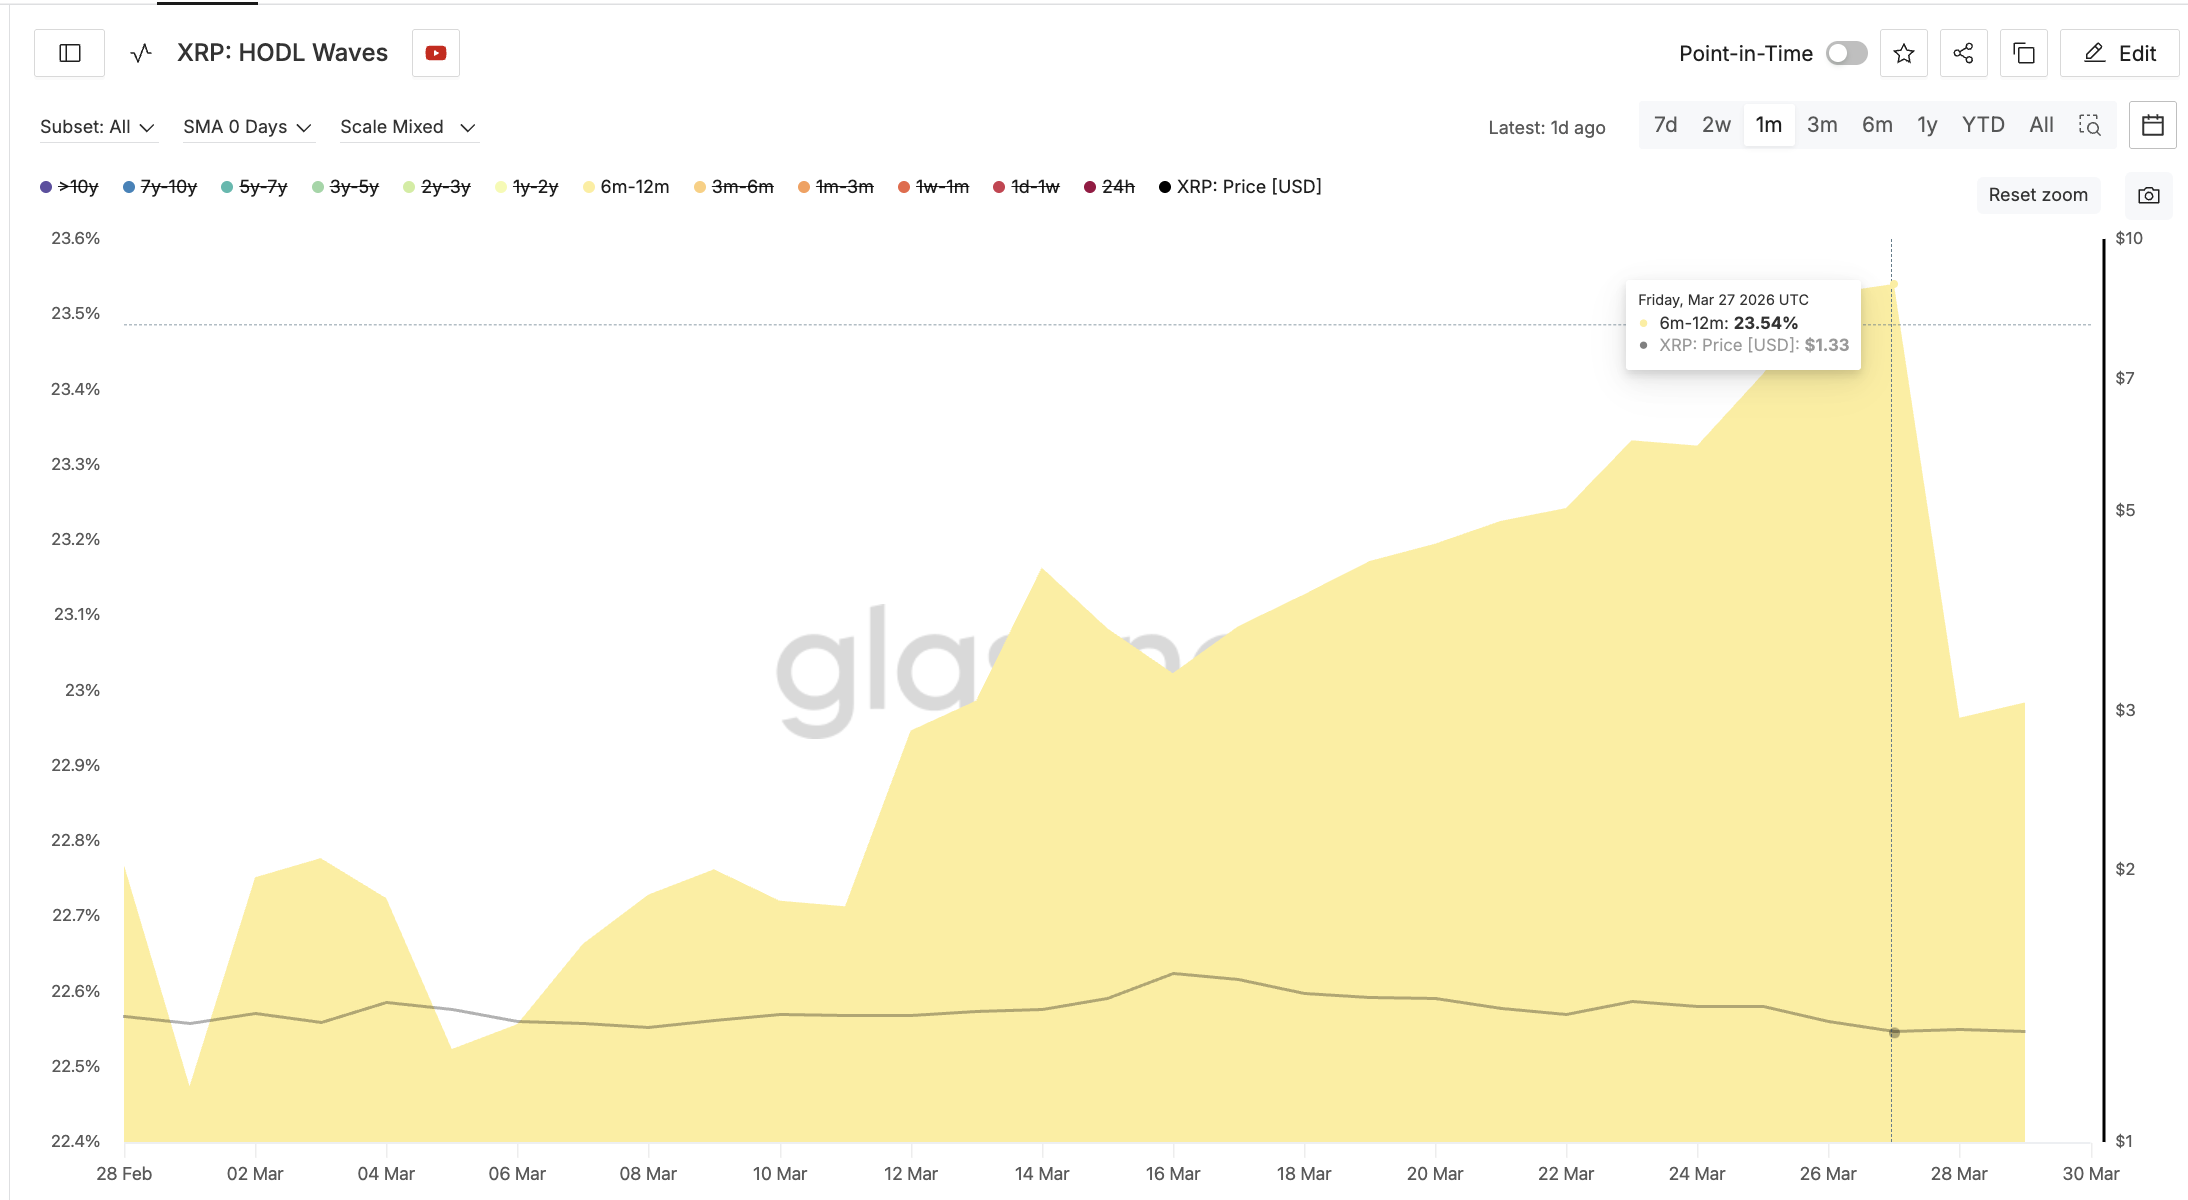
The HODL Waves metric, which tracks the percentage of supply held by different age cohorts, reveals that conviction among mid-term holders is fading heading into April.
The 6-month to 12-month cohort, one of XRP’s more committed holder groups, began increasing its share of supply in late February. Their holdings rose from 22.768% to 23.54% by March 27.
However, since March 27, this group has started trimming. Their share has dropped from 23.54% to approximately 22.98%. The timing comes after the RSI signal that flashed on March 23, suggesting the same bearish pressure visible on the chart is now filtering into holder behavior.
If conviction holders continue reducing their positions into April, it removes a layer of structural support from the XRP price. And the cost basis data shows exactly where that support sits.
The cost basis distribution heatmap reveals a dense supply cluster of approximately 19.6 million XRP concentrated in the $1.27 to $1.28 range. This is the strongest nearby demand zone.
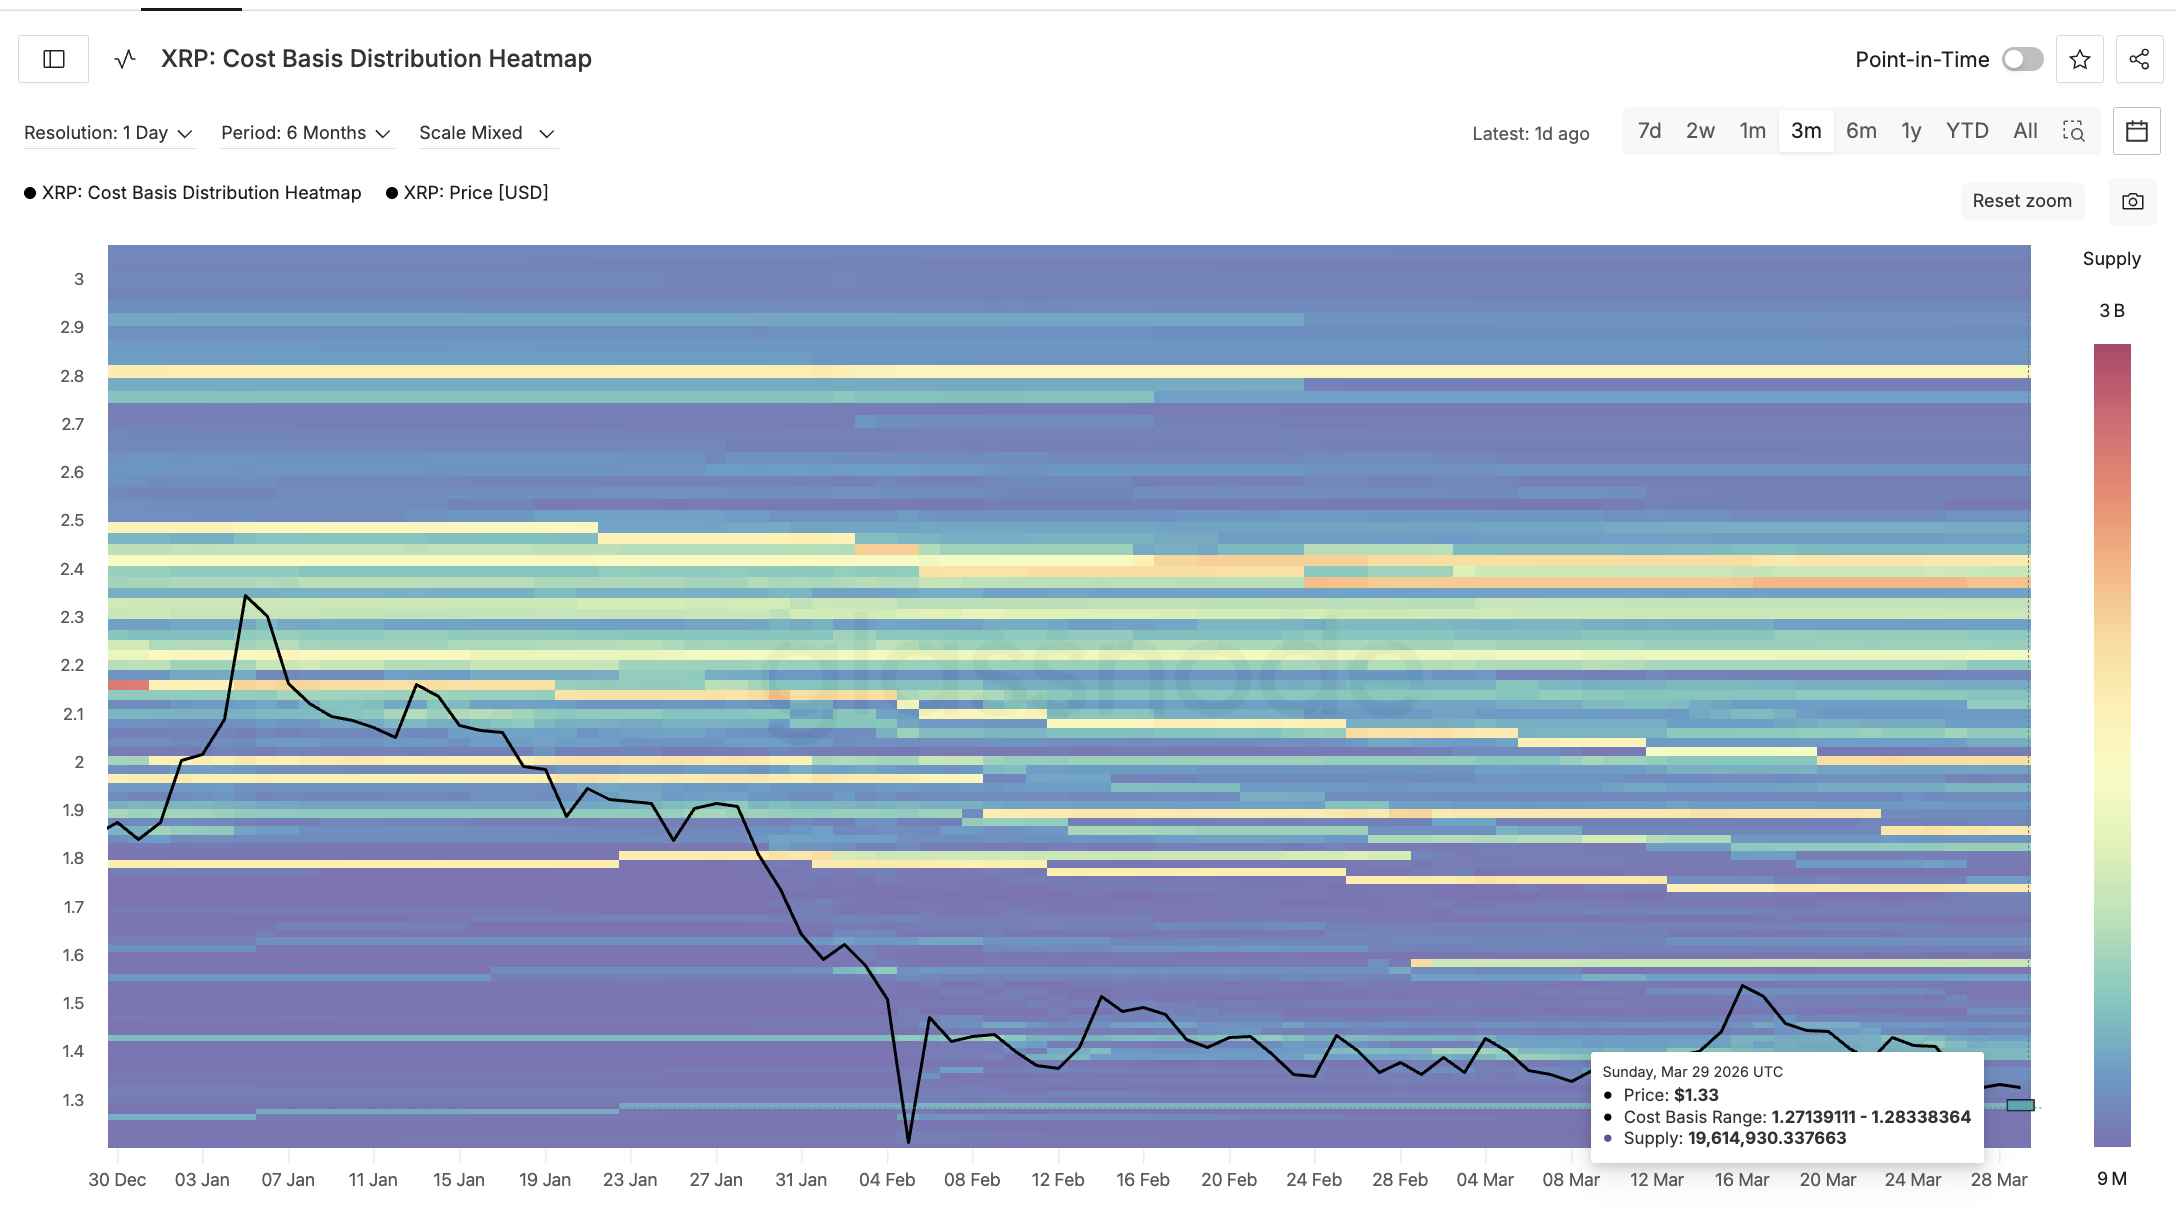
If XRP falls through this cluster, the loss of that support base could accelerate selling pressure, especially with conviction holders already stepping back.
Fresh Longs Build Risk as Open Interest Shifts
The leverage picture adds another concern heading into April. Open interest dropped from $975.77 million on March 17 to a low of $723.96 million by March 23, a 26% drop. It rebounded to $752.98 million.
The rebound means fresh positions are entering, not old ones being maintained.
The funding rate, which reflects the balance between long and short positions in perpetual contracts, has shifted from 0.0015% on March 17 to 0.008% currently. A rising funding rate, with open interest recovering from its lows, suggests new long positions are being opened.
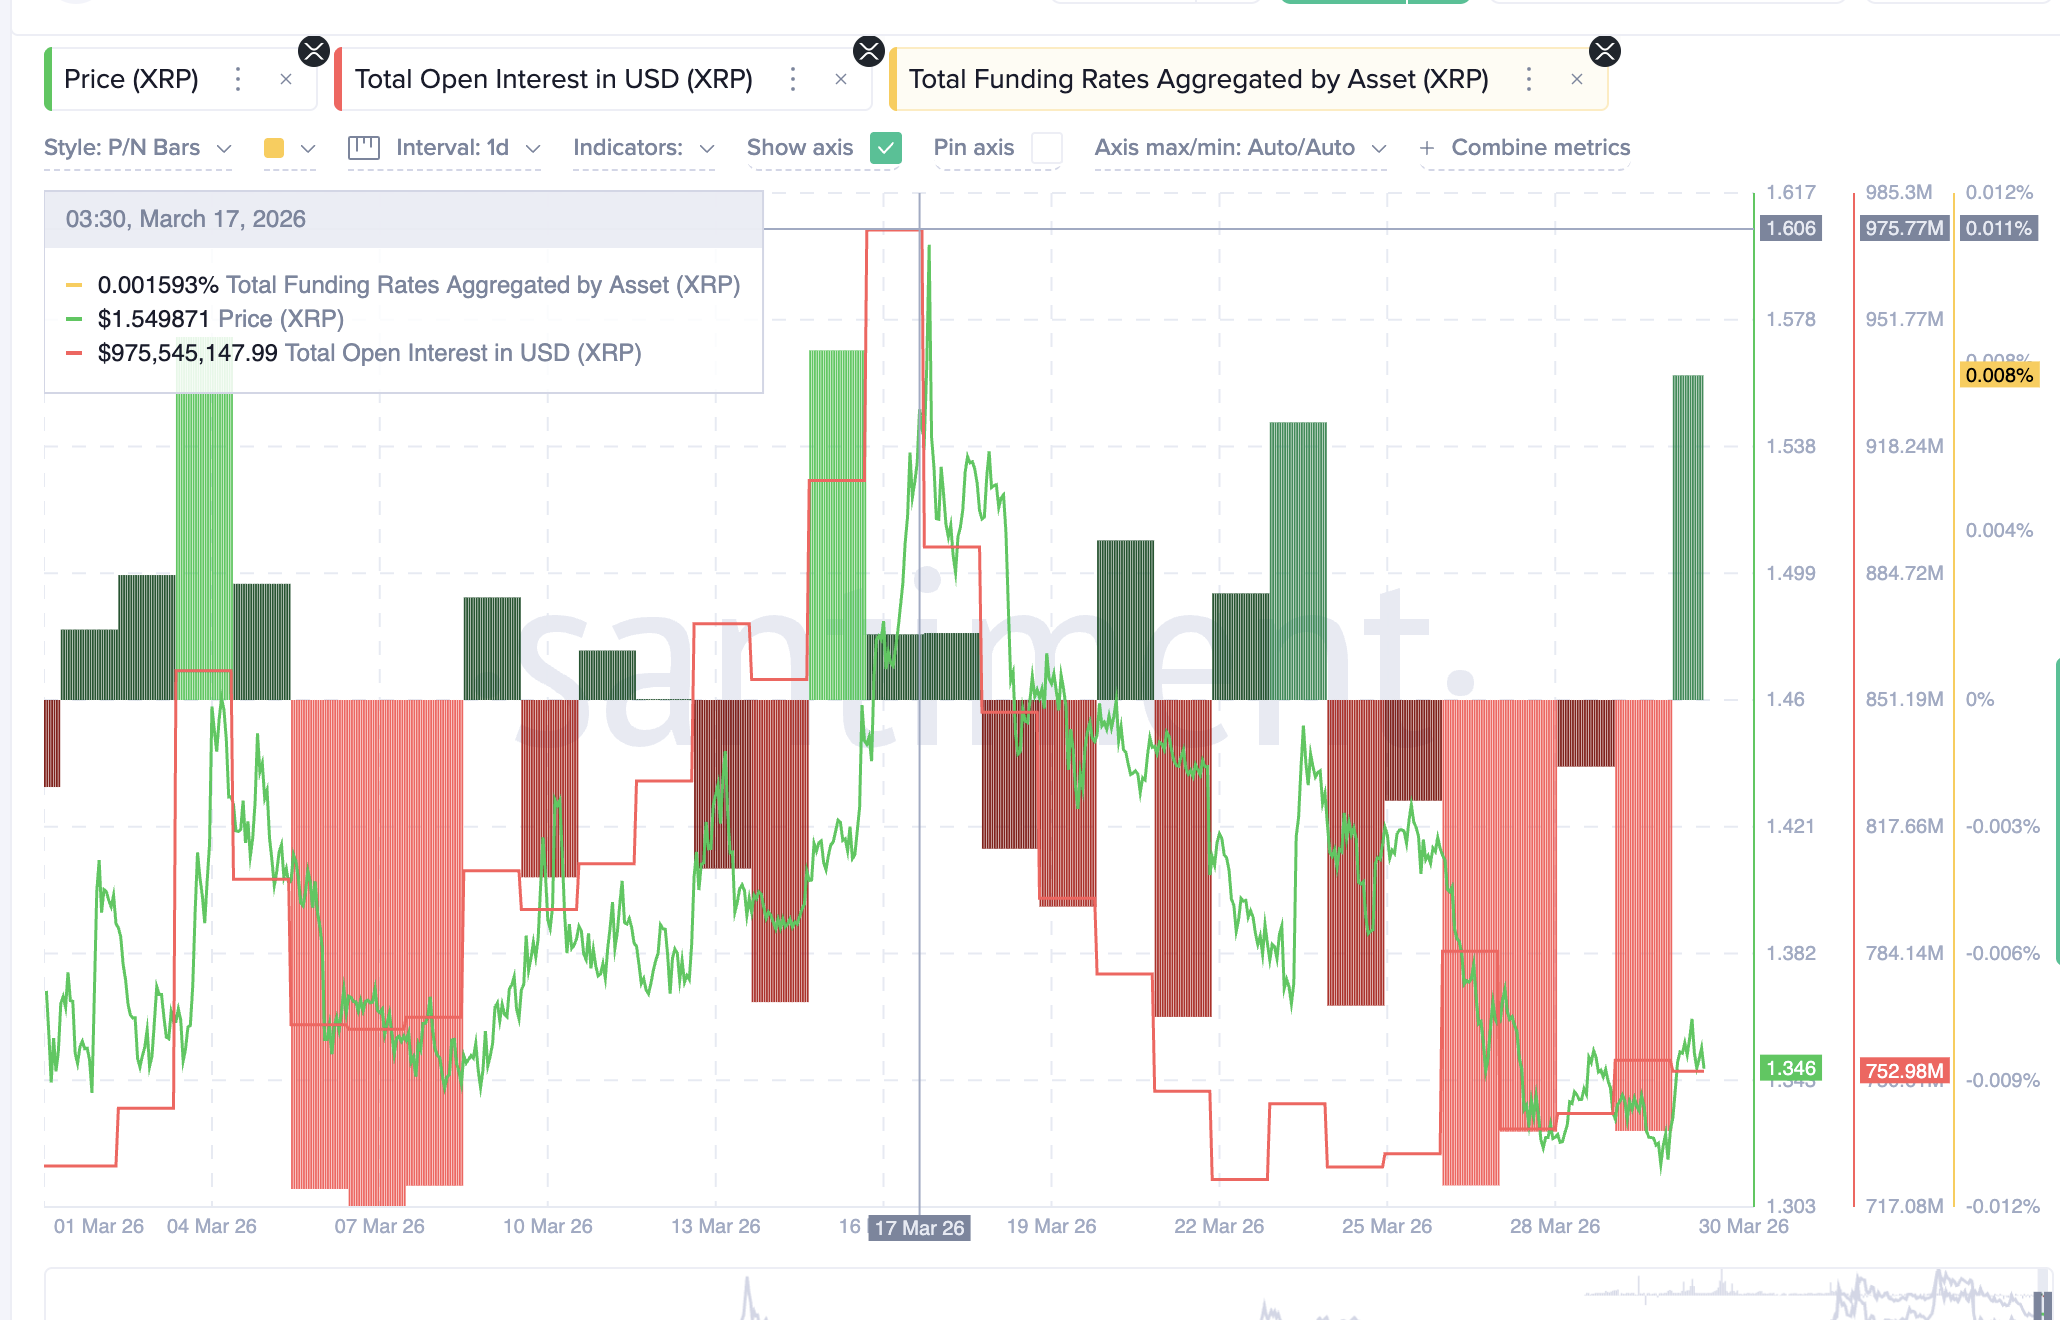
This creates a fragile setup. Shorts were liquidated during the drawdown from March 17 to March 23, but prices did not respond with a meaningful bounce.
Now longs are re-entering at elevated funding rates while the chart structure, conviction holders, and RSI all lean bearish. If XRP price breaks below the $1.27 cluster, these leveraged longs face liquidation risk, which could amplify the downside move.
XRP Price Levels To Watch in April
The most critical level for April is $1.29. It aligns with the 0.786 Fibonacci level and sits just above the dense supply cluster between $1.27 and $1.28.
A 3-day close below $1.29 exposes that cluster directly. If the cluster breaks, the next support falls to $1.20, the 1.0 Fibonacci level. Below that, $0.96 comes into play on the longer timeframe.
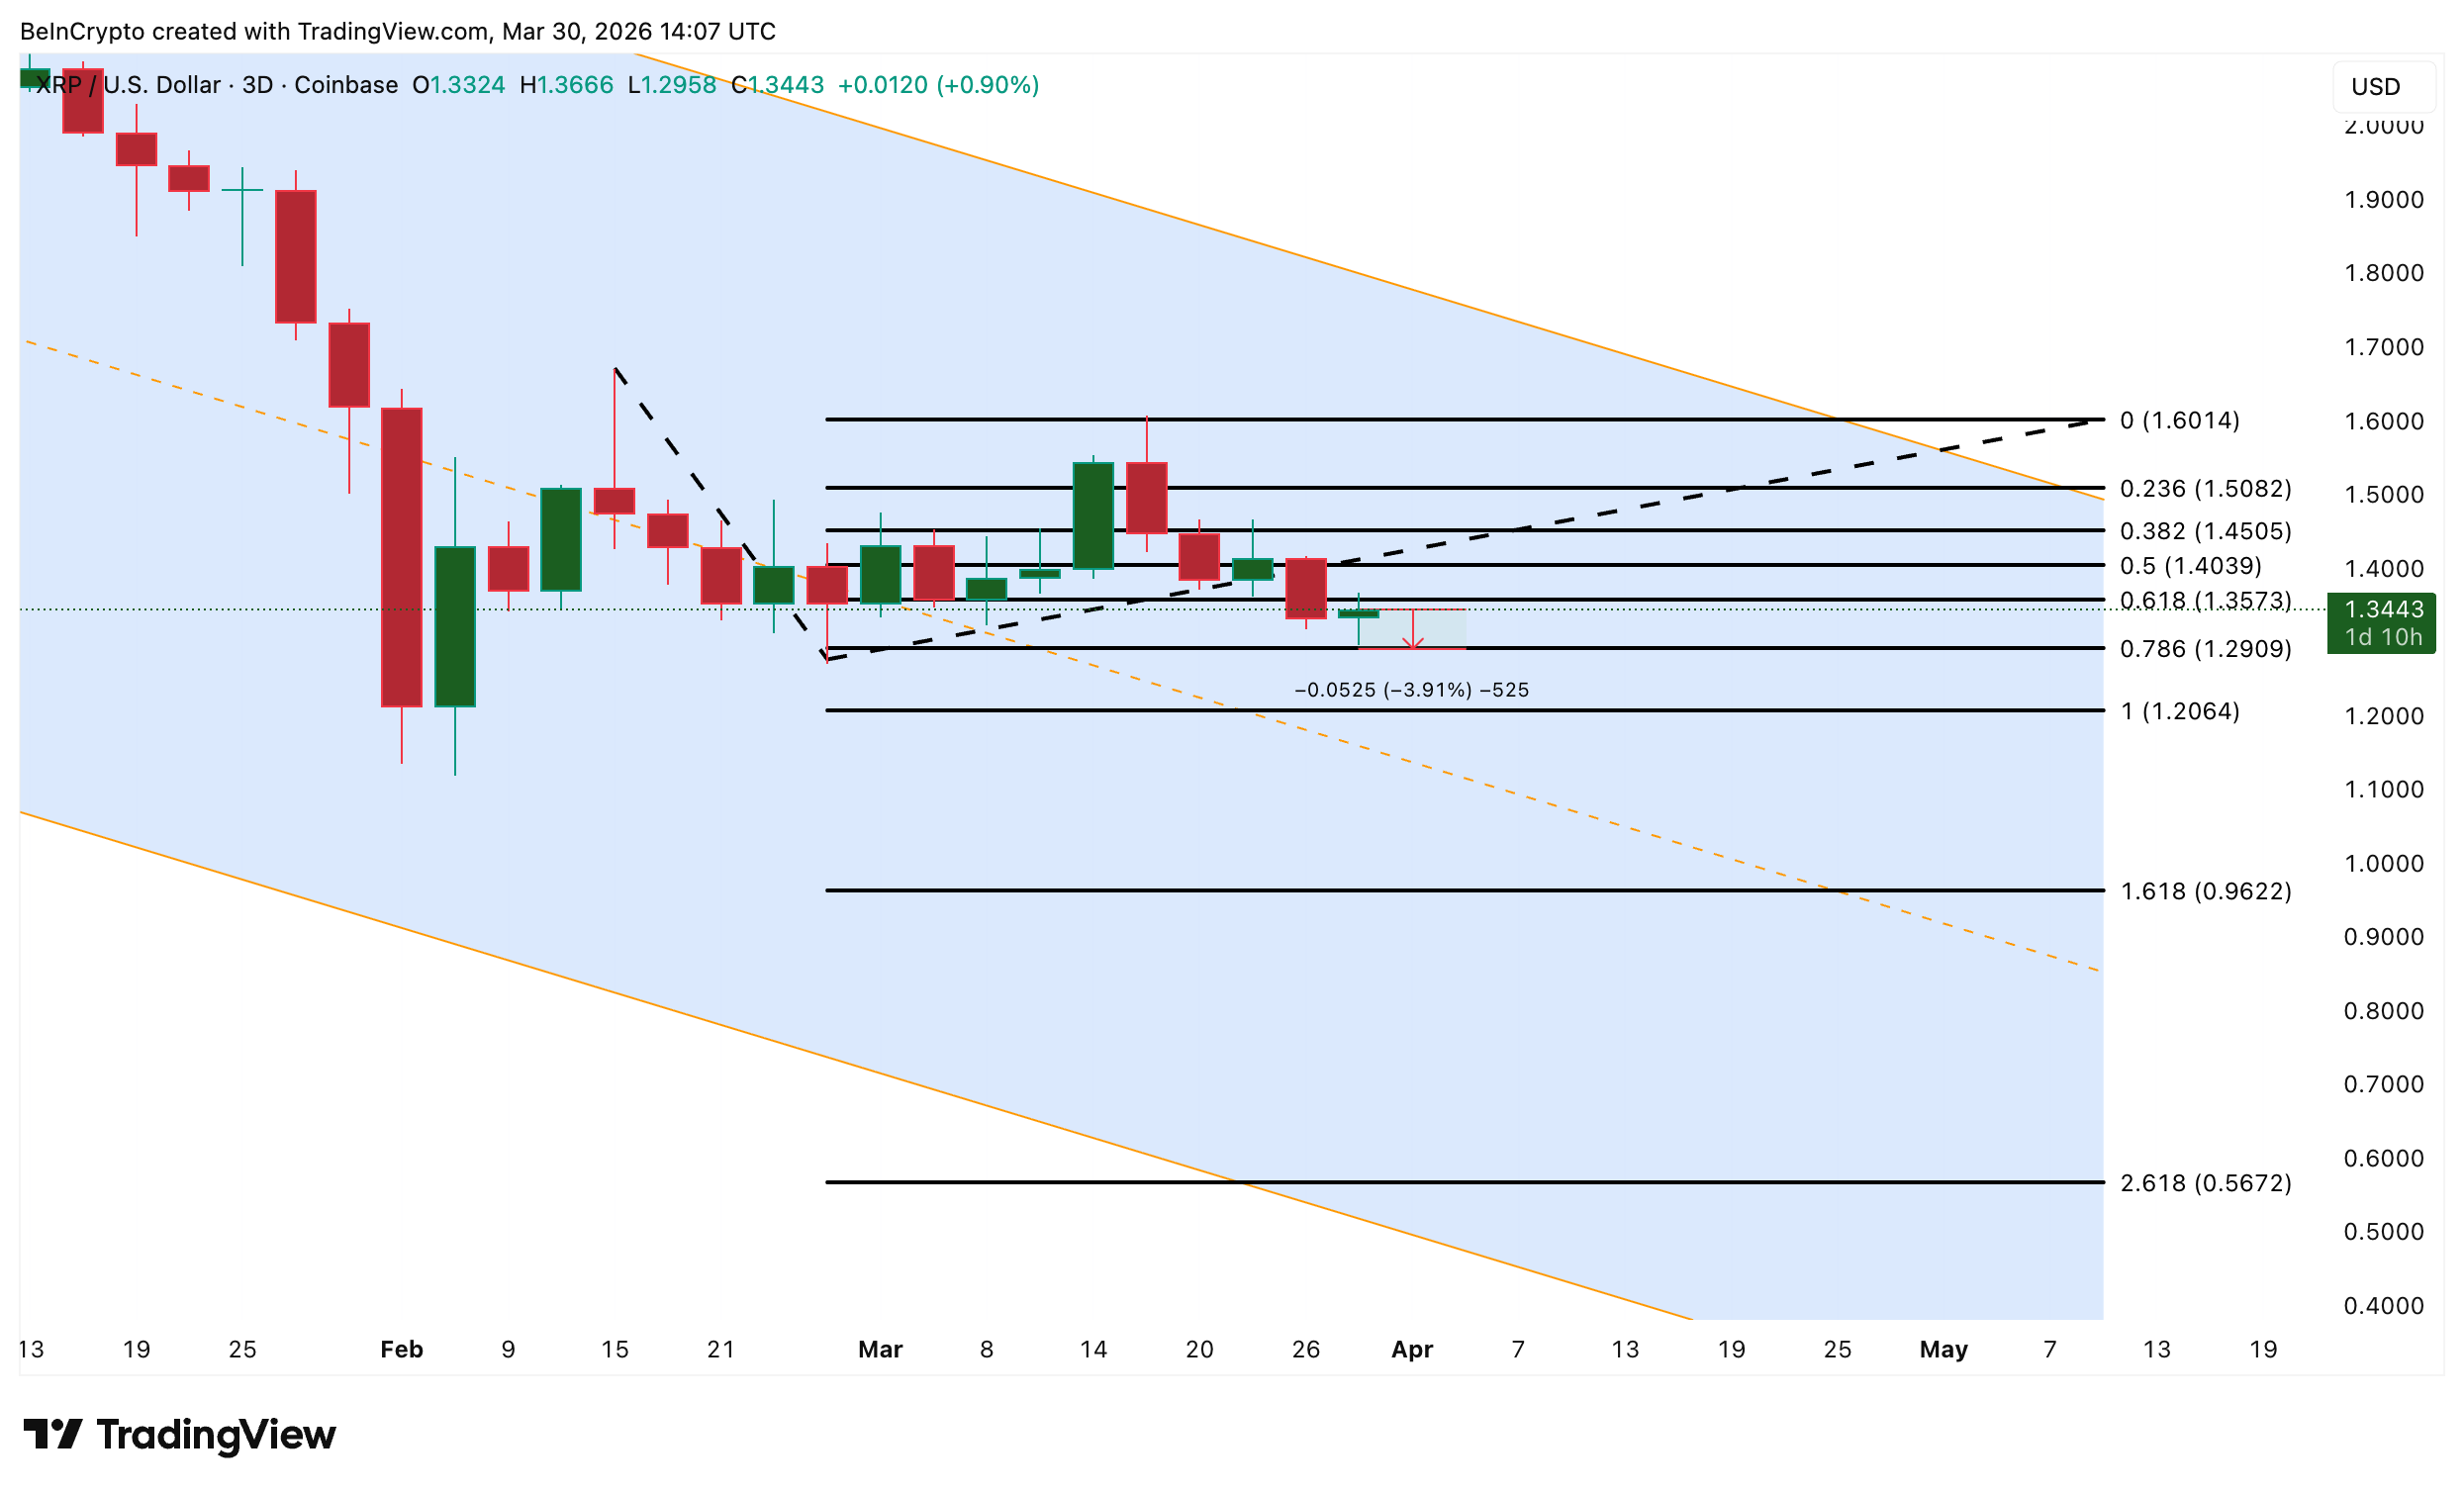
On the upside, XRP needs to reclaim $1.45 before showing any sign of recovery, followed by $1.50. A move above $1.60 would represent a clean trendline break and could shift the XRP price prediction for April from defensive to constructive.
For now, April is about defending $1.29. The death cross, the weakening conviction holders, the dense supply cluster sitting just below the current price, and the risky leverage buildup all suggest the path of least resistance still points lower.
A sustained hold above $1.45 separates a relief rally toward $1.60 from a continuation toward $1.20 or lower.
The post XRP Price Outlook For April 2026 appeared first on BeInCrypto.
Read moreLatest News