Redstone (RED) Momentum Slows as Investors Reflect Mixed Signals
Redstone (RED) has experienced a volatile week, climbing 25% over the past seven days despite pulling back 20% in the last three days.
This mixed performance reflects the current uncertainty surrounding RED’s price action. Technical indicators point to a market caught between consolidation and lingering bearish sentiment. While momentum indicators like RSI and ADX suggest weakening trend strength and growing indecision, price action continues to hold above key support levels.
RED RSI Has Been Neutral For The Past Two Days
Redstone’s RSI (Relative Strength Index) has slipped to 46.44, down from 53.93 just a day ago. This recent decline suggests that bearish pressure has been increasing, pulling momentum away from the bulls.
For the past two days, RSI has been hovering around the 50 level, which typically signals indecision in the market, as neither buyers nor sellers have had clear control.
However, the move below 50 today signals that bearish momentum is starting to tilt the scales.
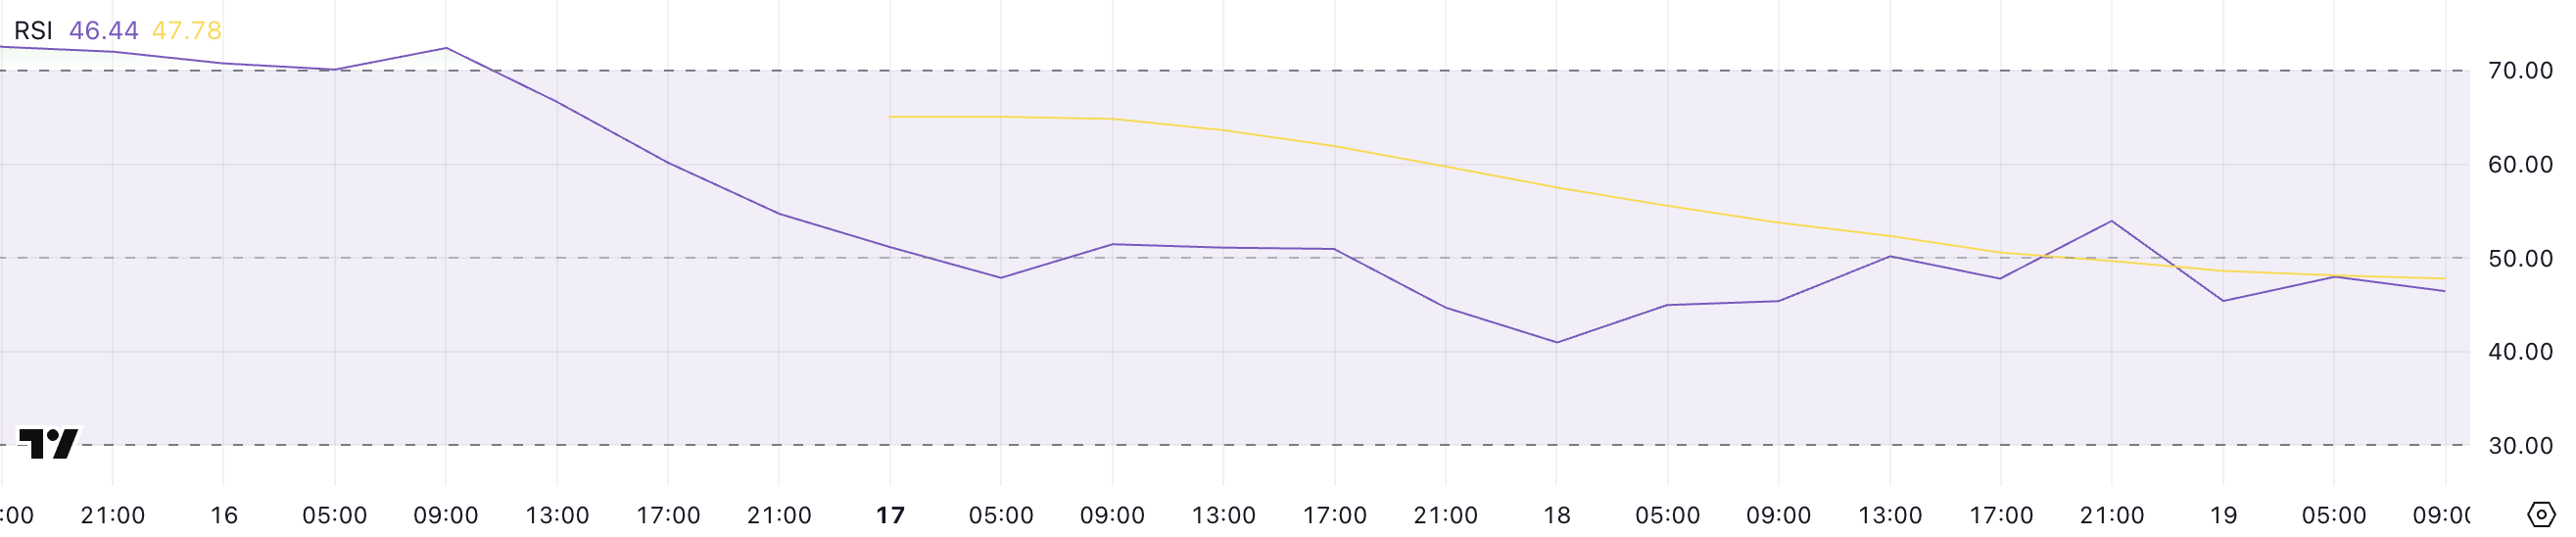
The RSI is a momentum oscillator that measures the speed and change of price movements. It typically ranges from 0 to 100. Values above 70 often indicate overbought conditions, while readings below 30 suggest oversold conditions.
The 50 mark acts as a midline that traders watch to gauge shifts in momentum—above 50 imply a bullish bias, while below 50 leans bearish.
Redstone’s RSI is now sitting at 46.44 after hovering near 50, which could mean the market is gradually tipping in favor of sellers as Redstone tries to establish itself as one of the most relevant leaders in the Oracle sector.
This shift may indicate further downside potential unless bulls regain control and push RSI back above 50 to reestablish bullish momentum.
Redstone ADX Shows The Current Downtrend Is Fading Away
Redstone’s ADX (Average Directional Index) has dropped significantly to 24.9, down from 42.6 just two days ago. This sharp decline suggests a noticeable weakening in the strength of the current trend.
Previously, with ADX at 42.6, the market experienced strong directional movement, but the drop to the current level implies that the momentum behind that trend is fading.
Despite this, Redstone is still maintaining its position within a broader downtrend, indicating that bearish conditions have not yet reversed but may be losing steam.
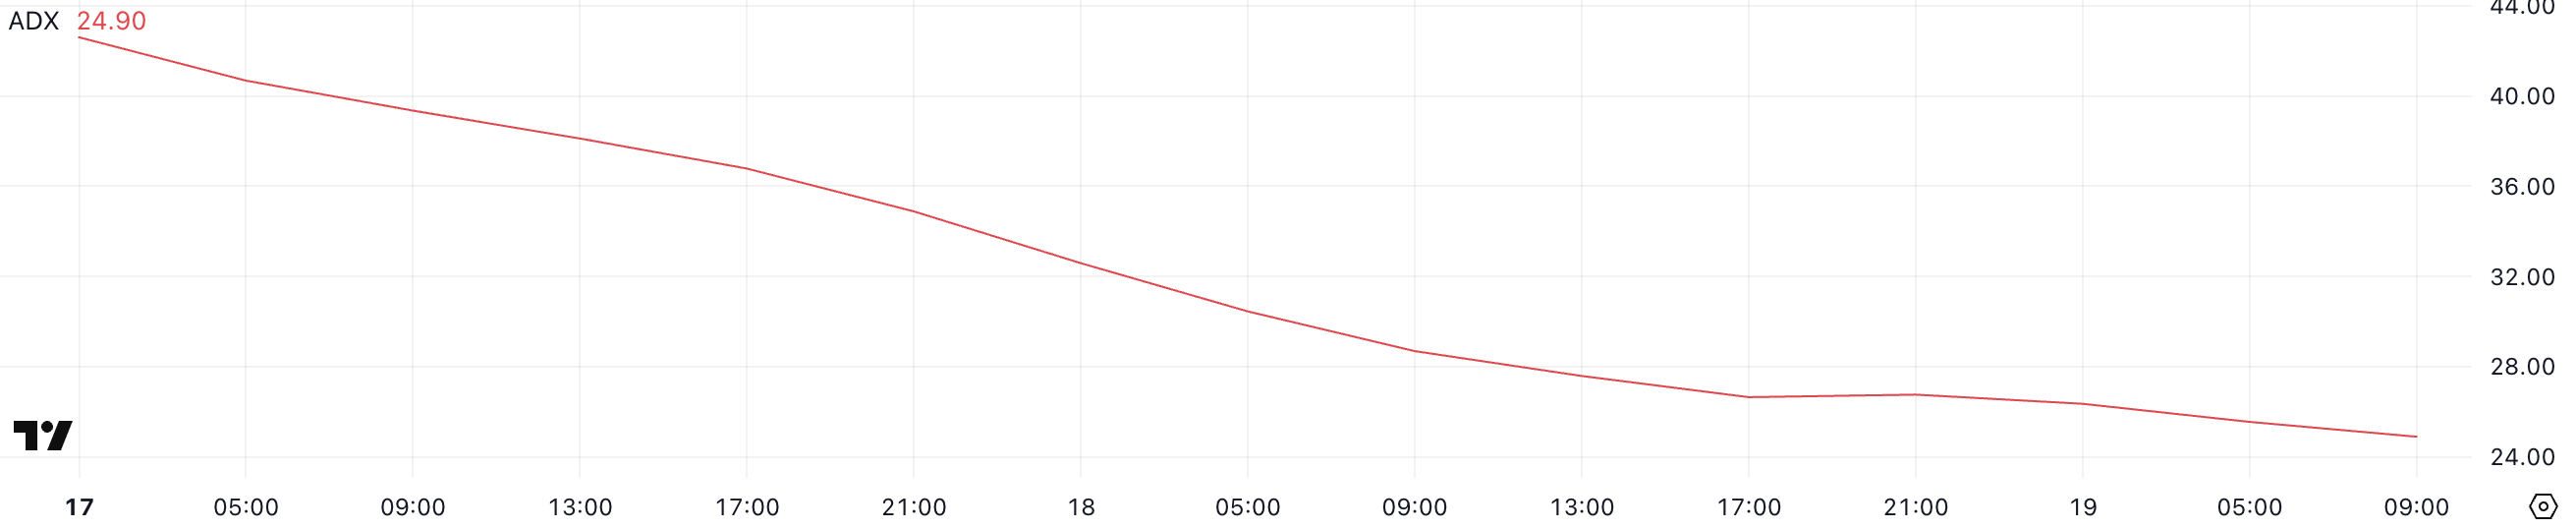
The ADX is a technical indicator used to quantify the strength of a trend without indicating its direction. Typically, ADX values above 25 suggest a strong trend, while values below 20 often indicate a weak or non-trending market.
Readings between 20 and 25 are generally considered a gray area, where the trend might be losing conviction. With Redstone’s ADX now sitting at 24.9, it points to a market where the downtrend is still present but lacks the strong momentum it recently had.
This weakening trend could lead to potential price stabilization or even a short-term bounce, but as long as the downtrend structure remains intact, caution is warranted.
Will Redstone Rise Above $1 In The Next Days?
Redstone’s EMA (Exponential Moving Average) lines continue to suggest that the asset is in a consolidation phase. Its price action is moving sideways rather than trending strongly in either direction.
A key support level has been identified at $0.65, which is currently acting as a floor for price movement. If this support is tested and broken, Redstone could potentially fall further, with downside targets around $0.50.
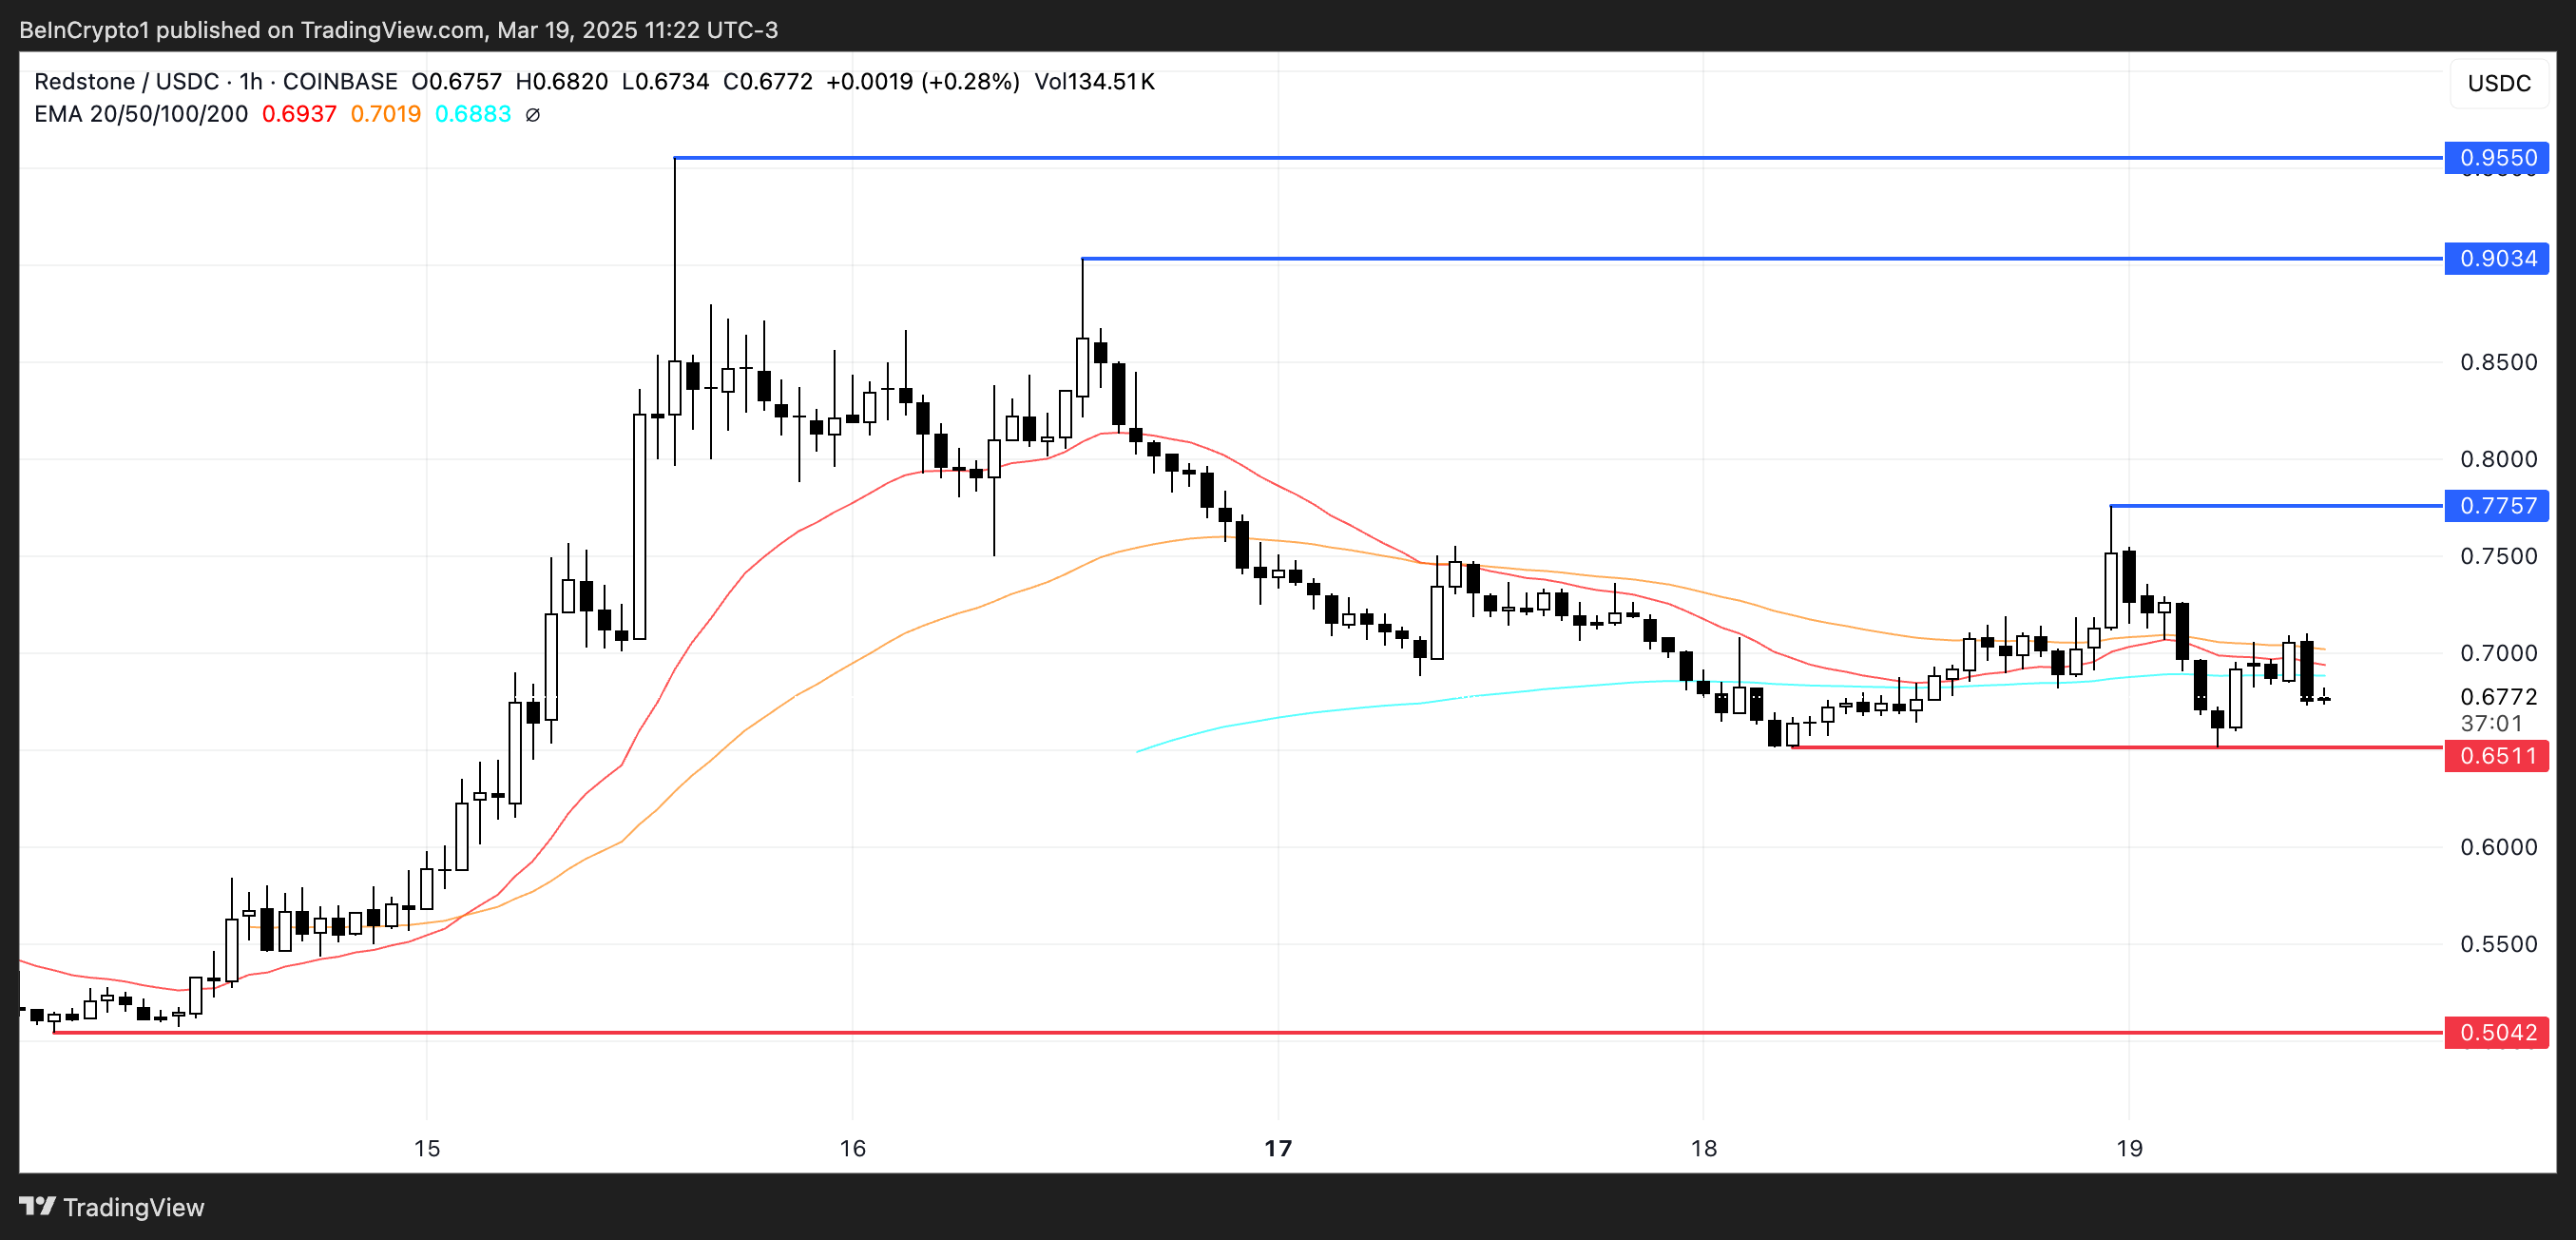
Conversely, if the price starts to build bullish momentum, Redstone could attempt to break through resistance at $0.77. A successful breakout above this level could open the path toward $0.90 and $0.95, with the possibility of finally reclaiming the $1 mark for the first time since March 3, potentially making it one of the most trending altcoins in the market.
In Redstone’s case, the EMA lines reflecting sideways movement point to indecision among market participants. For now, the $0.65 support is pivotal – holding it could give bulls room to stage a rally while losing it could invite stronger selling pressure.
The post Redstone (RED) Momentum Slows as Investors Reflect Mixed Signals appeared first on BeInCrypto.
Read moreLatest News