Pi Coin Fell 38% Last Time This Happened — History Is Rhyming
Pi Coin (PI) price is trading at $0.178, down 3.26% on the day. It is pressing against the 0.236 Fibonacci level at $0.189. The price chart is repeating a structure from November and December 2025.
On-chain indicators are following the same sequence with a one-cycle lag. The December precedent did not end well for PI.
CMF Is Repeating Pi Coin’s December Collapse
The CMF peaked near 0.30 in mid-March 2026 as PI surged toward $0.299. It has since fallen in a straight line to -0.11. The descending blue trendline shows no flattening or base formation.
The December 2025 precedent is annotated on the chart. CMF peaked near 0.25 in late November before declining identically. It eventually reached -0.20 as PI’s price fell 38.19% over 56 days. That drop ran from the $0.220 consolidation zone to $0.139.
Want more token insights like this? Sign up for Editor Harsh Notariya’s Daily Crypto Newsletter here.
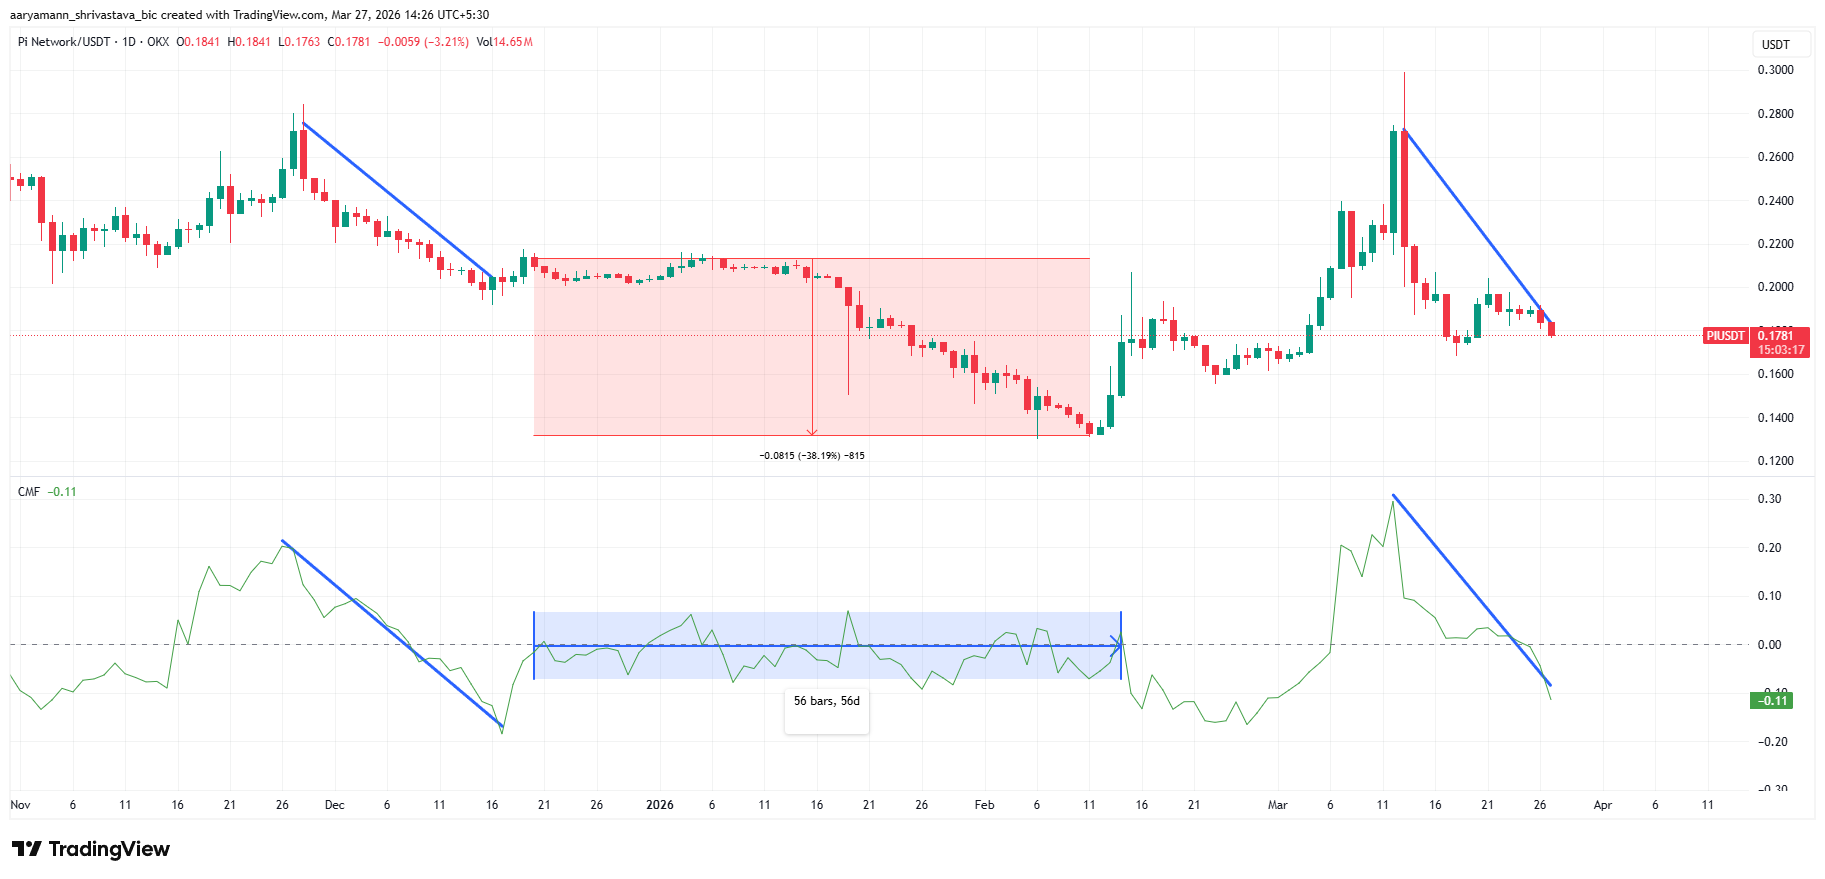
At -0.11, CMF has not yet reached the prior trough of -0.20. The indicator has roughly the same distance still to travel. That remaining leg lower would coincide with sustained selling pressure on the price.
Pi Coin Has Not Hit the Reversal Zone Yet
The MFI chart covers November 2025 through March 27, 2026. The pink-annotated box highlights the December 2025 episode. MFI dropped below 20 while the price continued lower regardless. The oversold reading did not trigger a reversal.
PI only bottomed when CMF found its floor near -0.20. Current MFI stands at 35.23, still above the 20-level threshold. The indicator is declining but has not entered the previously ineffective support zone.
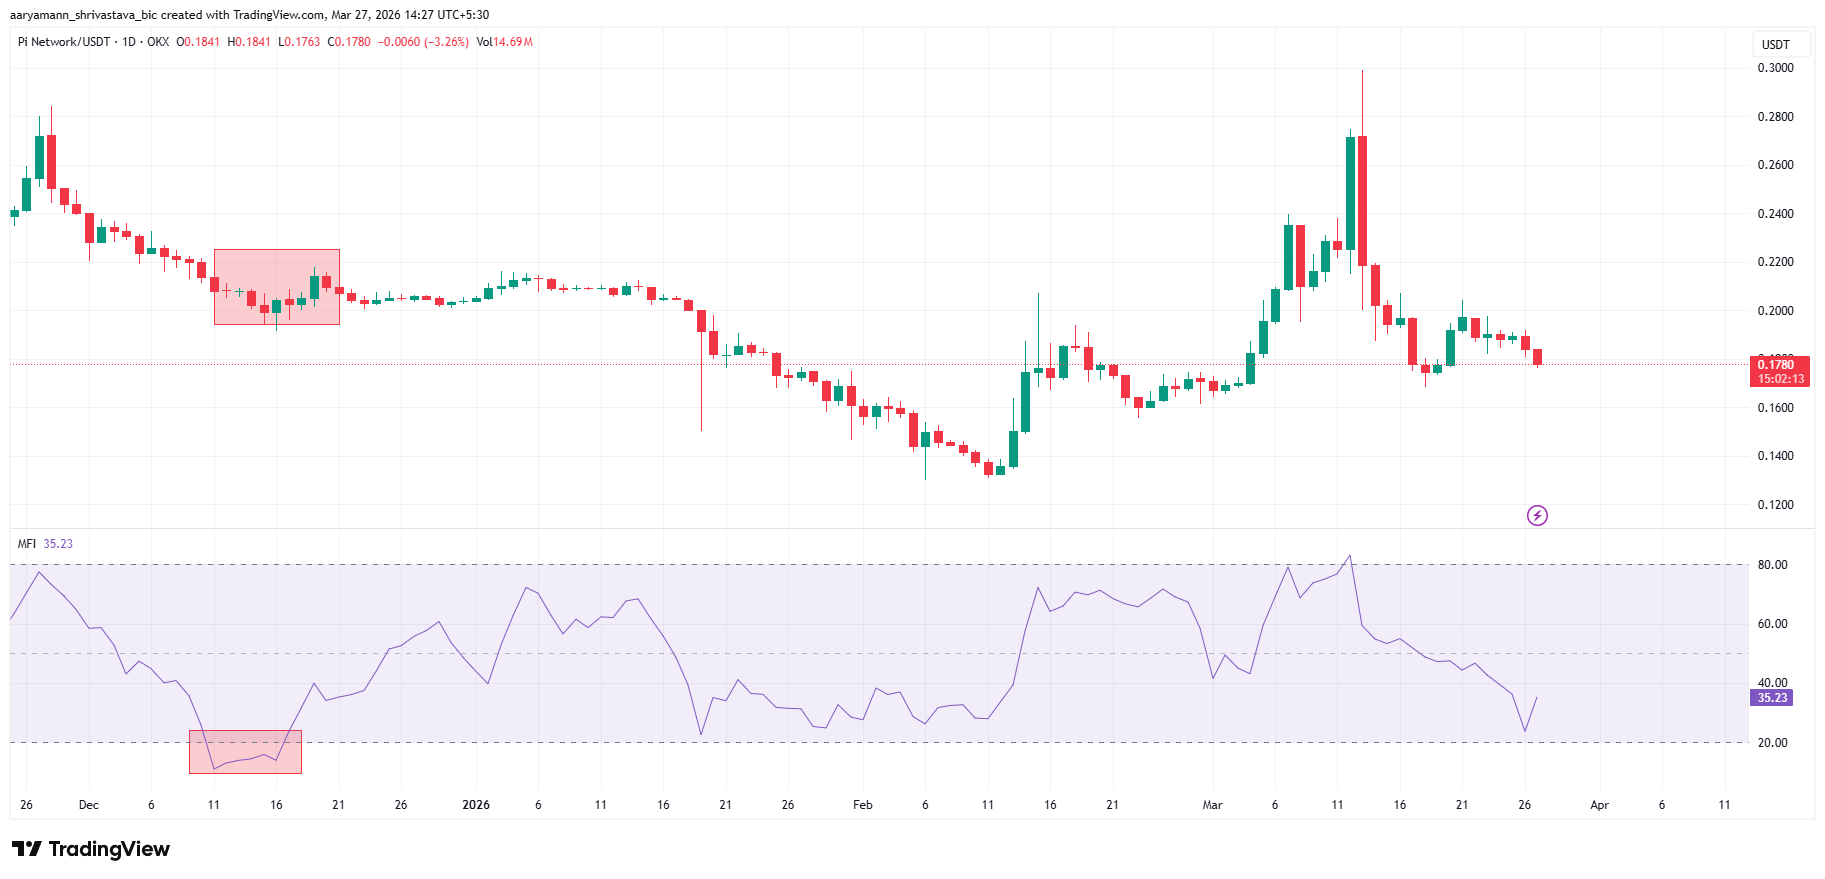
The prior oversold MFI reading came with nearly two months of near-zero CMF readings before recovery. If that same duration repeats from the current CMF entry of -0.11, meaningful recovery would not begin until late May.
PI Coin Price May See Some Decline
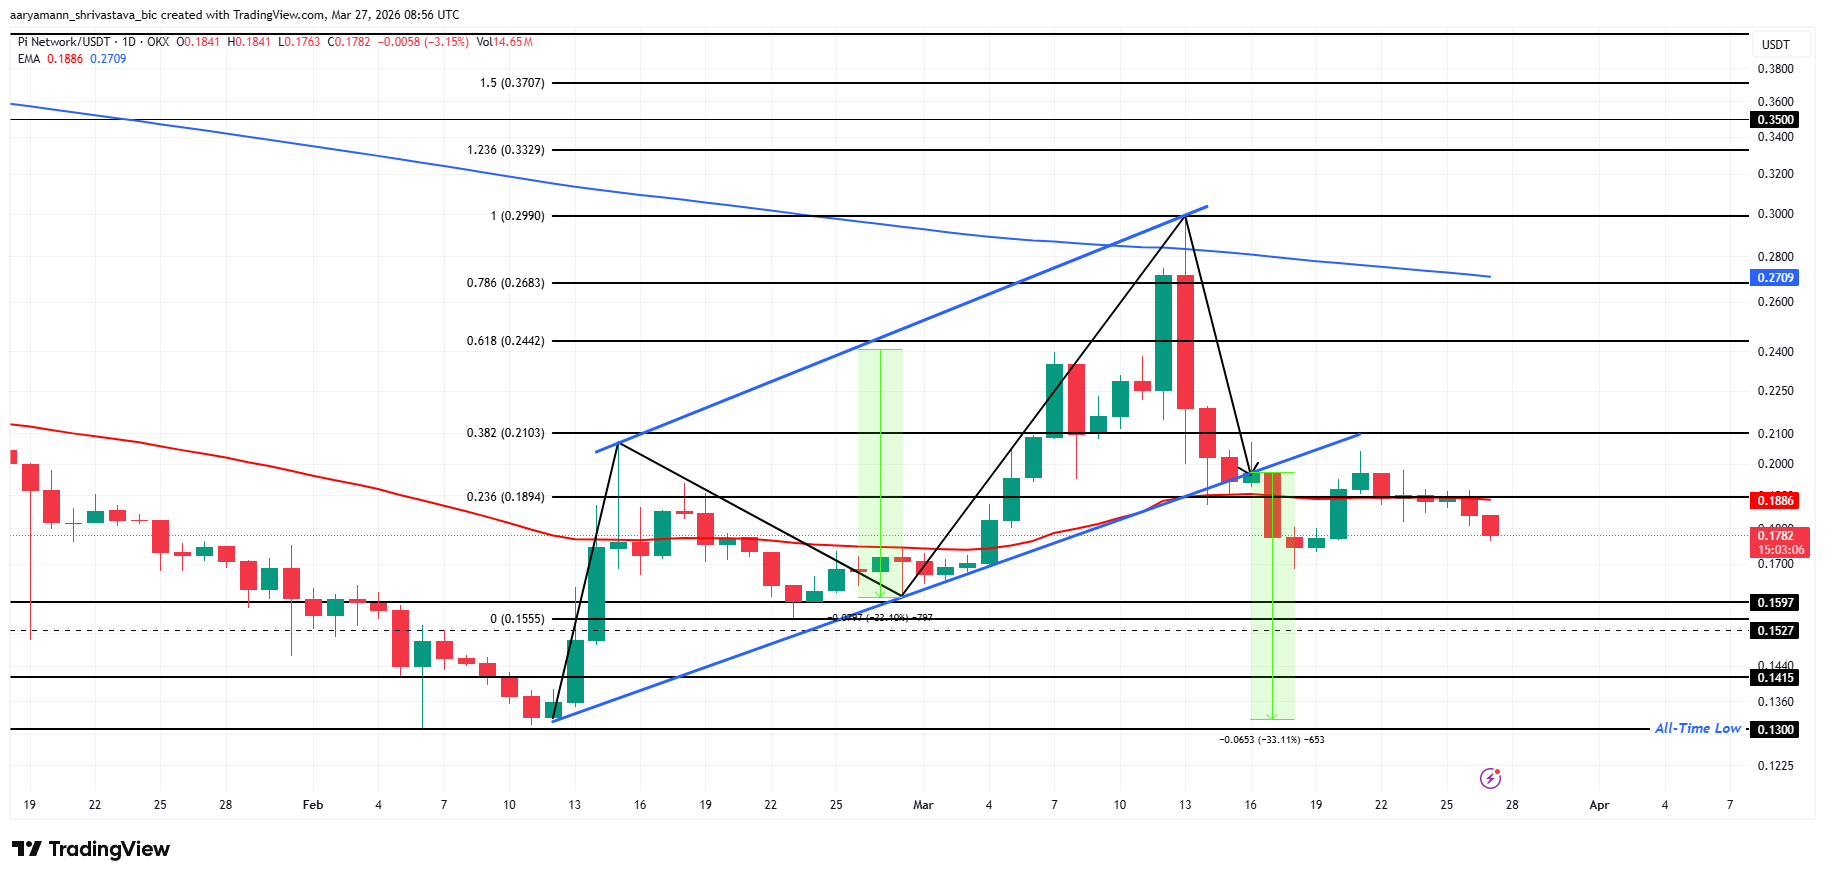
The Fibonacci chart shows Pi Coin price at $0.178, sitting between the 0.236 level at $0.189 and the zero level at $0.155. The 50-day EMA sits at $0.188 and the 200-day EMA at $0.270. Both slope downward and act as resistance.
The double top pattern projects a 33.11% measured move decline. That target lands at $0.130, which is also the all-time low. Downside runs through $0.159, then $0.141 before $0.130 comes into range.
CMF trajectory and the December precedent both suggest support levels will be tested sequentially. Capital flows remaining negative make durable floors unlikely at any of those levels.
Bullish invalidation requires a daily close above $0.210. Above that, $0.244 and then $0.268 become the next targets for Pi Coin price. A recovery above $0.268 would break the double top entirely and shift the bias back to neutral.
The post Pi Coin Fell 38% Last Time This Happened — History Is Rhyming appeared first on BeInCrypto.
Read moreLatest News