
MicroStrategy Volatility Hits 106% as Volume Collapses—$124 Now in Focus
Strategy Inc (MSTR) jumped 6% on Monday as Bitcoin’s weekend bounce finally hit equities. But Tuesday’s pre-market at $131 is already giving it all back. That’s roughly a 5% swing from Monday’s close, at press time.
With weekly traded value down 67% from February highs and volatility at 106%, the thinning liquidity of MicroStrategy stock could amplify what the technicals are already signaling. And $124 is the level where it gets dangerous.
Bitcoin Bounces, But Volume and Volatility Tell a Different Story
Bitcoin crashed to $63,000 over the weekend after the US-Iran conflict, then bounced by Sunday night. MSTR, being a stock, couldn’t react until Monday. So Friday’s close near $129 had two days of Bitcoin price action compressed into a single opening candle — the stock gapped up and rallied over 6% to around $137 at yesterday’s close. But Bitcoin slipped back to $66,800 overnight, and Tuesday’s pre-market at $131 has already erased those gains.
This is the pattern. Whatever Bitcoin does over evenings and weekends, MSTR absorbs in violent bursts at market open.
That compression has pushed 30-day annualized volatility to 105.8% — the highest among major US large-caps, above Bitcoin’s 67.5% and nearly double MSTR’s own yearly average of 57.2%.
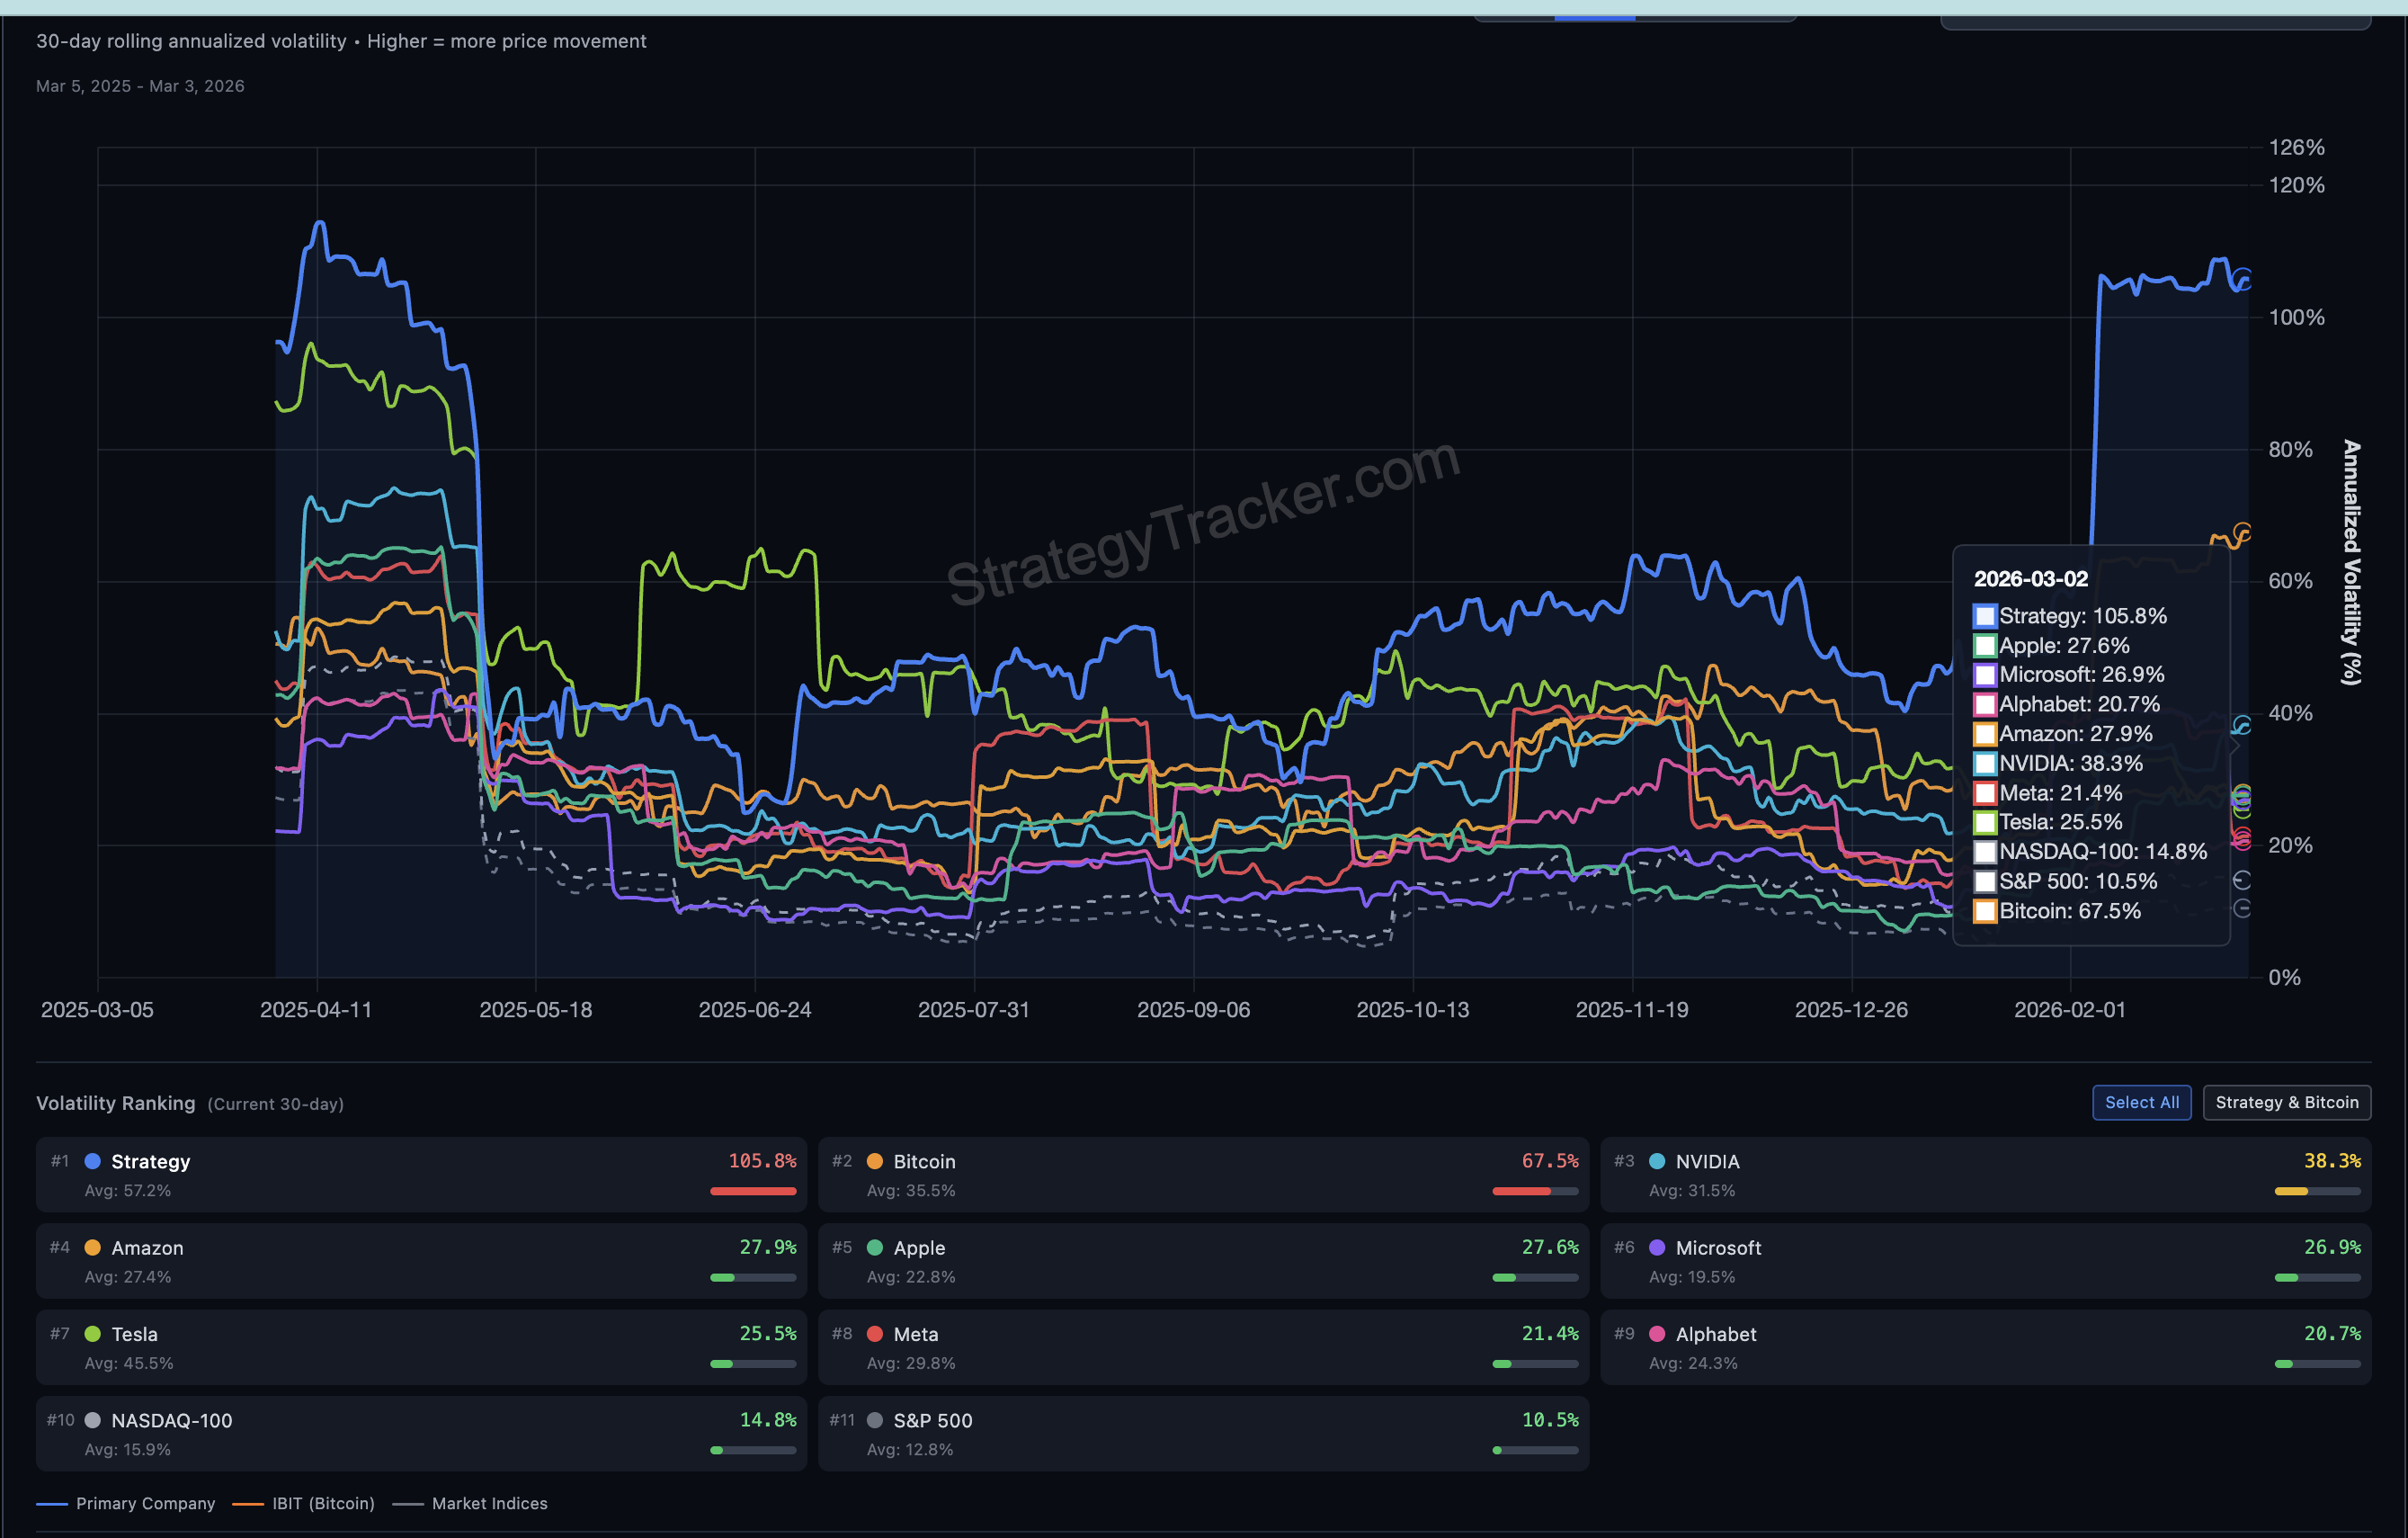
Higher volatility means sharper price swings in both directions, wider spreads, and greater risk of sudden liquidations, especially when fewer traders are around to absorb the moves, all thanks to fading participation.
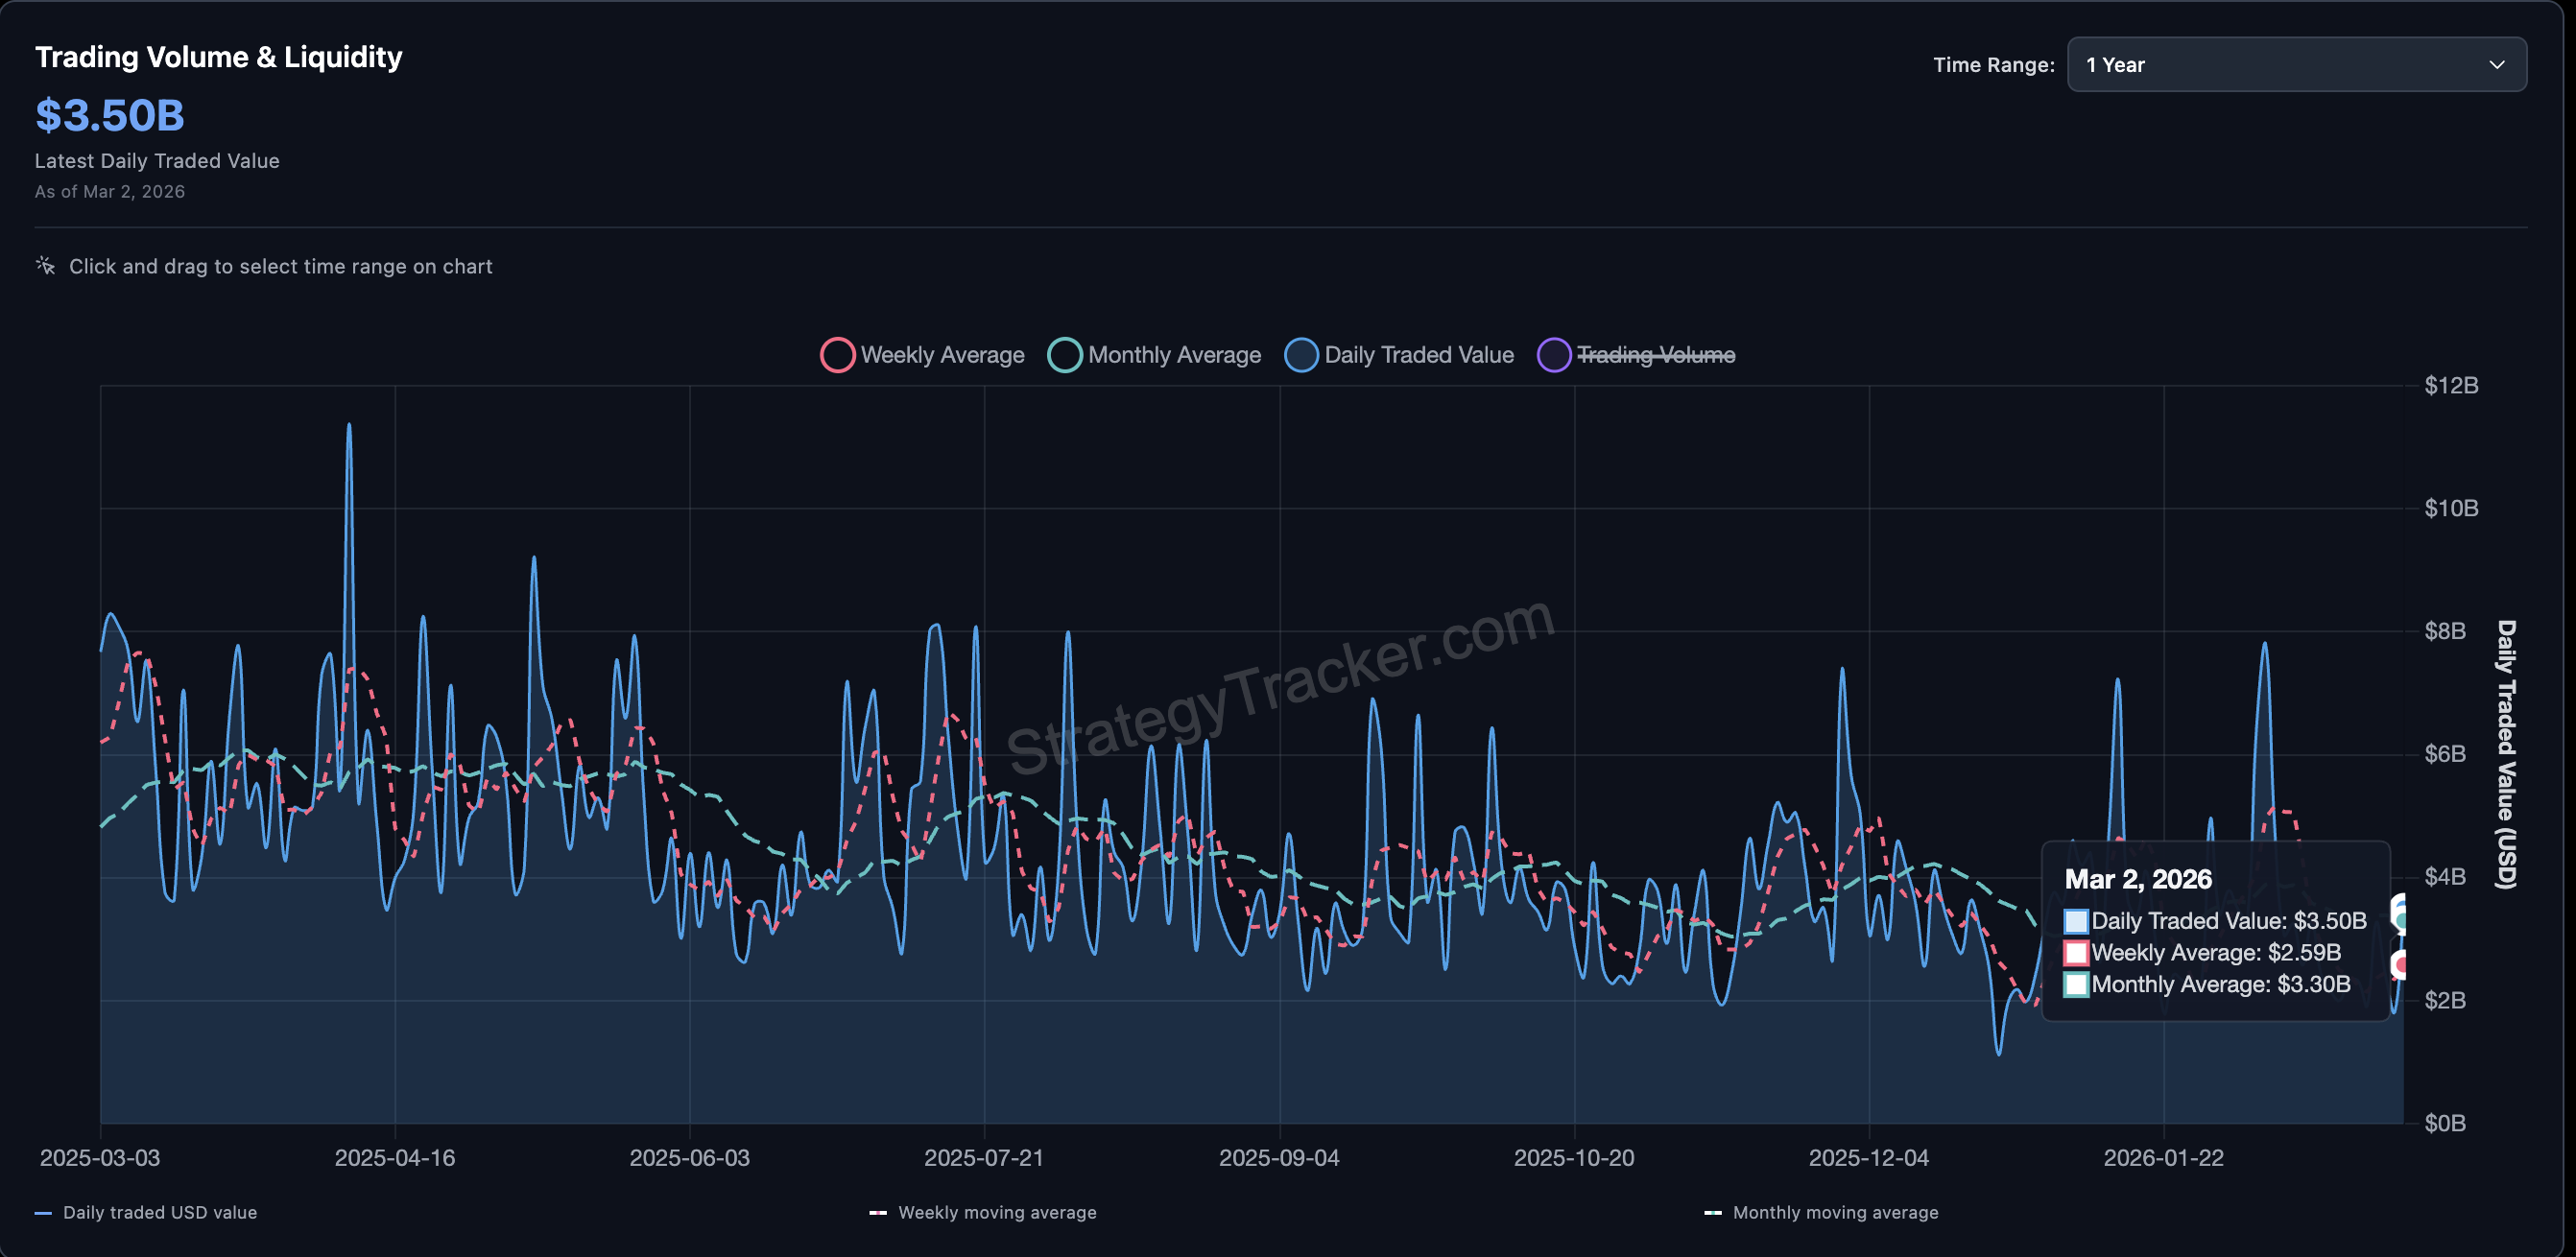
Weekly average traded value has dropped 67% from the $7.8 billion peak seen during early February, now sitting at $2.59 billion. The monthly average is $3.30 billion, a 58% decline from that same peak. Rising volatility with collapsing volume means fewer MicroStrategy shareholders are driving bigger swings, making moves less reliable and more prone to whipsaws.
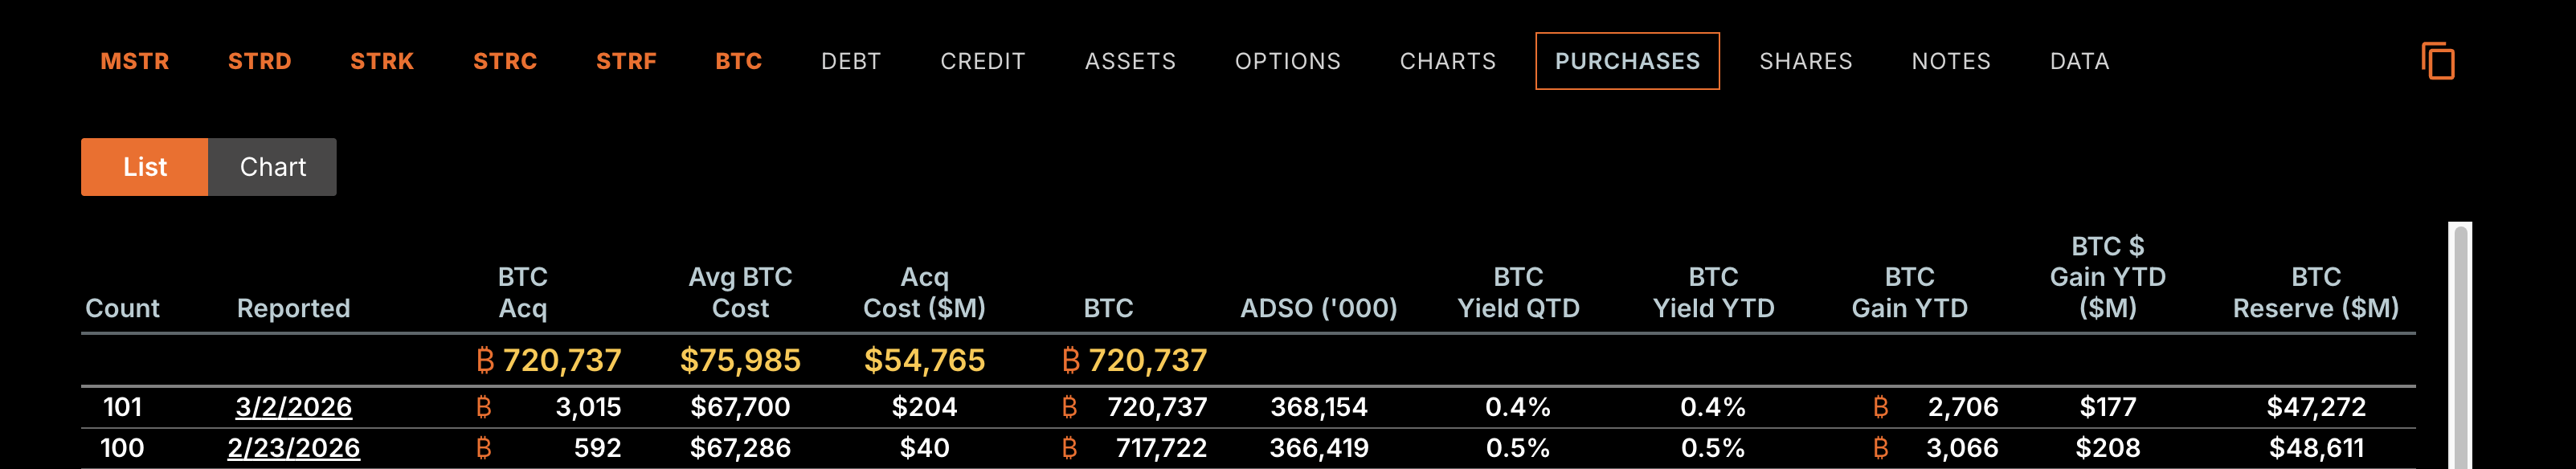
Against this backdrop, Strategy announced its 101st Bitcoin purchase on March 2. Total holdings now stand at 720,737 BTC, acquired at an average cost of $75,985.
With Bitcoin near $67,000, the position is underwater by roughly $6–7 billion. The company keeps buying. The market is not rewarding it. And the indicators under the surface suggest Monday’s bounce may just have been a one-off affair. The bearishness might just continue.
Momentum, Money Flow, and Options Activity All Fade Together
The Chaikin Money Flow (CMF) reading at 0.06 connects the 101st buy to the broader picture. CMF is often used as a proxy for institutional buying. Despite Strategy’s adding 3,015 BTC, CMF showed no sizable uptick. It has been trending lower since mid-February, along with the price. While the net CMF move looks bullish, the inability of the metric to make a higher high against the MSTR stock price points to a growing weakness.
If CMF crosses below zero (not happened yet), it confirms net money is leaving MSTR — aligning with the 67% collapse in weekly traded value.
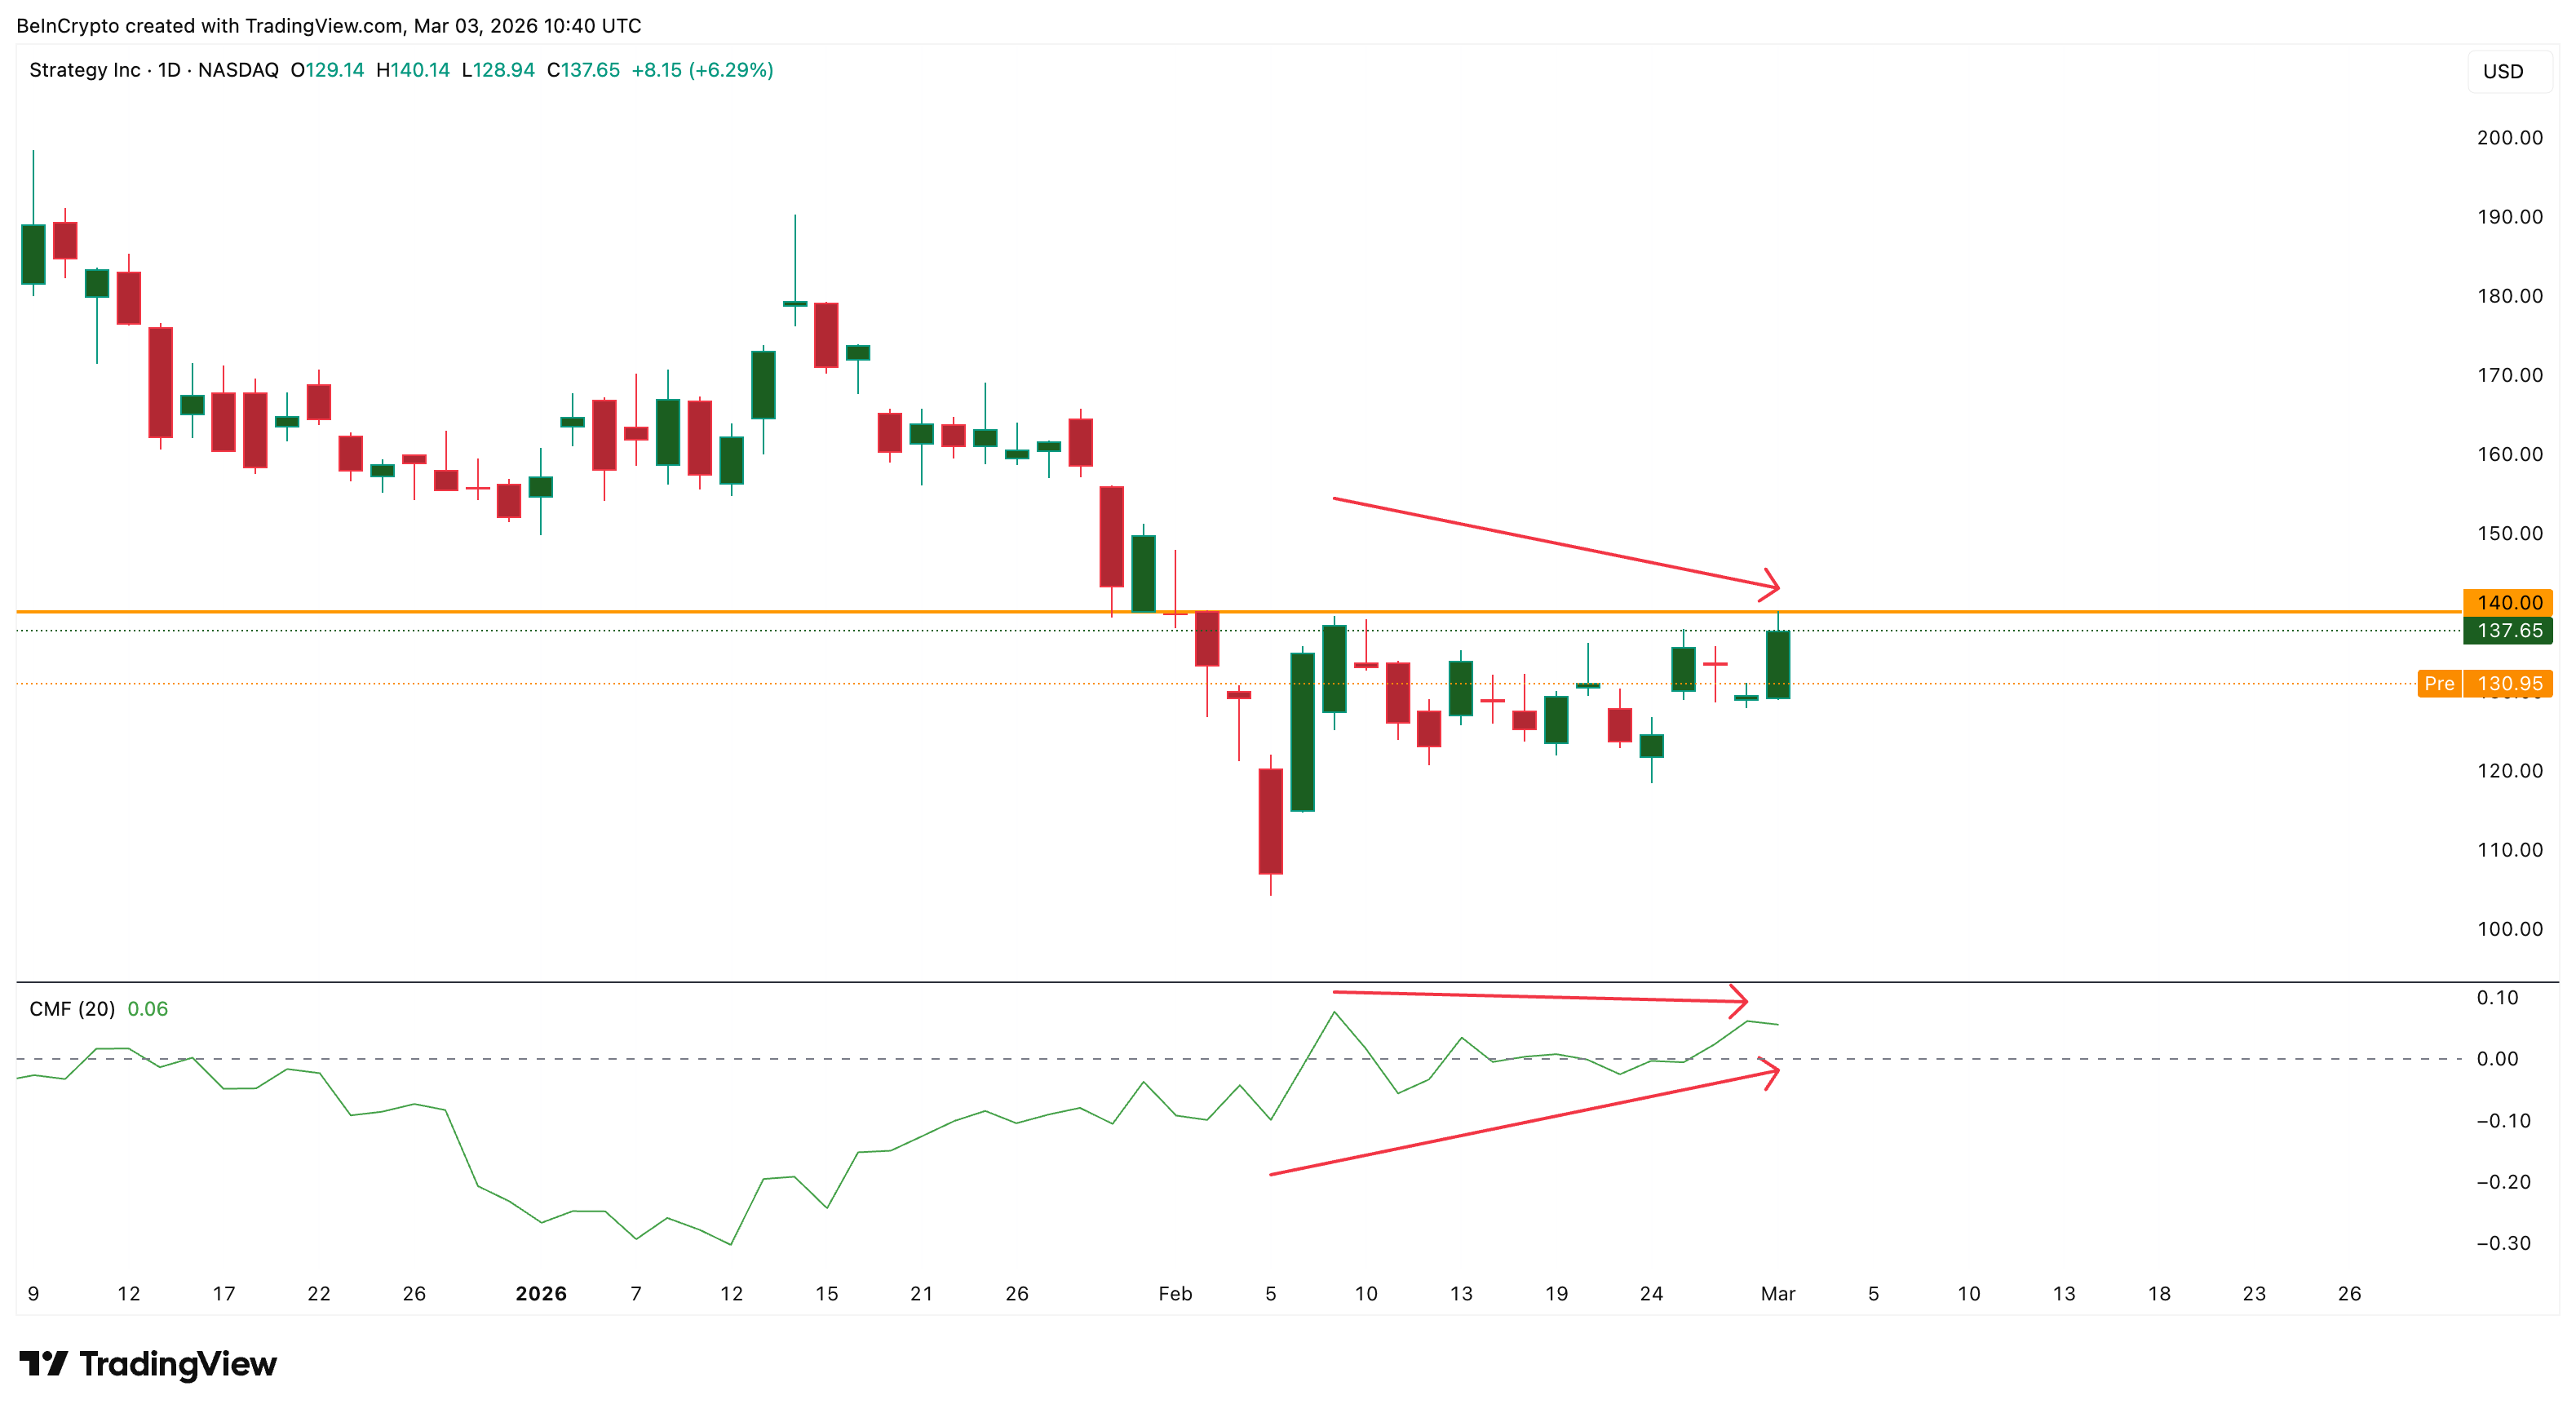
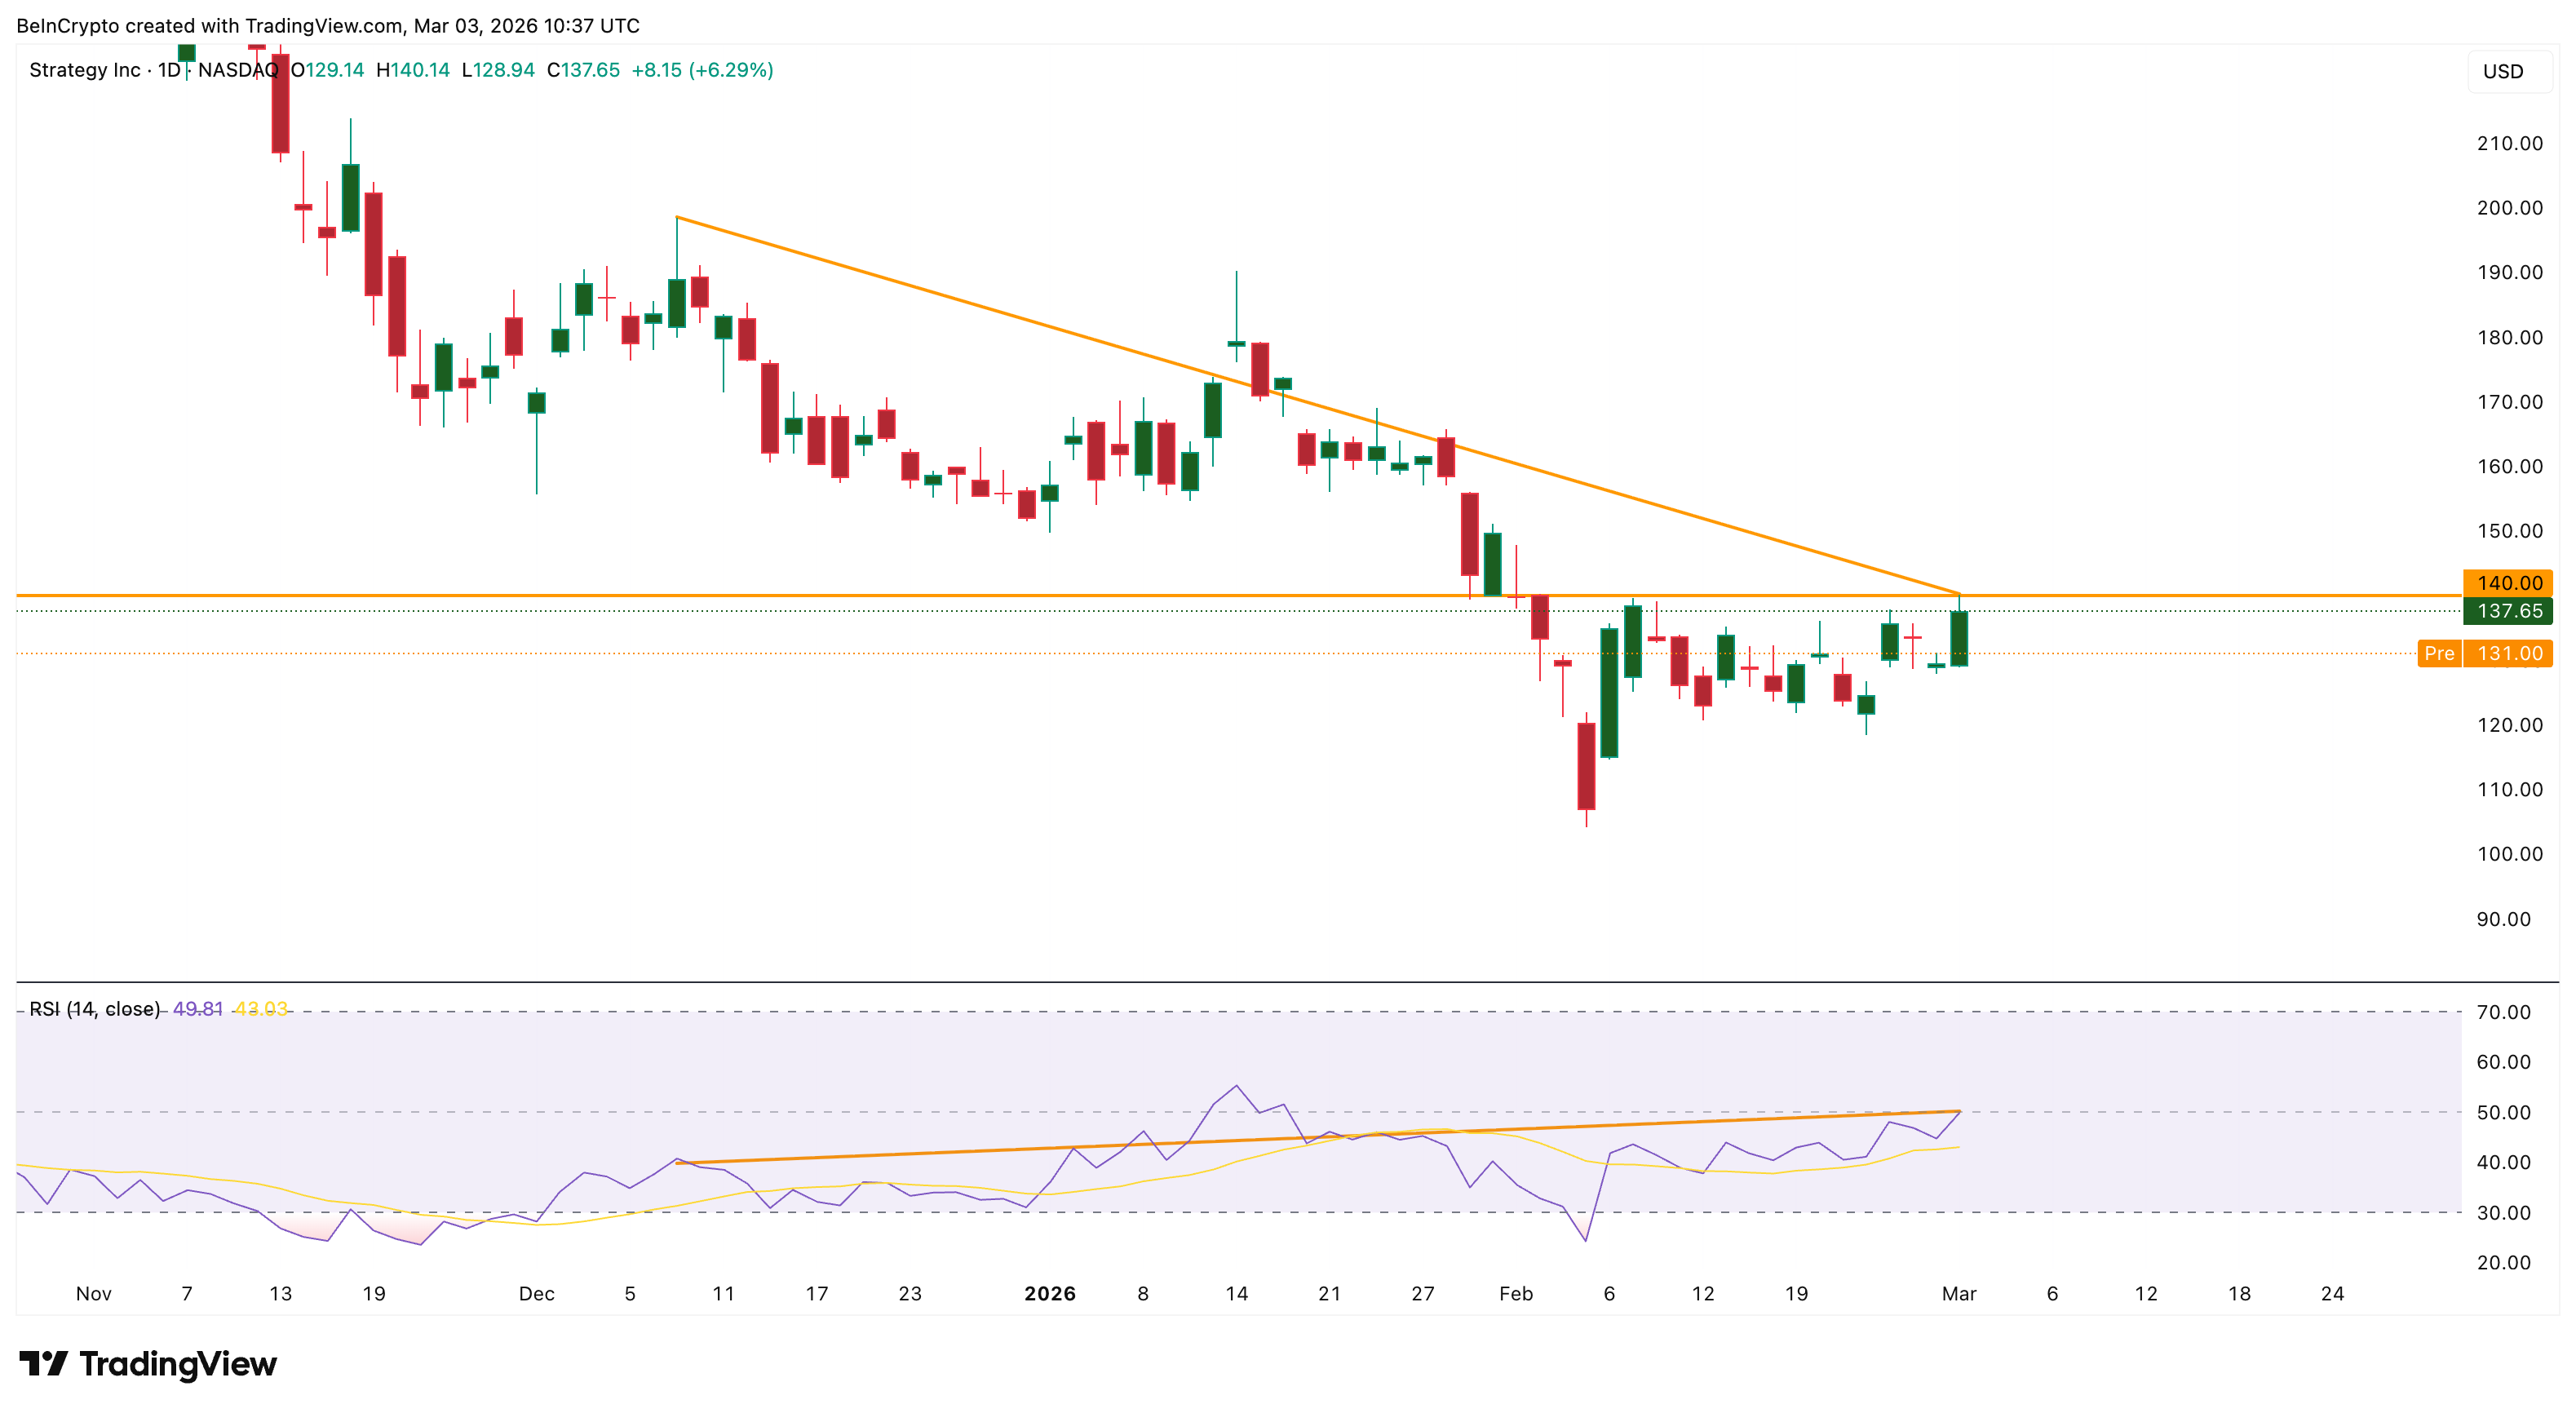
The daily Relative Strength Index (RSI), a momentum indicator, reinforces this fading momentum. Between December 9 and March 2, MSTR’s price is forming lower highs. RSI, however, is printing higher highs. This hidden bearish divergence suggests the broader downtrend may resume, and a pullback might be coming. And the weakness confirms if the net candle forms under $140.
The pre-market price is further validating that risk confirmation.
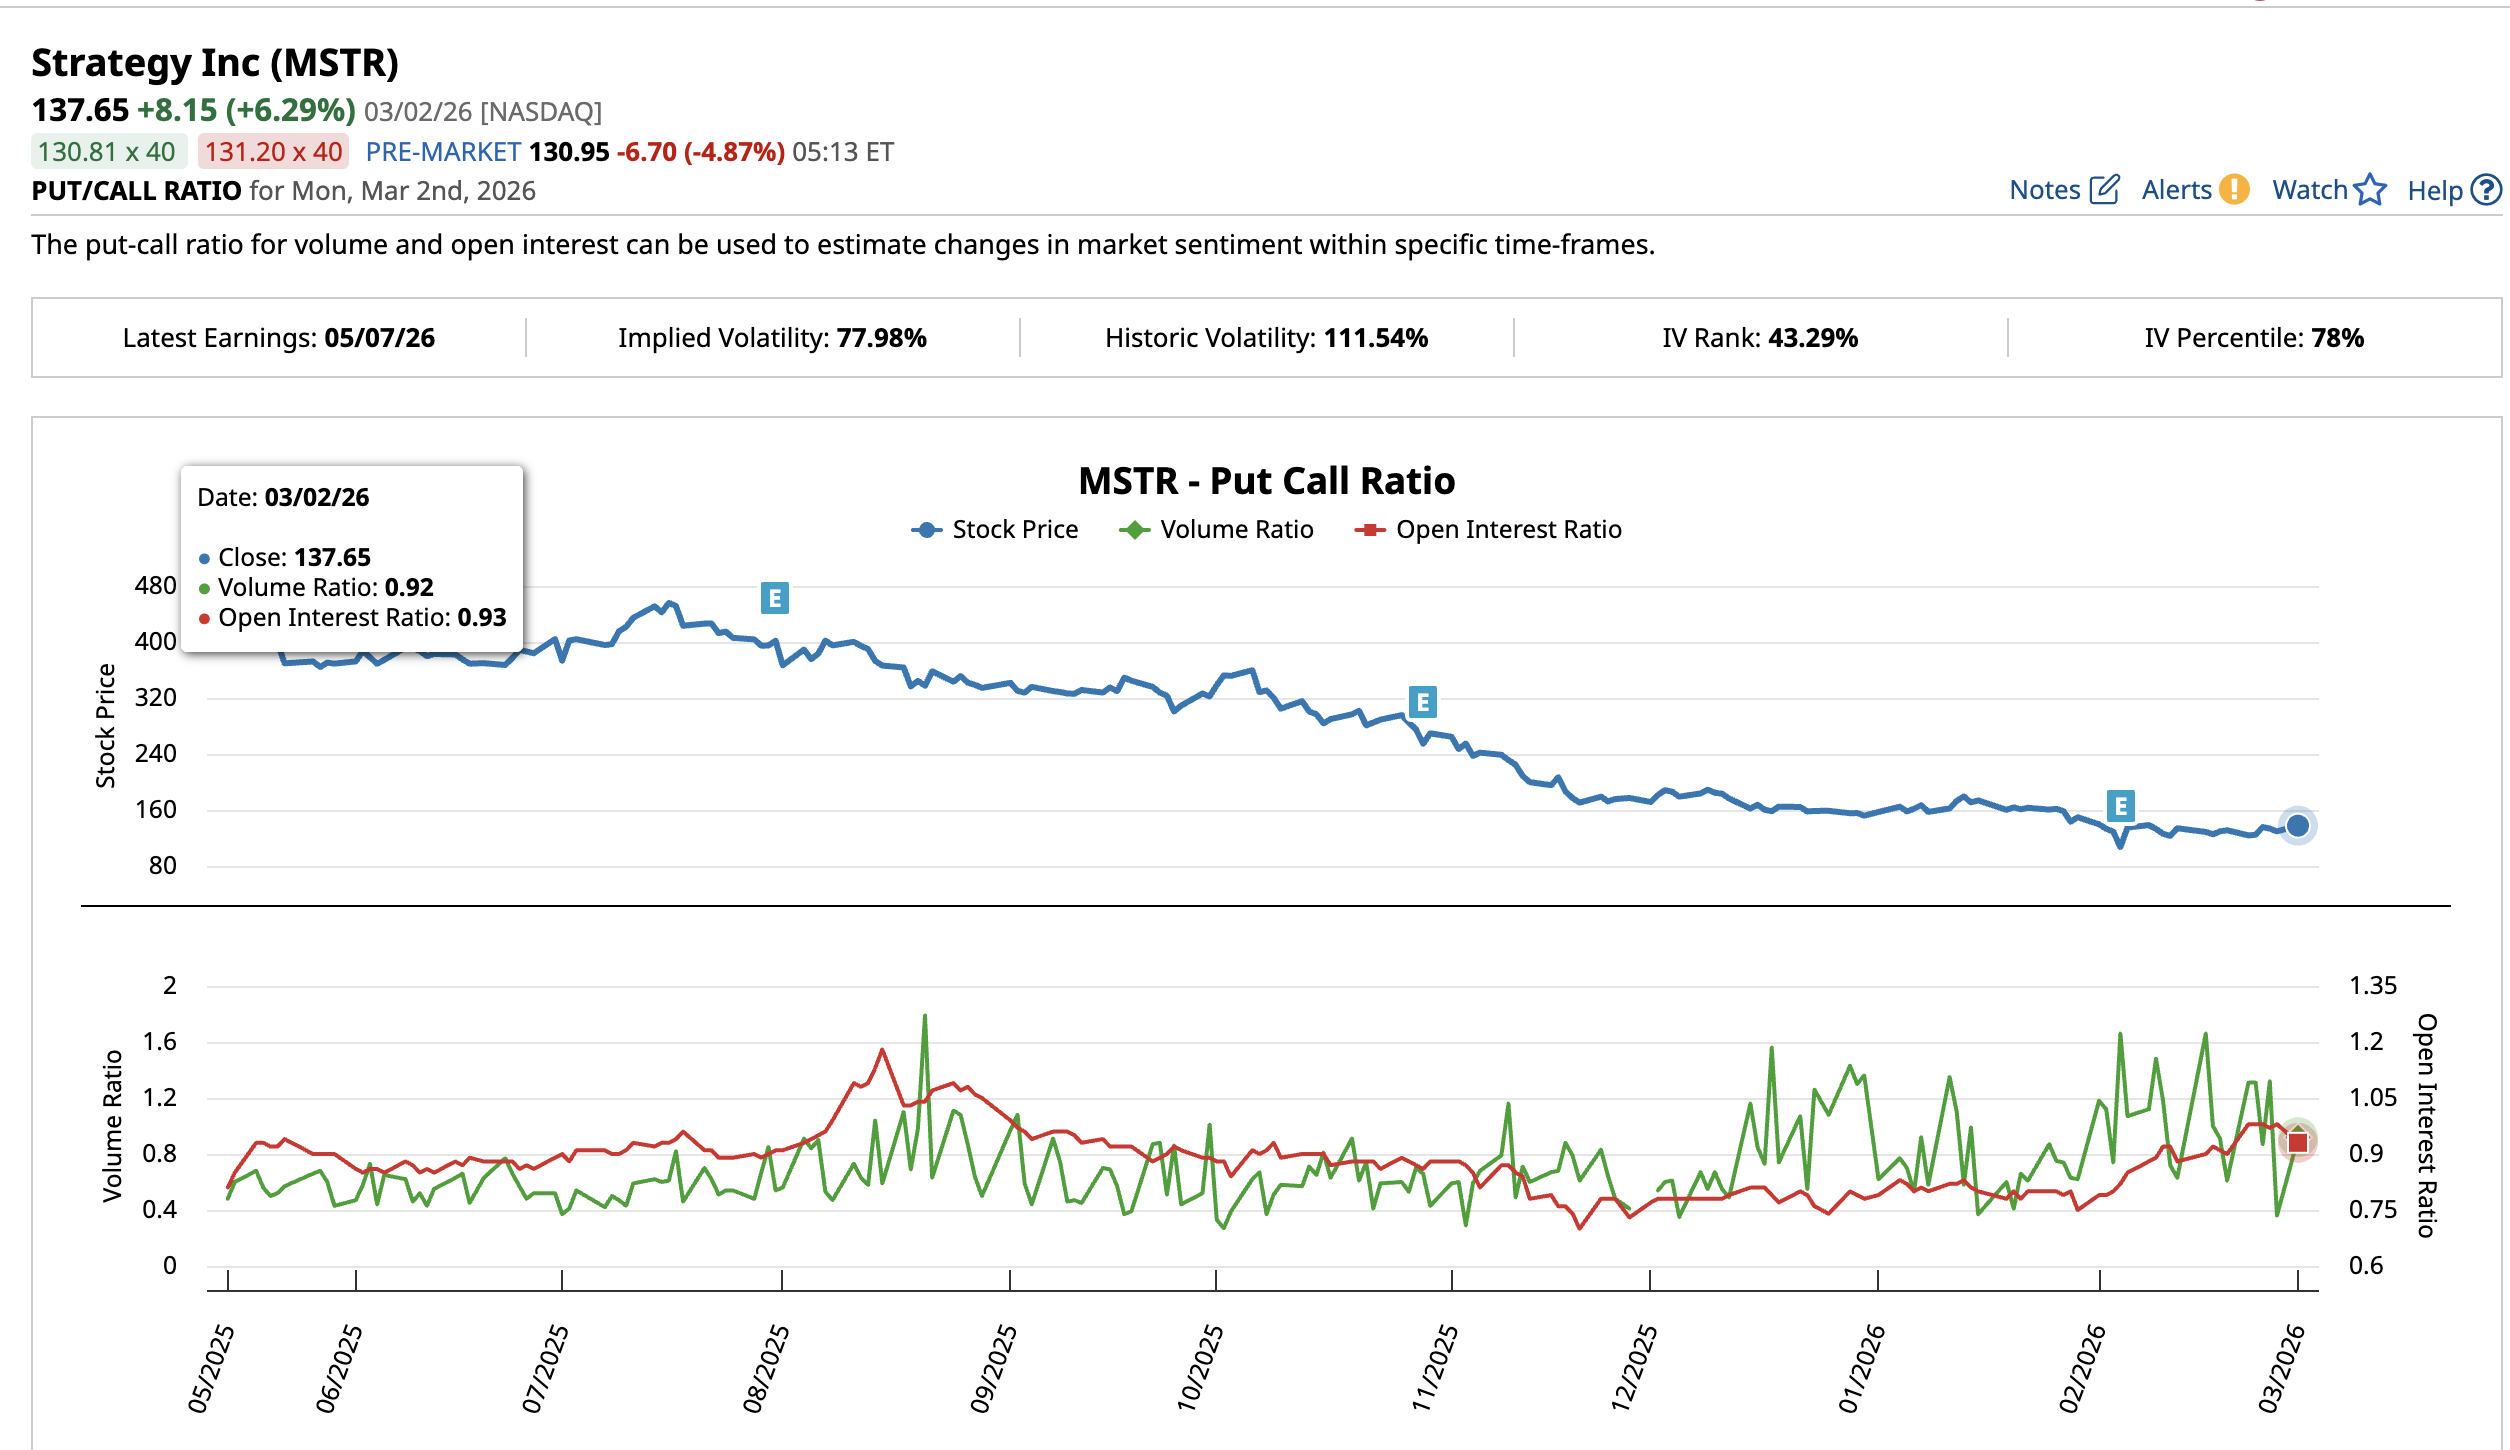
Options data tells a similar story. The put/call volume ratio at 0.92 and the open interest ratio at 0.93 are near neutral: roughly equal money flowing into bullish calls and bearish puts.
February’s panic has faded, but no strong conviction has replaced it. Implied volatility at 77.98% trails the 105.8% realized volatility we saw earlier, meaning the market expects calmer days ahead. Possibly if BTC keeps moving in a range.
Want more insights like this? Sign up for Editor Harsh Notariya’s Daily Crypto Newsletter here.
Yet, the actual MicroStrategy stock price action hasn’t cooperated. Traders are sitting on the sidelines, not making aggressive bets in either direction, which ties back to the same declining participation visible in traded volume and even CMF.
MicroStrategy Stock Price Forecast: $124 Decides Everything
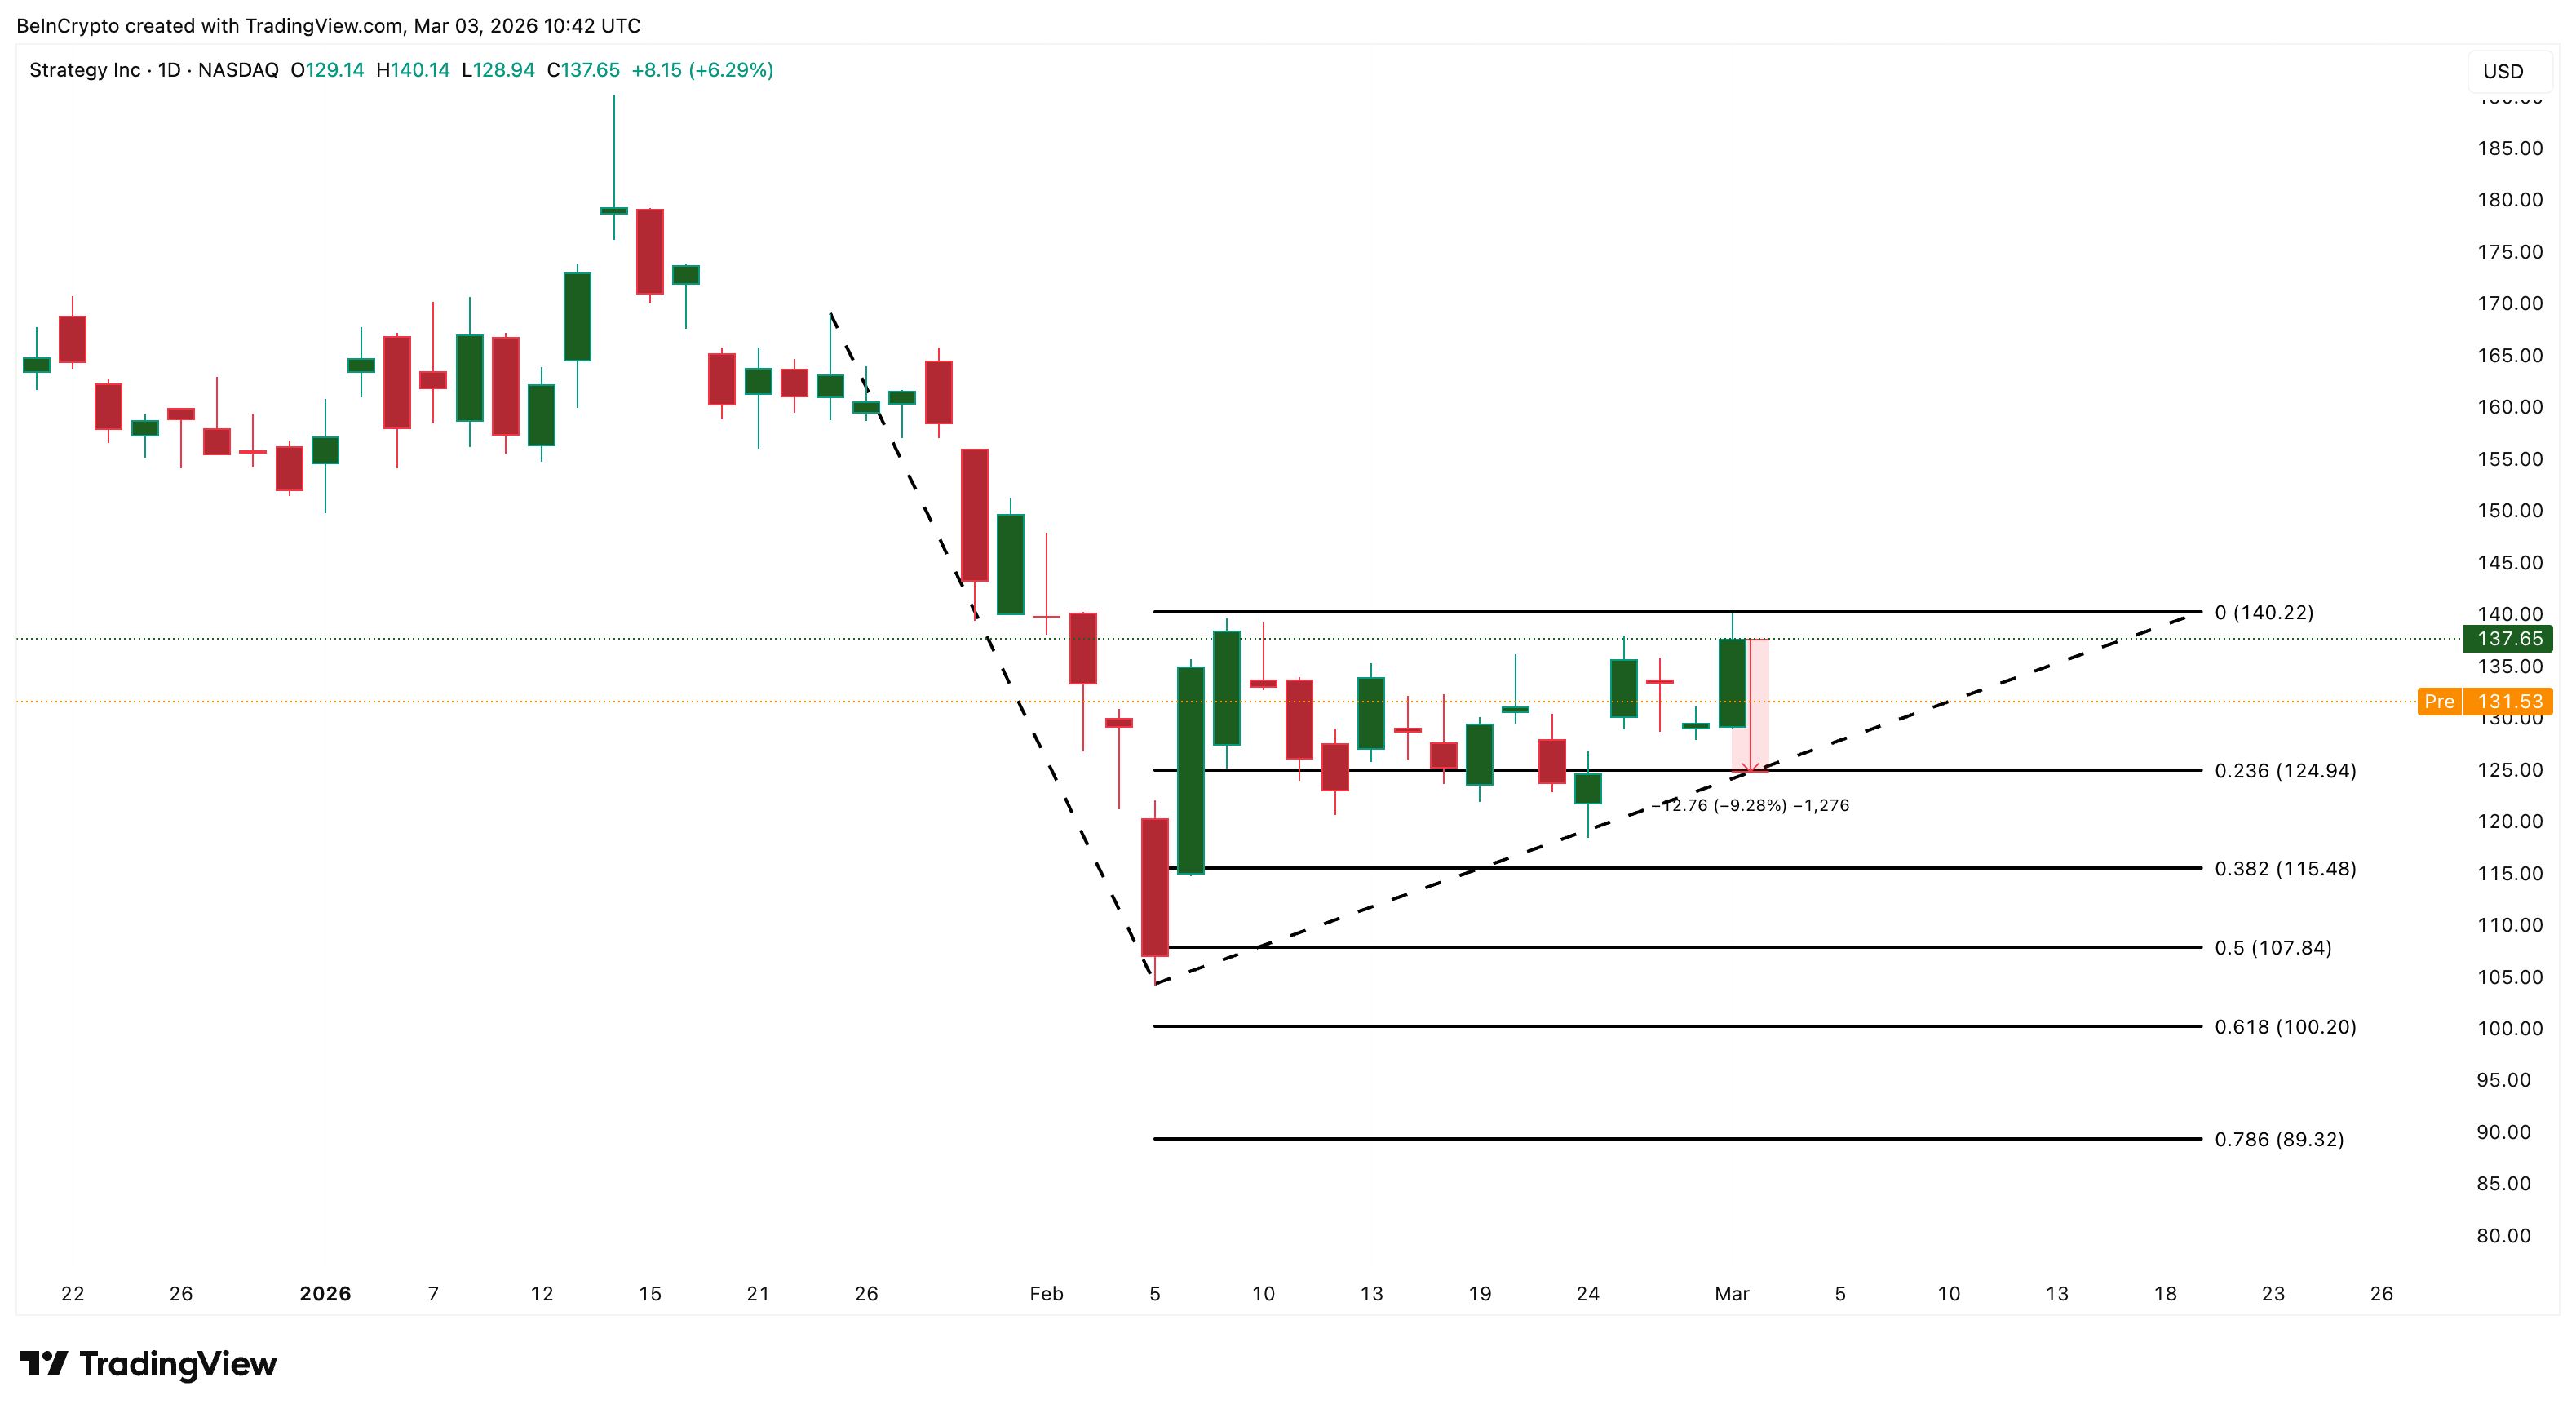
MSTR has been trapped between $140 and $124 for nearly four weeks, barring a few volatile moves under. Monday’s rally hit resistance at $140 and reversed. The floor at $124: the 0.236 Fibonacci level, is the key level to track now, which is nearly a 10% dip from Monday’s close.
The weight of evidence: hidden bearish RSI divergence, weakening CMF, neutral options positioning, macro pressure, and sharply reduced volume, tilts toward a downside move
A daily close below $124 opens the next level at $115. Below that, $107 and $100 come into focus.
Still, one upside catalyst remains. If Bitcoin reclaims and holds above $69,000, a decisive close above $140 on strong volume would invalidate the bearishness and trigger a sharp repositioning. Given MSTR’s amplified volatility, such a move could extend higher.
Until then, $124 is the line that matters for the MicroStrategy stock price. Hold it, and the range continues. Lose it, and the correction likely accelerates.
The post MicroStrategy Volatility Hits 106% as Volume Collapses—$124 Now in Focus appeared first on BeInCrypto.
Read moreLatest News