
MELANIA Trades at All-Time Lows as 30 Million Token Unlock Had Little Impact
MELANIA is trading at its all-time lows, down 70% in the last 30 days, reflecting extreme bearish sentiment. Despite a token unlock of roughly $39 million just a day ago, there was no significant impact on its price, highlighting the market’s lack of attention toward MELANIA, neither positive nor negative.
With its RSI currently at 38.5 and BBTrend at -13.1, the technical indicators show persistent bearish momentum and ongoing selling pressure. If the downtrend continues, MELANIA could drop below $1. If it manages to regain bullish momentum, it might test resistance at $1.39 and potentially rise to $1.61.
MELANIA RSI Is Currently Neutral and Below 50 For Almost a Week
MELANIA’s RSI is currently at 38.5 and has remained below 50 since February 14. This indicates persistent bearish momentum. An RSI below 50 suggests that selling pressure has been dominating the market, with bearish sentiment prevailing.
MELANIA trading at all-time lows further emphasizes the coin’s lack of buying interest and overall negative sentiment. This sustained low RSI level reflects ongoing weakness, suggesting that sellers continue to control the price action, keeping MELANIA under pressure.
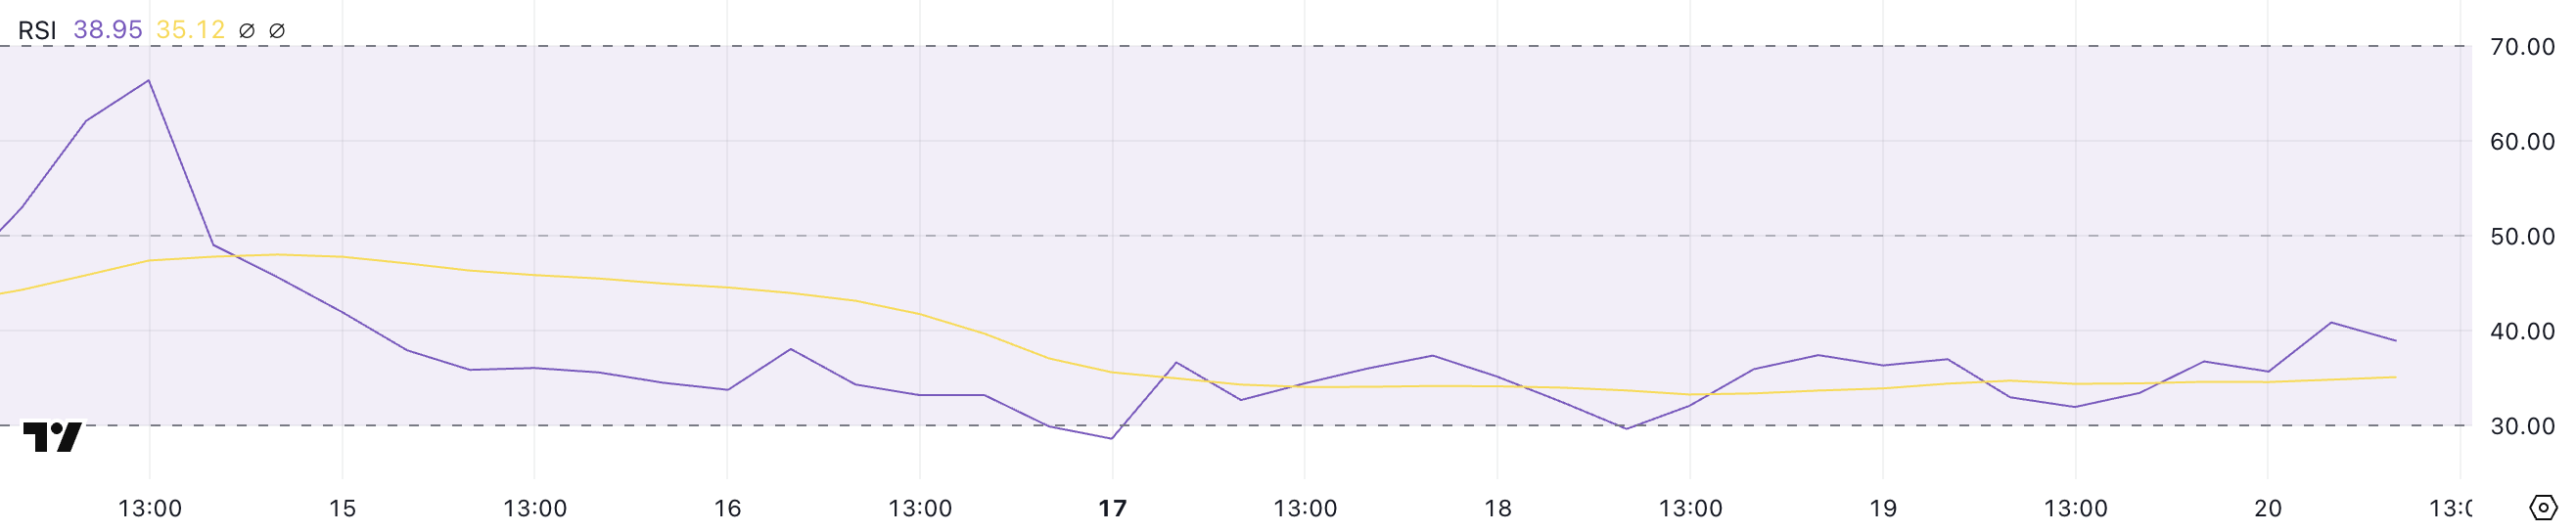
The Relative Strength Index (RSI) is a momentum oscillator that measures the speed and change of price movements. It ranges from 0 to 100. An RSI below 30 indicates oversold conditions, which could signal a buying opportunity, as the asset may be undervalued.
Conversely, an RSI above 70 suggests overbought conditions, signaling a potential price correction. With its RSI at 38.5, MELANIA is approaching oversold territory but not quite there yet. This level suggests that bearish sentiment is strong, but a potential reversal could occur if buying interest emerges.
However, given that it is trading at all-time lows, cautious optimism is advised, as the downtrend could continue if support levels fail to hold.
MELANIA BBTrend Is Below -12 For More Than a Day
MELANIA’s BBTrend is currently at -13.1, having remained negative for the past two days and below -12 for over a day. This indicates strong bearish momentum, as BBTrend values below zero suggest downward price pressure.
With the meme coin already at all-time lows, this negative BBTrend suggests a persistent bearish sentiment, signaling that further downside could be possible if selling pressure continues.
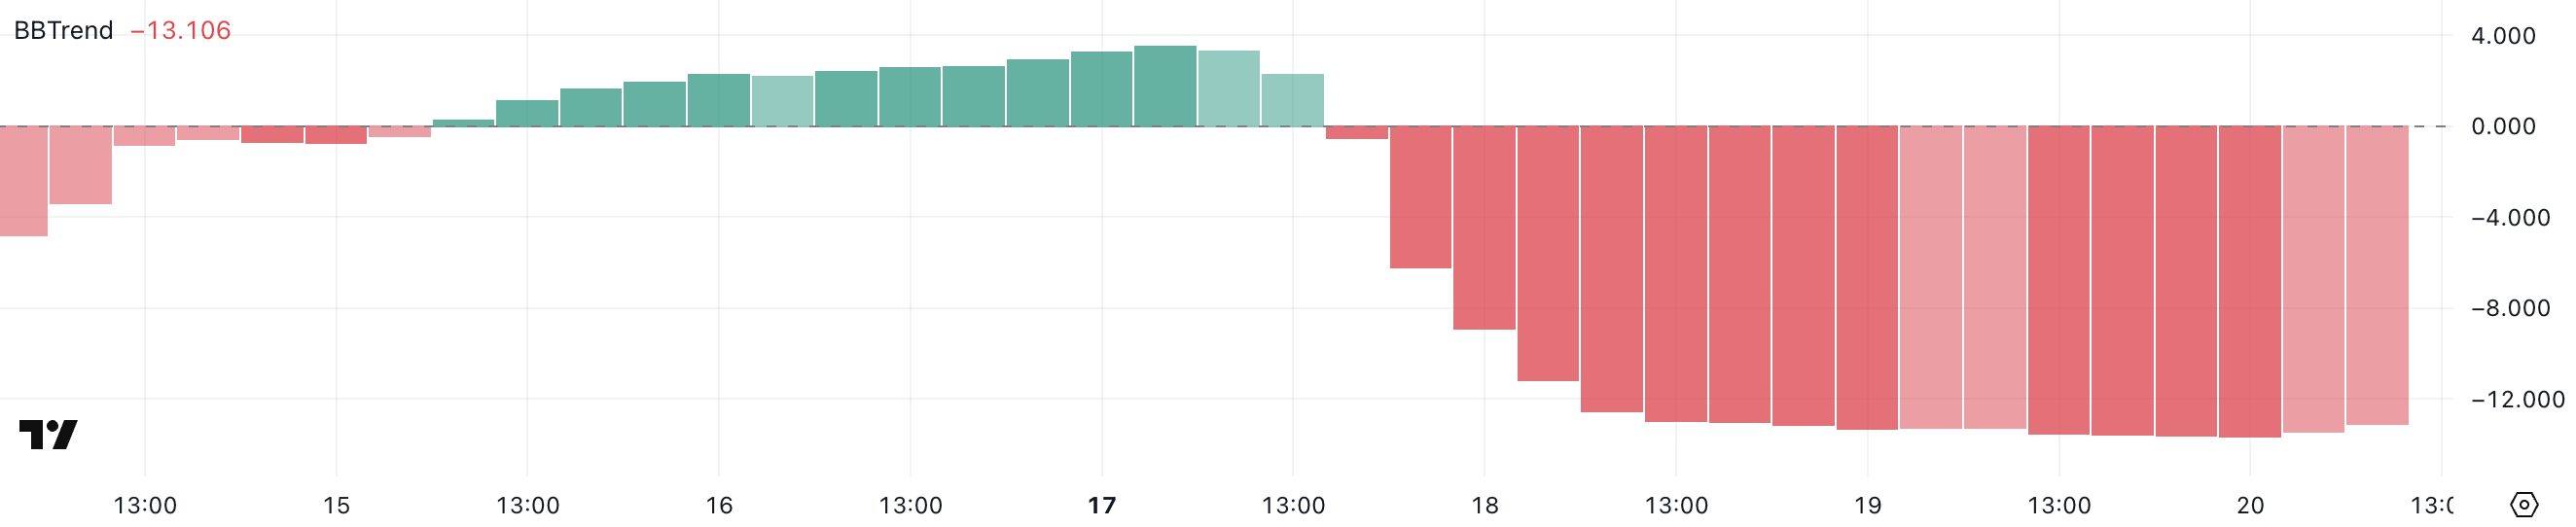
BBTrend, or Bollinger Band Trend, is a technical indicator derived from the Bollinger Bands. It measures the distance between the price and the middle Bollinger Band, providing insights into trend strength and direction.
Positive BBTrend values indicate upward momentum, while negative values suggest downward pressure. MELANIA’s current BBTrend of -13.1 reflects significant bearish strength, especially when compared to its highest value ever of 3.5.
This extremely negative reading suggests that selling pressure is at its peak, increasing the likelihood of continued price decline. However, if BBTrend starts to recover, it could indicate a potential reversal or stabilization in price, but caution is advised as bearish momentum remains strong.
MELANIA Could Drop Below $1 Soon
The MELANIA meme coin, with a market cap of $665 million, is currently down more than 90% from its all-time high. It is trading at its lowest levels ever, reflecting extreme bearish sentiment and a lack of buying interest.
This substantial decline has placed significant pressure on MELANIA, as investors remain cautious amid ongoing selling activity. The current downtrend suggests that market participants are still hesitant to buy. This is keeping the price under pressure and at risk of further declines.
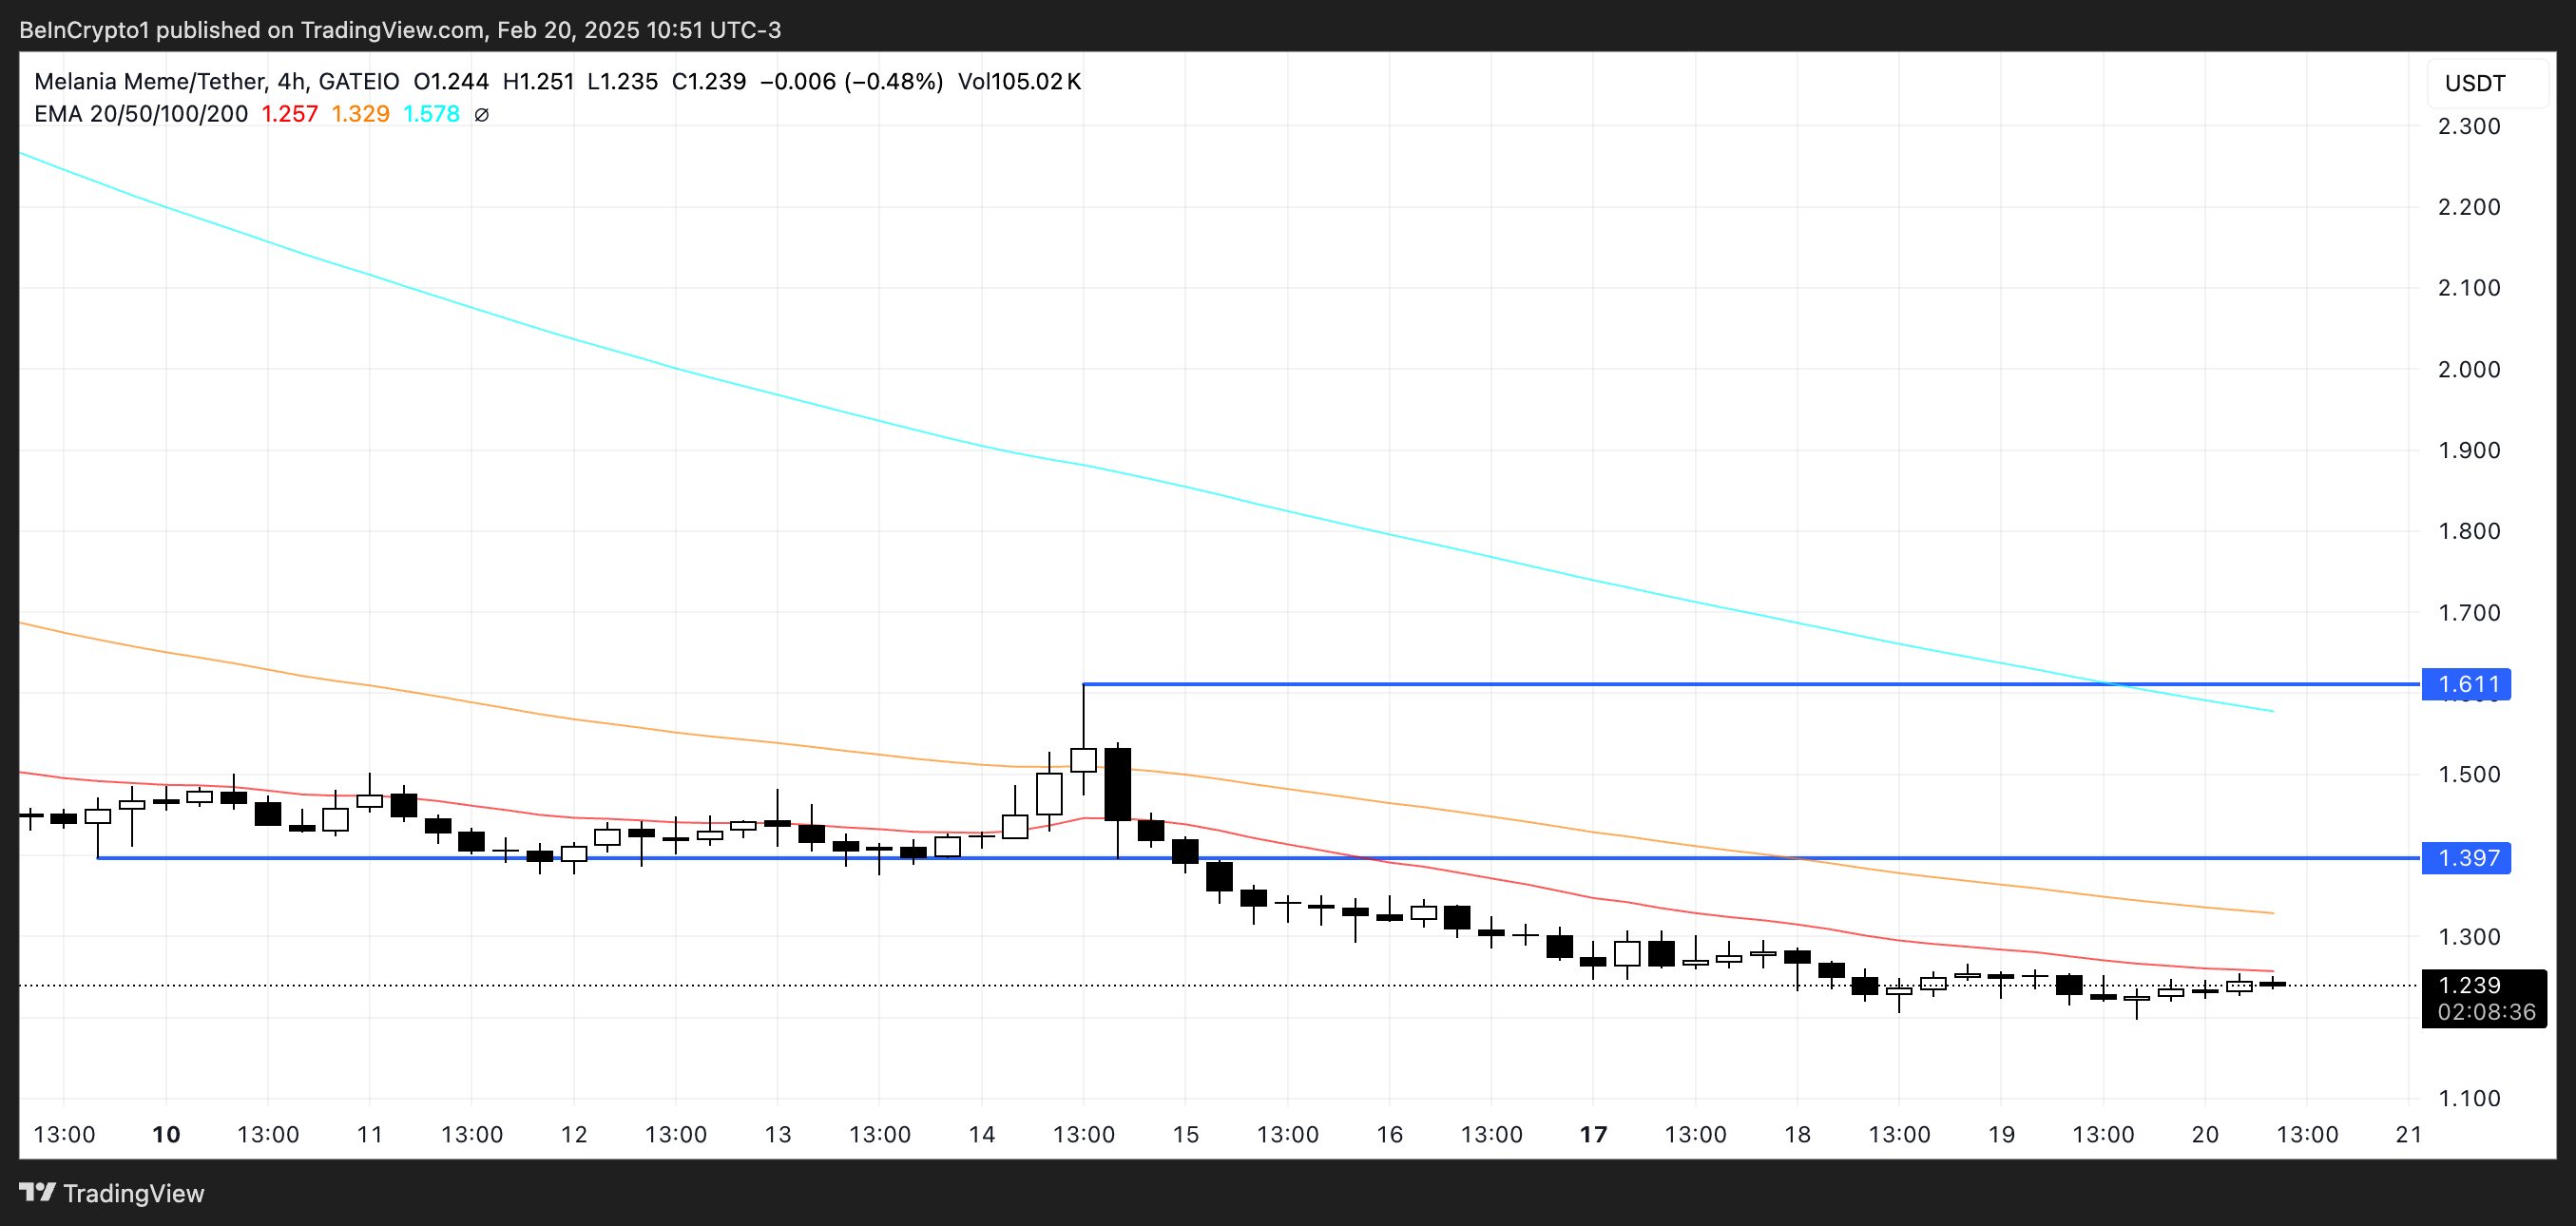
If this downtrend continues, the price of MELANIA could potentially fall below $1, further deepening its bearish trajectory.
However, if the asset can regain bullish momentum and establish an uptrend, it could test the resistance at $1.39. Breaking through this resistance would indicate renewed buying interest, possibly propelling MELANIA to $1.61.
Any movement outside of this range is looking less likely, based on the current technical indicators.
The post MELANIA Trades at All-Time Lows as 30 Million Token Unlock Had Little Impact appeared first on BeInCrypto.
Read moreLatest News