
Hyperliquid (HYPE) Struggles to Hold Trend as Price Approaches Critical Levels
Hyperliquid (HYPE) continues to generate strong revenue, collecting $42.53 million in fees over the last 30 days. However, despite the strong fundamentals, momentum indicators are weakening, with RSI and BBTrend both showing signs of cooling.
HYPE recently failed twice to break key resistance at $19.26, putting pressure on its short-term trend. Now, the price sits at a critical point where it could either collapse below support or mount a new rally toward $25.
Hyperliquid (HYPE) RSI Drops to 42 as Momentum Weakens
Hyperliquid’s Relative Strength Index (RSI) is cooling sharply, dropping to 42 from 60.93 yesterday.
This sudden decline signals that recent bullish momentum has weakened and traders are becoming more cautious.
After reaching overbought territory earlier in the week, HYPE approaches levels suggesting neutral to slightly oversold conditions.
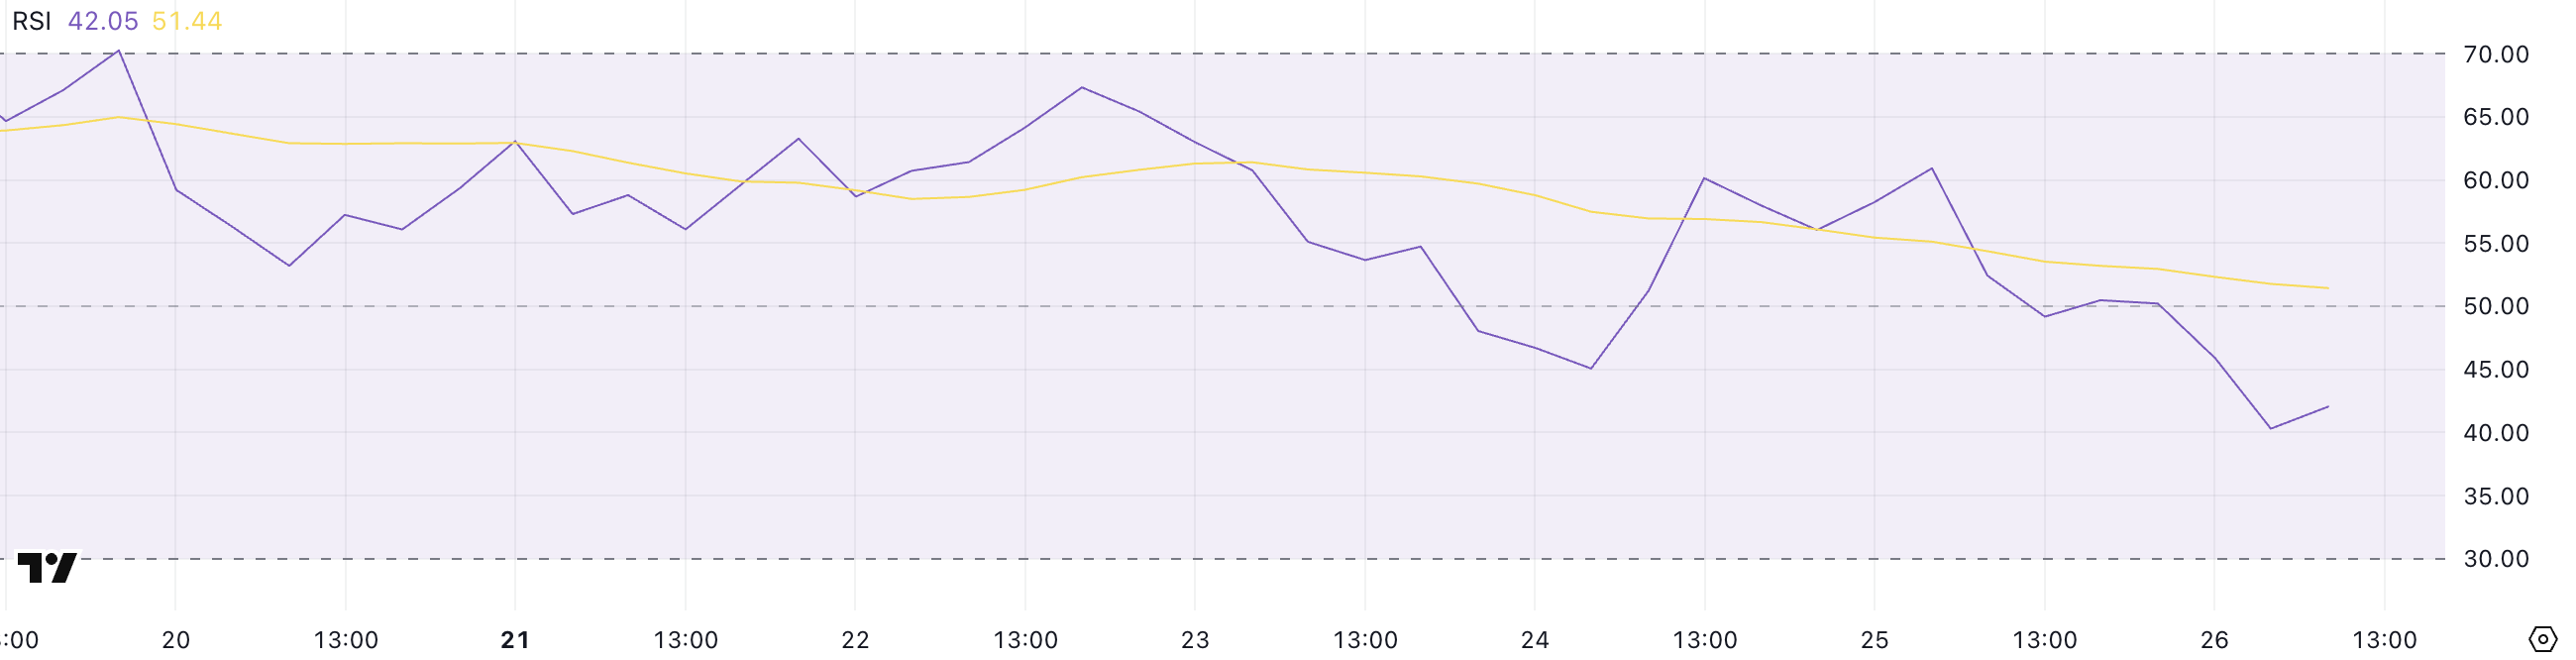
The RSI is a momentum indicator that measures the speed and magnitude of an asset’s recent price changes. It ranges from 0 to 100, with readings above 70 typically signaling overbought conditions, and readings below 30 suggesting oversold conditions.
With HYPE’s RSI now at 42, the token is sitting in a neutral zone but leaning toward weakness.
If the RSI continues to fall, it could open the door for more downside pressure, but if it stabilizes and bounces back, HYPE could regain strength before deeper losses set in.
Hyperliquid (HYPE) Could Enter Consolidation After BBTrend Drop
Hyperliquid is seeing a sharp drop in its BBTrend indicator, now at 2.63, down from 12.68 five days ago. This steep decline shows that the bullish momentum seen earlier has faded quickly.
BBTrend readings falling this sharply often reflect a major slowdown in trend strength, signaling that the price could be entering a consolidation phase or preparing for a deeper correction.
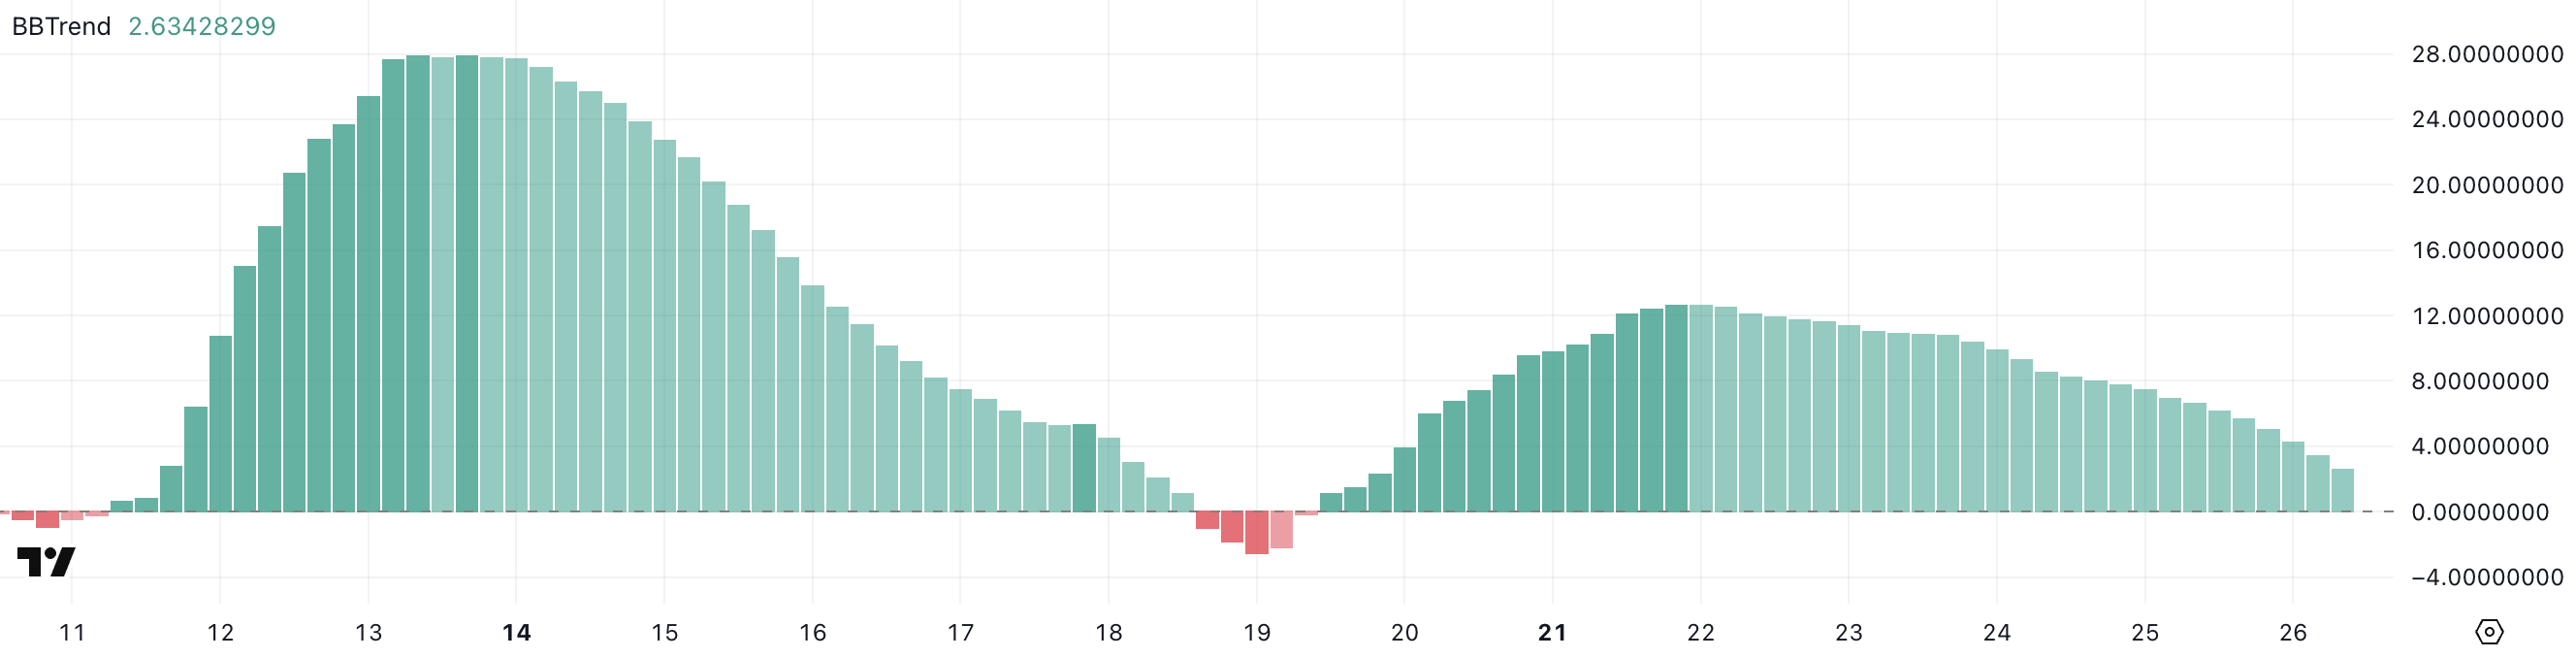
BBTrend, or Bollinger Band Trend, measures how strongly an asset is trending based on the width and expansion of its Bollinger Bands.
High BBTrend values, generally above 10, indicate strong trending conditions, while low values closer to 0 suggest a weak or sideways market. With HYPE’s BBTrend at 2.63, the current reading points to weak trend strength.
If the BBTrend continues to stay low, it could mean that HYPE’s price will consolidate or move sideways unless new momentum builds.
Will Hyperliquid (HYPE) Collapse Below $16 or Rally Past $25?
Hyperliquid has tested the $19.26 resistance level twice over the past few days but failed both times. As a result, its trend now appears to be weakening, with a possible death cross forming soon.
If the bearish momentum continues, HYPE could drop to test support at $16.82.
If selling pressure intensifies, a break below $14.66 could open the way toward deeper support levels at $12.42 and even $9.32.
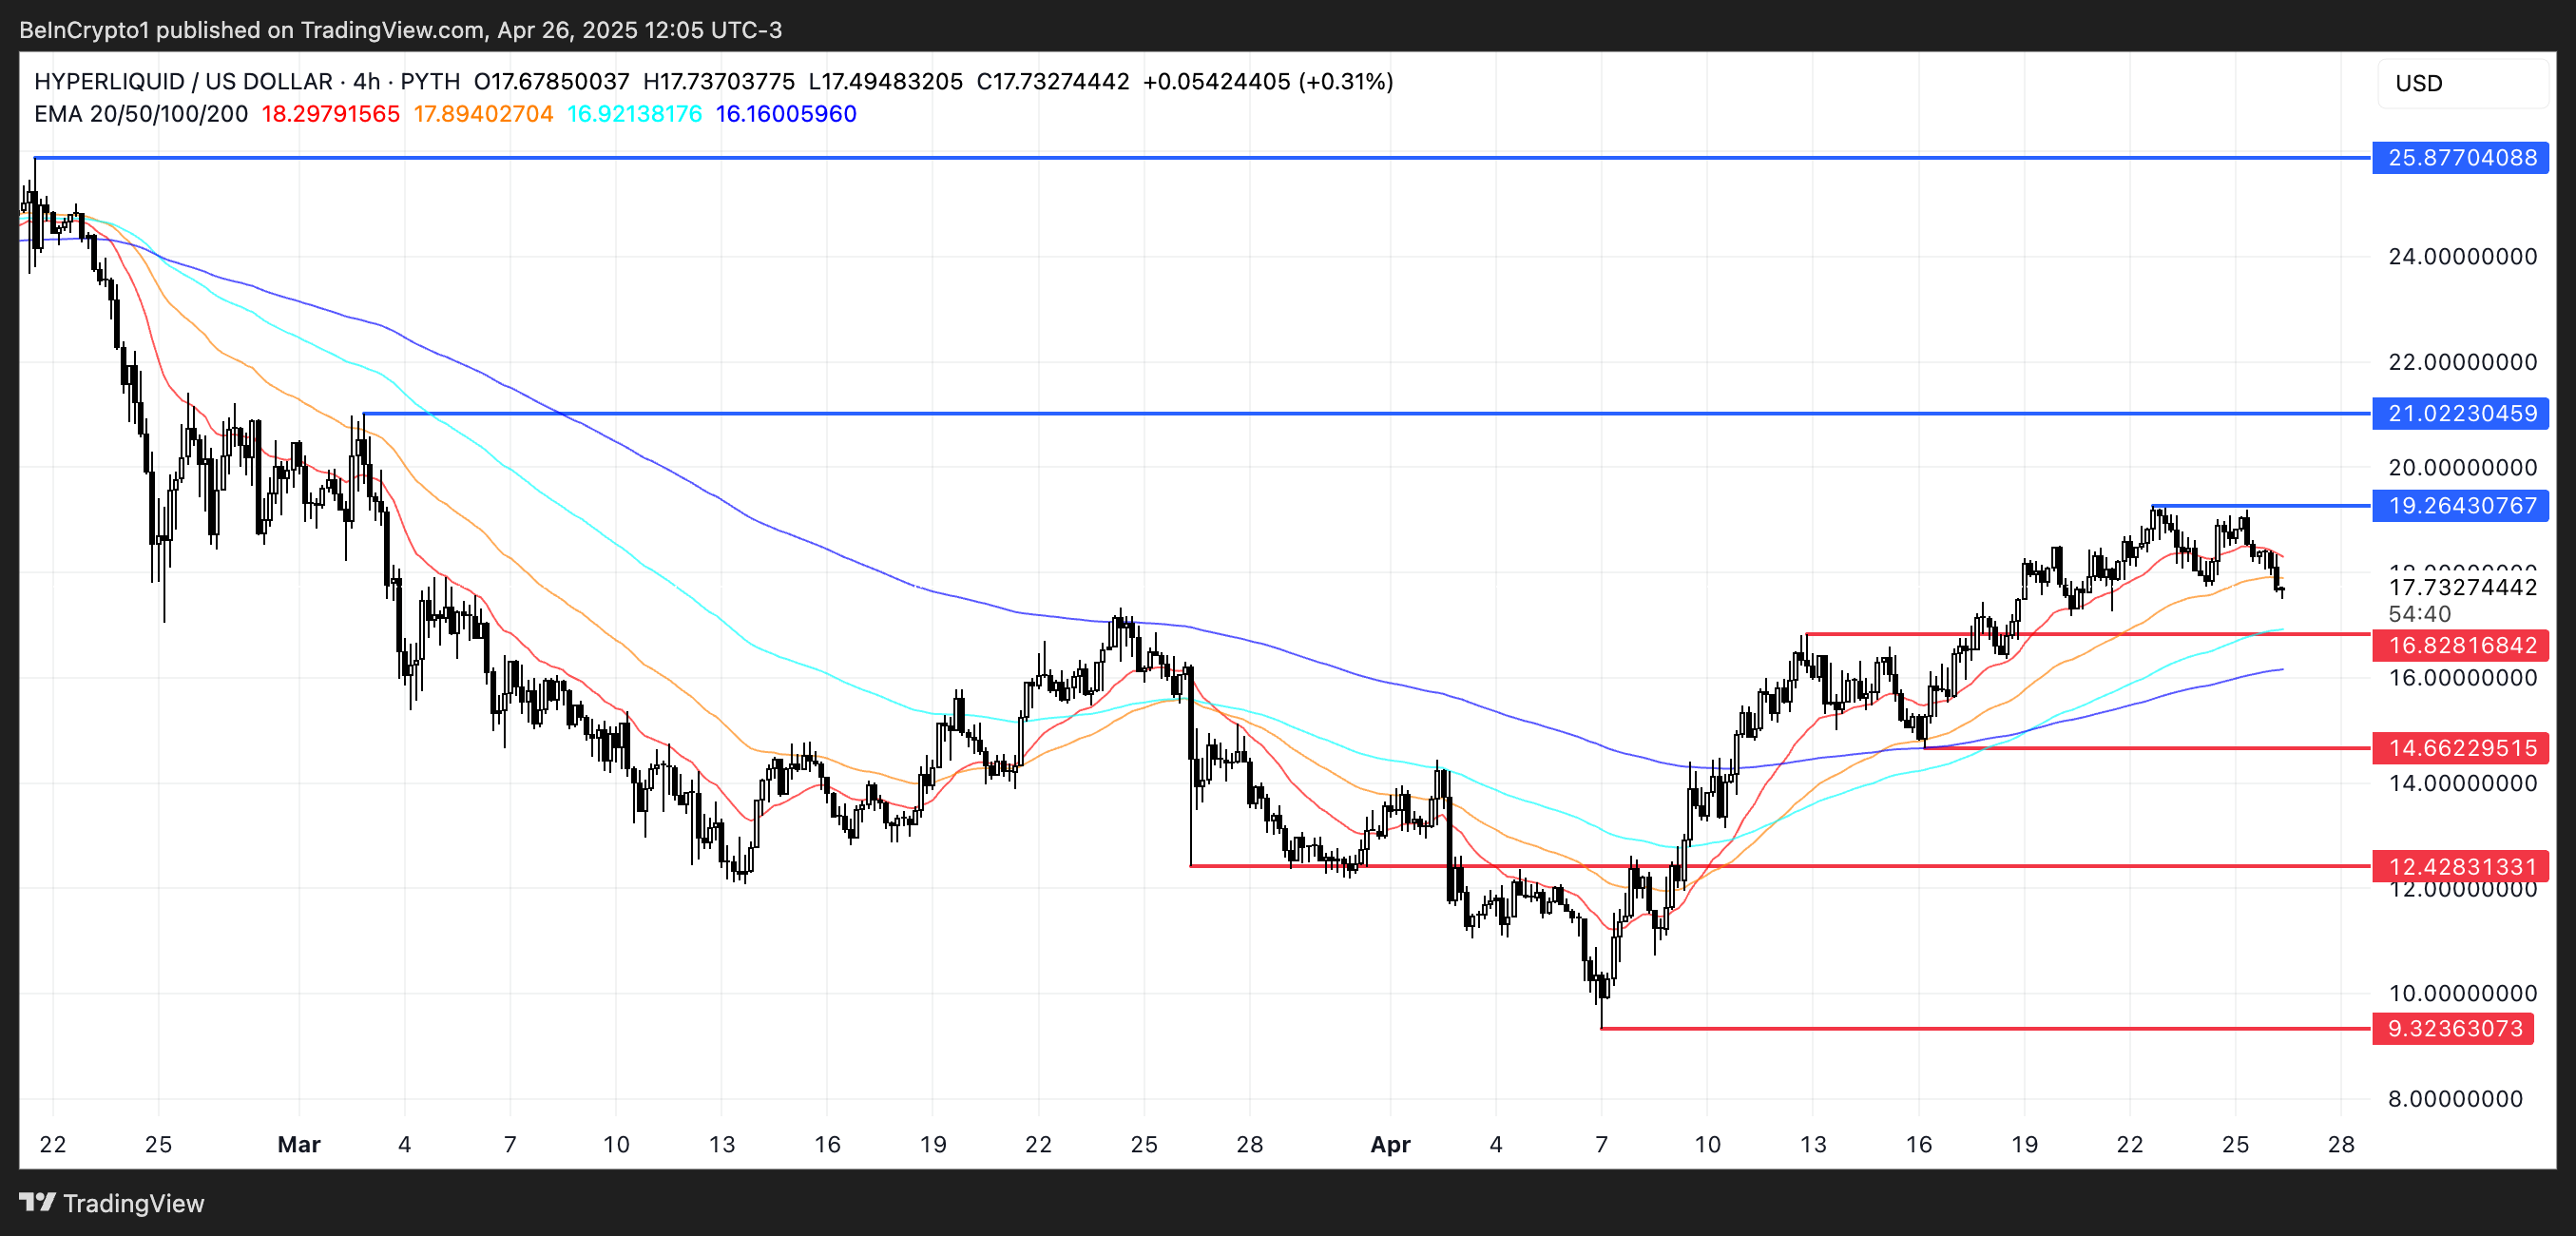
On the other hand, if bullish momentum returns, HYPE could mount another challenge at the $19.26 resistance.
A clear breakout above that level could open the path toward $21, and if momentum stays strong, HYPE could rally to $25.87.
This would mark its first time breaking above $25 since February 21.
The post Hyperliquid (HYPE) Struggles to Hold Trend as Price Approaches Critical Levels appeared first on BeInCrypto.
Read moreLatest News