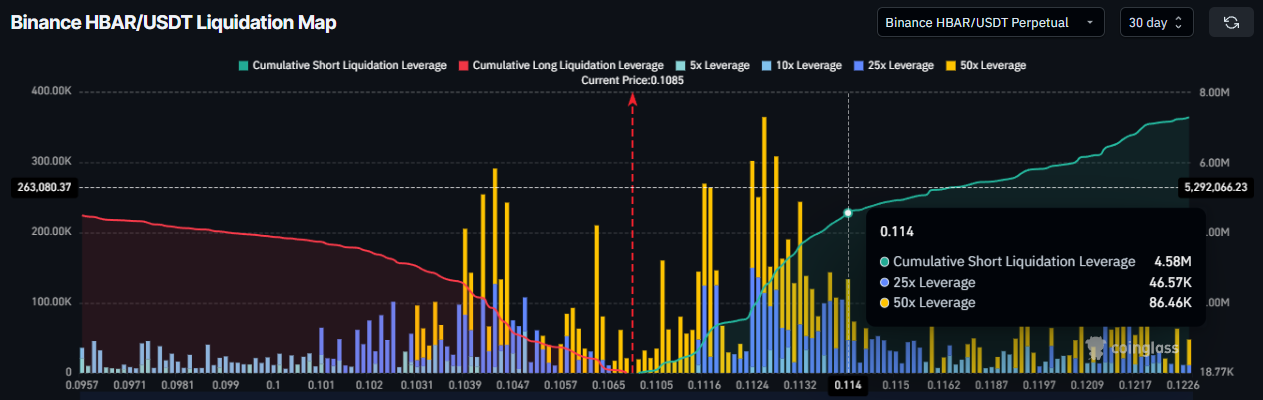
HBAR Bears Crowd the Trade: $4.5M Liquidation Risk Above $0.114
Hedera has struggled to regain momentum after a recent dip, leaving price action range-bound. HBAR attempted to stabilize, but recovery has stalled as holder behavior weighs on sentiment.
This hesitation could still benefit futures traders, as positioning suggests a sharp move may follow if key levels break.
Hedera Traders Have A Lot To Lose
Derivatives data show that short HBAR traders are exposed to meaningful risk if the price rises. The liquidation map indicates the largest cluster of short positions sits near the $0.114 level. A move to that price would trigger approximately $4.5 million in short liquidations, forcing rapid buybacks.
Current positioning remains skewed toward shorts rather than longs. This imbalance reflects negative sentiment across derivatives markets. Crowded short exposure increases the probability of volatility spikes, especially if the price pushes through resistance and forces traders to exit losing positions quickly.
Want more token insights like this? Sign up for Editor Harsh Notariya’s Daily Crypto Newsletter here.
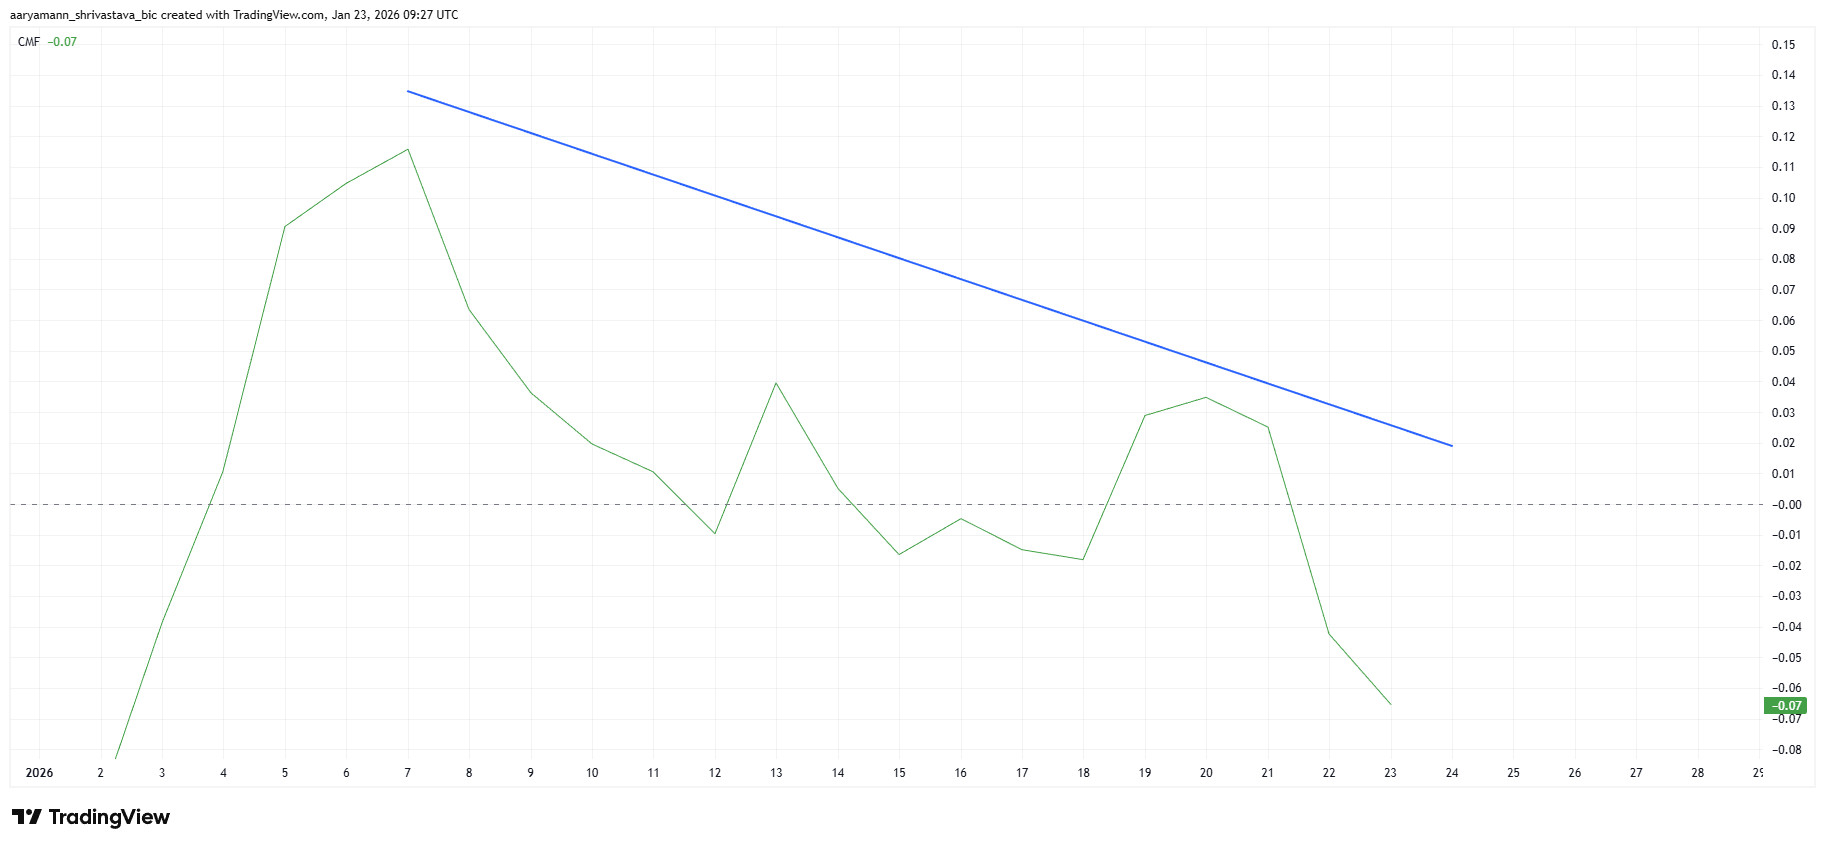
Macro indicators point to weakening investor participation. The Chaikin Money Flow has trended lower for nearly two weeks, forming consecutive lower lows. CMF tracks capital moving in and out of an asset using price and volume, making it a key demand signal.
The indicator slipping below the zero line confirms net outflows are dominating HBAR. This behavior suggests investors are reducing exposure rather than accumulating. Persistent outflows typically pressure the price and delay recovery attempts unless sentiment shifts decisively.
HBAR Price Needs To Secure This Critical Support
HBAR trades near $0.108 at the time of writing, hovering around the 23.6% Fibonacci retracement level. This level acts as a critical pivot for trend direction. Securing it as support would improve recovery odds and challenge the prevailing bearish bias.
If outflows continue, HBAR may fail to defend this zone. Under that scenario, price could slip back toward the 2026 low near $0.102. Such a move would extend the downtrend and reinforce bearish momentum across spot and derivatives markets.
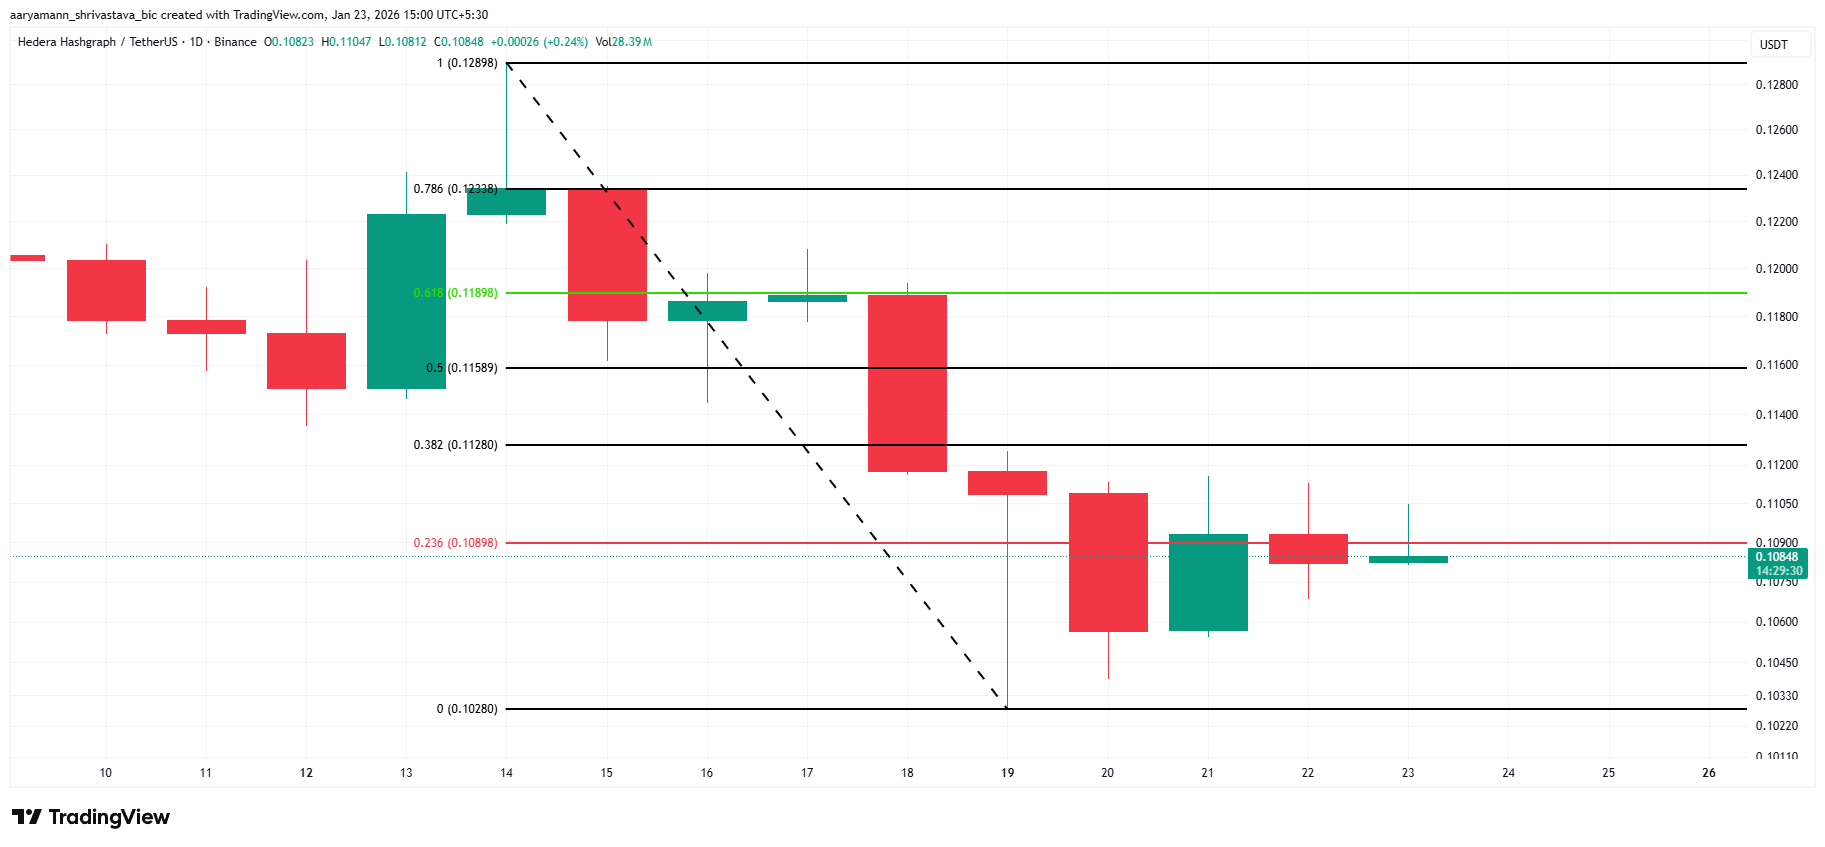
A bullish scenario requires a confirmed reclaim of the 23.6% Fibonacci level. Flipping it into support could lift HBAR toward the 38.2% Fib near $0.112. Clearing the $0.115 resistance would likely trigger short liquidations, invalidate the bearish thesis, and support a broader recovery.
The post HBAR Bears Crowd the Trade: $4.5M Liquidation Risk Above $0.114 appeared first on BeInCrypto.
Read moreLatest News