
GRASS Surges 30% In a Week With Indicators Suggesting Further Gains
GRASS has surged nearly 30% over the past week, with its market cap climbing back to $415 million and its price breaking above $1.70 for the first time since March 10.
This strong performance has been backed by bullish technical signals, including a consistently positive BBTrend and a rising ADX. However, with momentum indicators beginning to cool slightly, the next few days will be key in determining whether GRASS continues its rally or enters a period of consolidation.
GRASS BBTrend Remains Strong, But Is Slightly Declining
GRASS’s BBTrend is currently at 11.28, marking the fourth consecutive day in positive territory, after peaking at 14.85 two days ago.
The BBTrend (Bollinger Band Trend) indicator measures the strength of price trends by analyzing how far the price moves away from its moving average within Bollinger Bands.
Generally, values above zero indicate an uptrend, while values below zero suggest a downtrend. The higher the positive reading, the stronger the bullish momentum, whereas deep negative values reflect strong selling pressure.
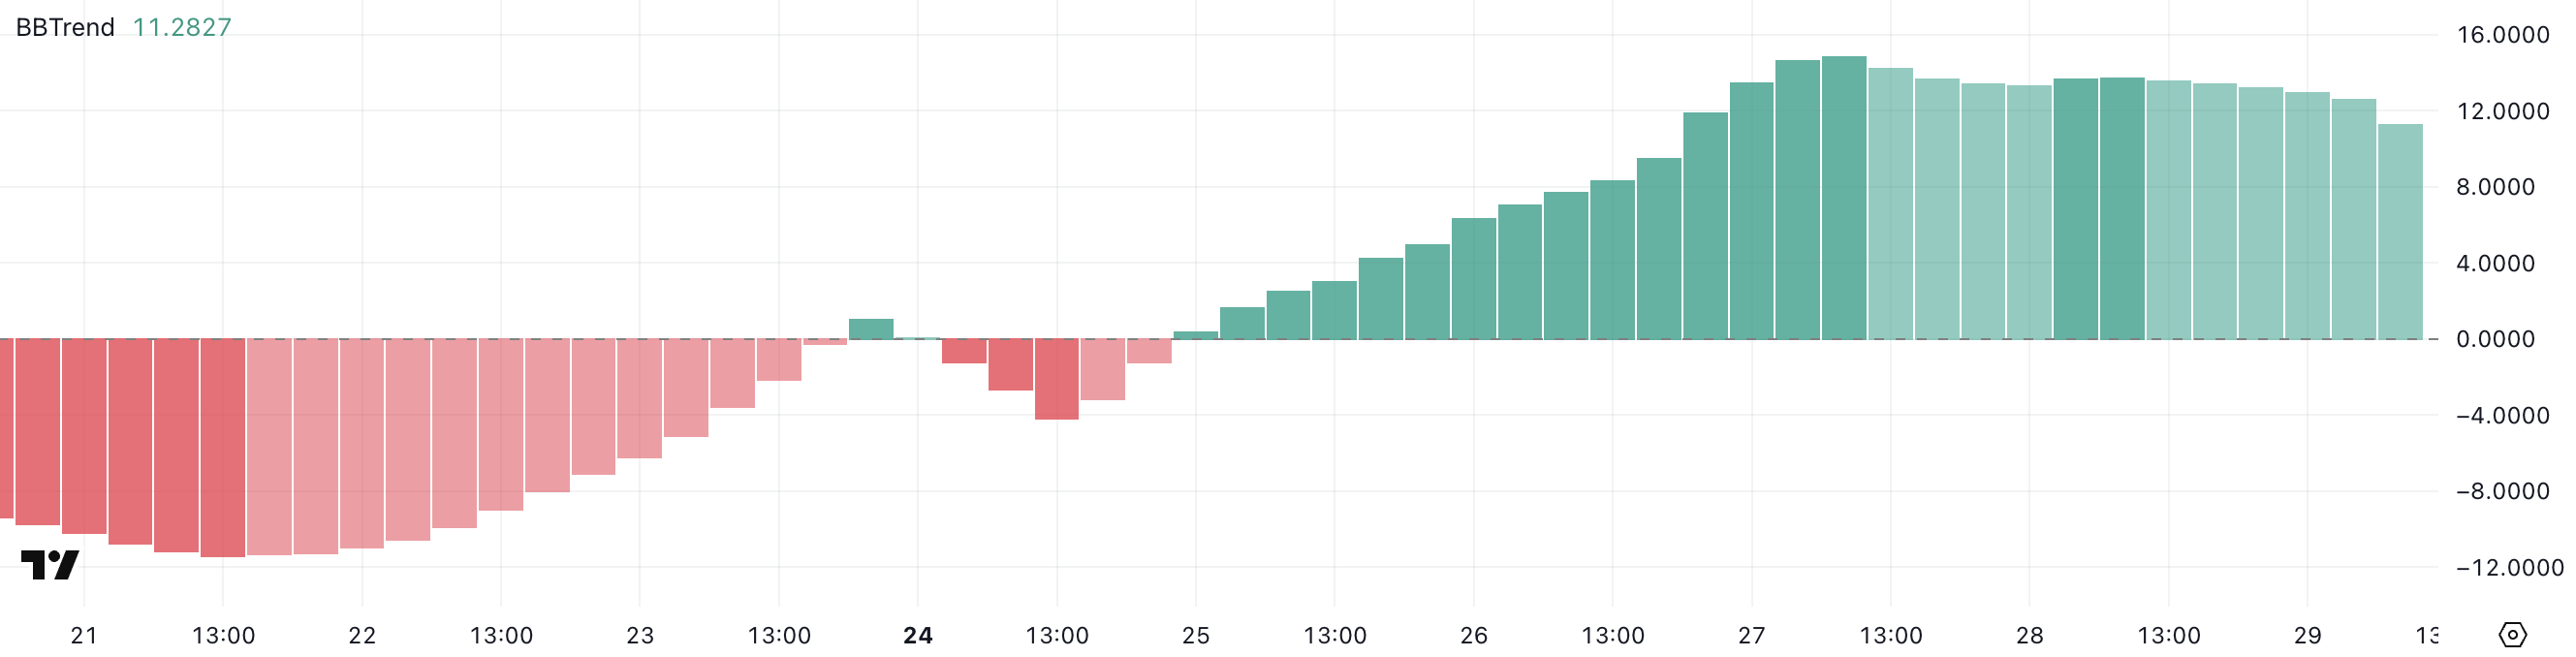
With GRASS maintaining a BBTrend of 11.28, the token is still in an active uptrend, although slightly cooler than its recent peak.
Sustained positive BBTrend readings typically signal that buyers remain in control and that upward momentum could continue.
However, the slight pullback from 14.85 might suggest that momentum is starting to ease. If the BBTrend begins to decline further, it could be an early sign of consolidation or a possible reversal.
For now, GRASS appears to be holding onto bullish momentum, but traders should monitor any shifts in trend strength closely.
GRASS ADX Shows The Uptrend Is Getting Stronger
GRASS is currently in an uptrend, with its Average Directional Index (ADX) rising to 30.31 from 26.49 just a day ago, indicating a strengthening trend momentum.
The ADX is a widely used technical indicator that measures the strength of a trend, regardless of its direction, on a scale from 0 to 100.
Values below 20 suggest a weak or non-existent trend, while readings above 25 indicate that a trend is gaining traction.
When the ADX moves above 30, it typically signals that the trend is becoming well-established and may continue in the same direction.
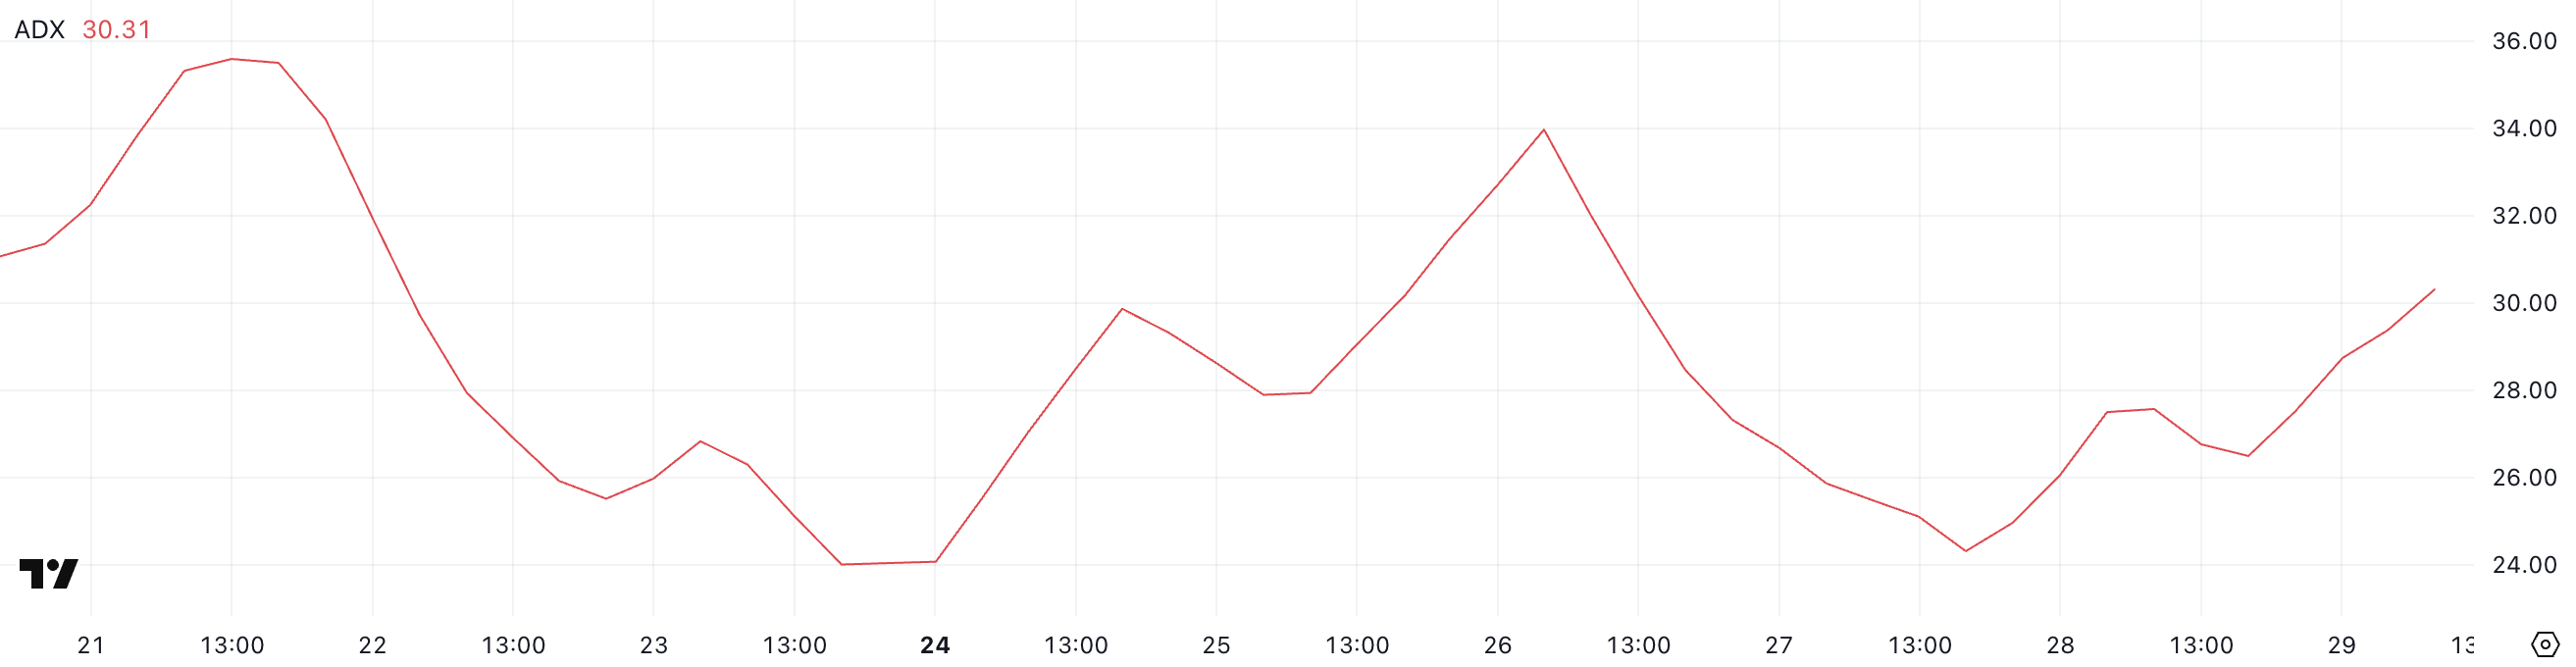
With GRASS’s ADX now above the 30 threshold, the current uptrend appears to be gaining strength. This suggests that bullish momentum is firming up and that price action may continue favoring the upside in the near term.
As long as the ADX remains elevated or continues climbing, the trend is likely to sustain, attracting more interest from momentum traders.
However, if the ADX begins to plateau or reverse, it could signal a potential slowdown or consolidation phase ahead.
GRASS Could Form A New Golden Cross Soon
GRASS’s Exponential Moving Average (EMA) lines are showing signs of a potential golden cross, a bullish signal that occurs when a short-term EMA crosses above a long-term one.
If this crossover confirms, it could mark the beginning of a sustained uptrend. GRASS is likely to test the immediate resistance at $1.85 as some artificial intelligence coins start to recover good momentum.
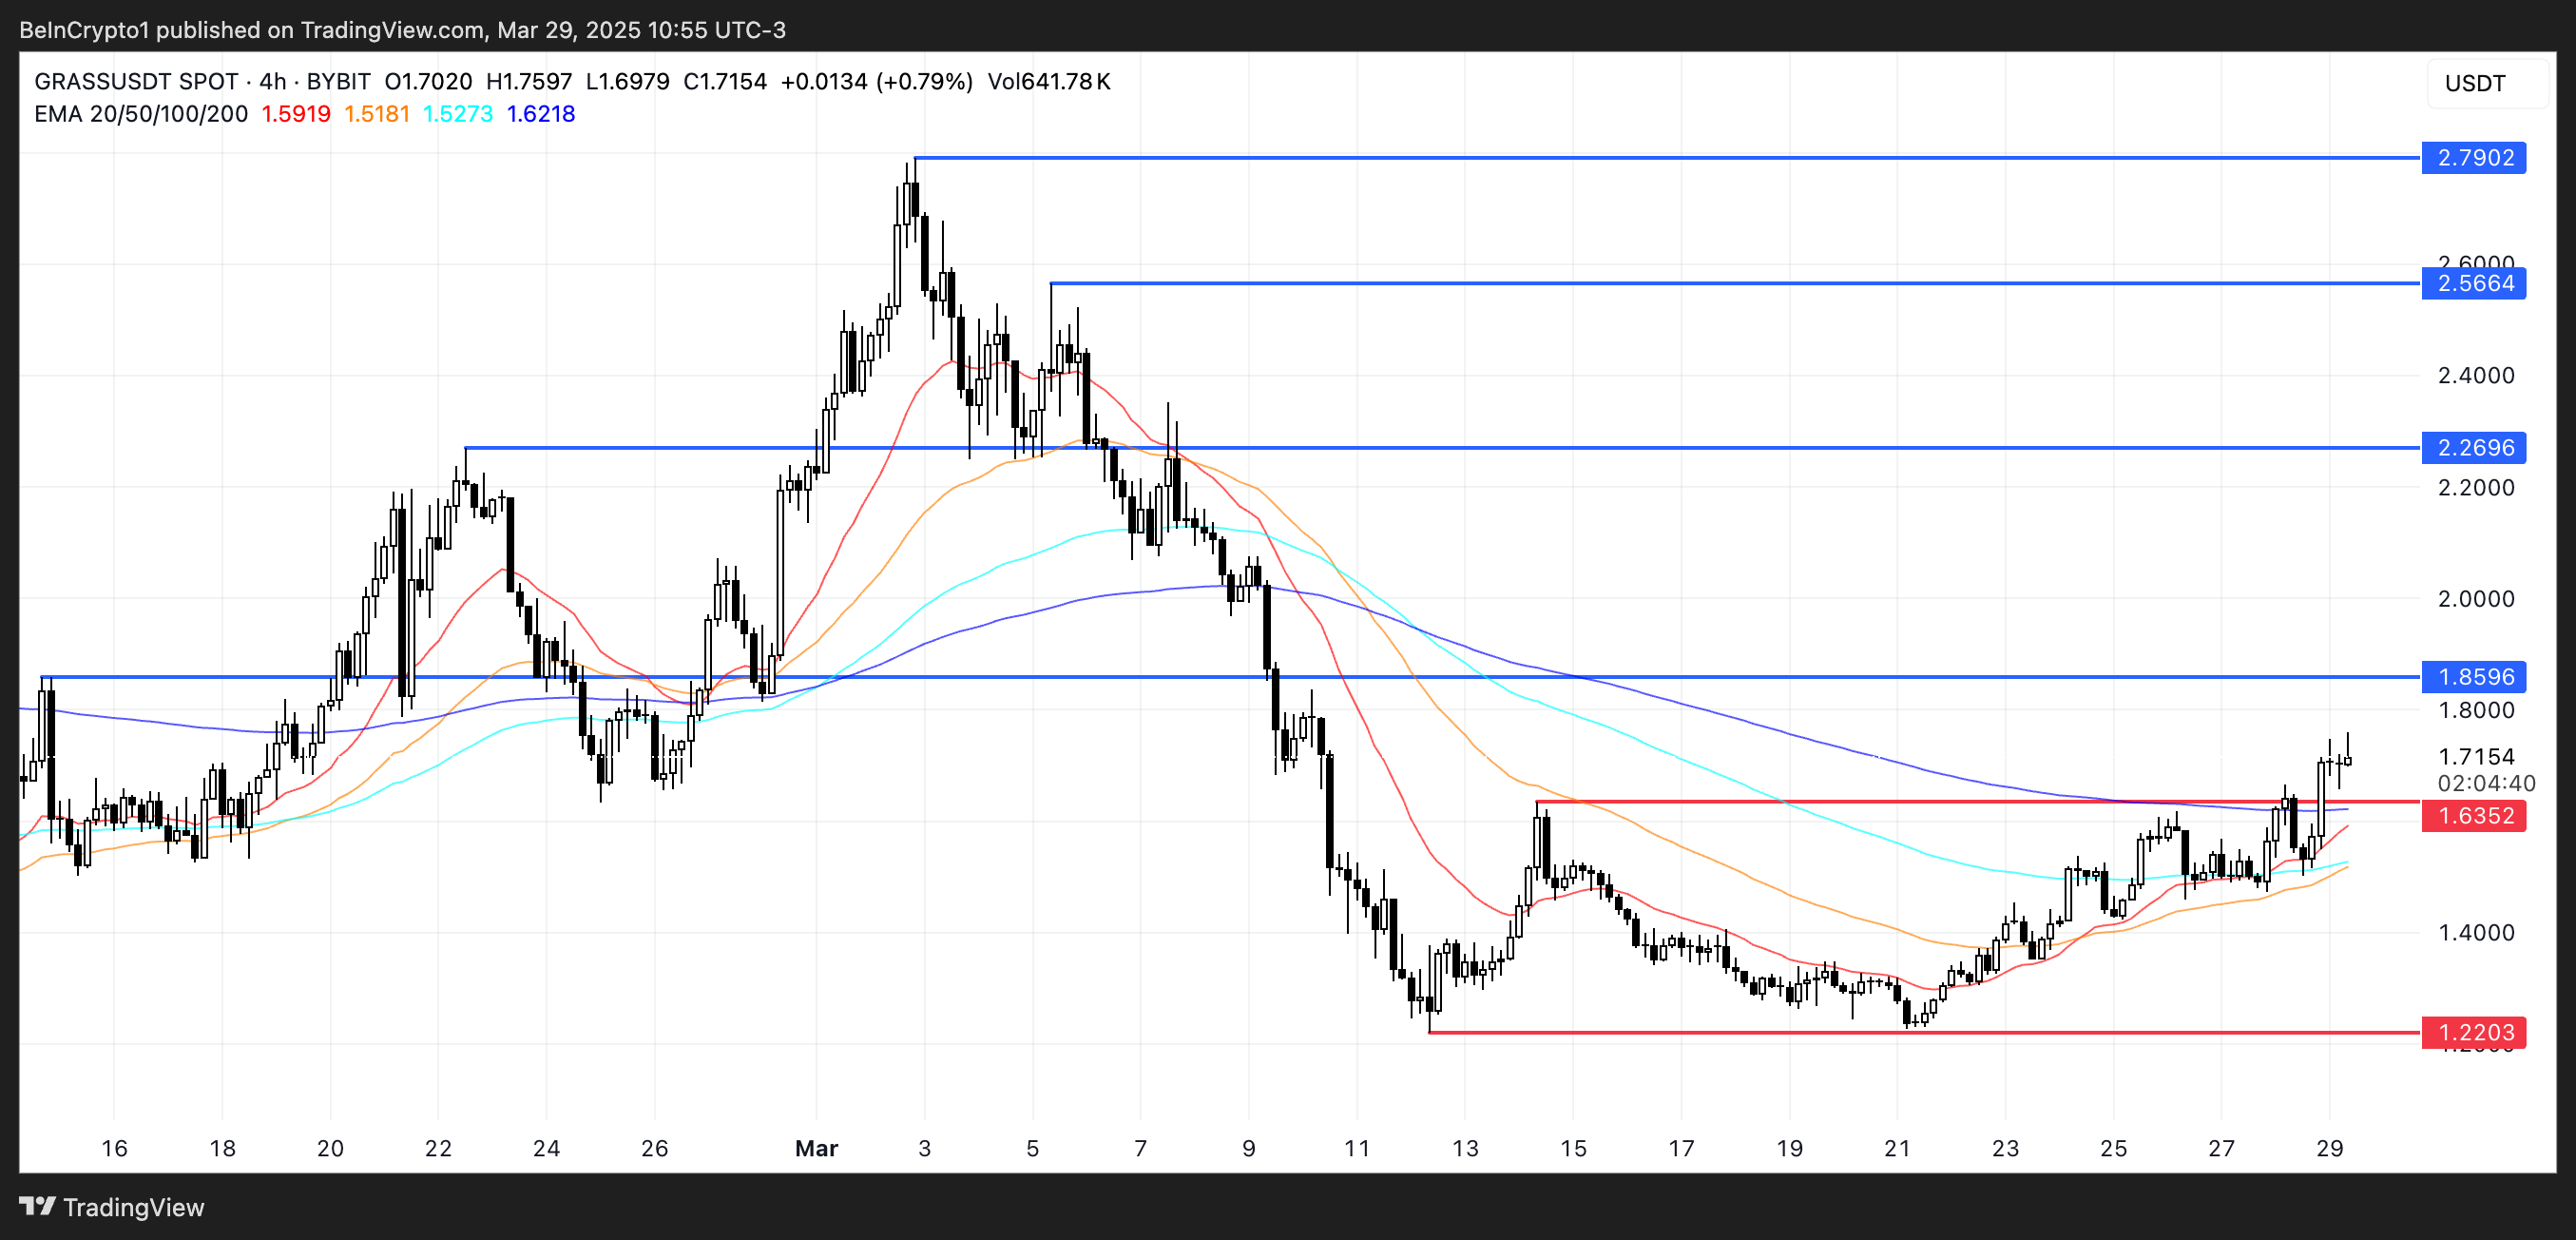
Should bullish momentum from the past week persist, the token may push even higher toward $2.26 and eventually $2.56 or $2.79, possibly solidifying its position as one of the best-performing altcoins in the market.
However, if the trend fails to hold and sentiment shifts bearish, GRASS could pull back to retest the support at $1.63.
A break below this level might open the door to a deeper correction, potentially driving the price down to $1.22.
The post GRASS Surges 30% In a Week With Indicators Suggesting Further Gains appeared first on BeInCrypto.
Read moreLatest News