
Ethereum (ETH) Bounces After 90% Selling Pressure Collapse — Bigger Move Coming?
Ethereum is already showing early signs of recovery. Since a recent low near $1,840, Ethereum has climbed nearly 4%, signaling that buyers are beginning to step back in. This rebound is not happening randomly. The bounce setup has been quietly building for weeks.
Several underlying signals now point to a shift. Selling pressure has collapsed sharply. Derivatives traders have turned aggressively bearish without adding new positions. At the same time, long-term holders have started buying again after weeks of selling. Together, these forces suggest the current Ethereum bounce could extend further.
Ethereum Bounce Setup Emerges As Bullish Divergence Builds
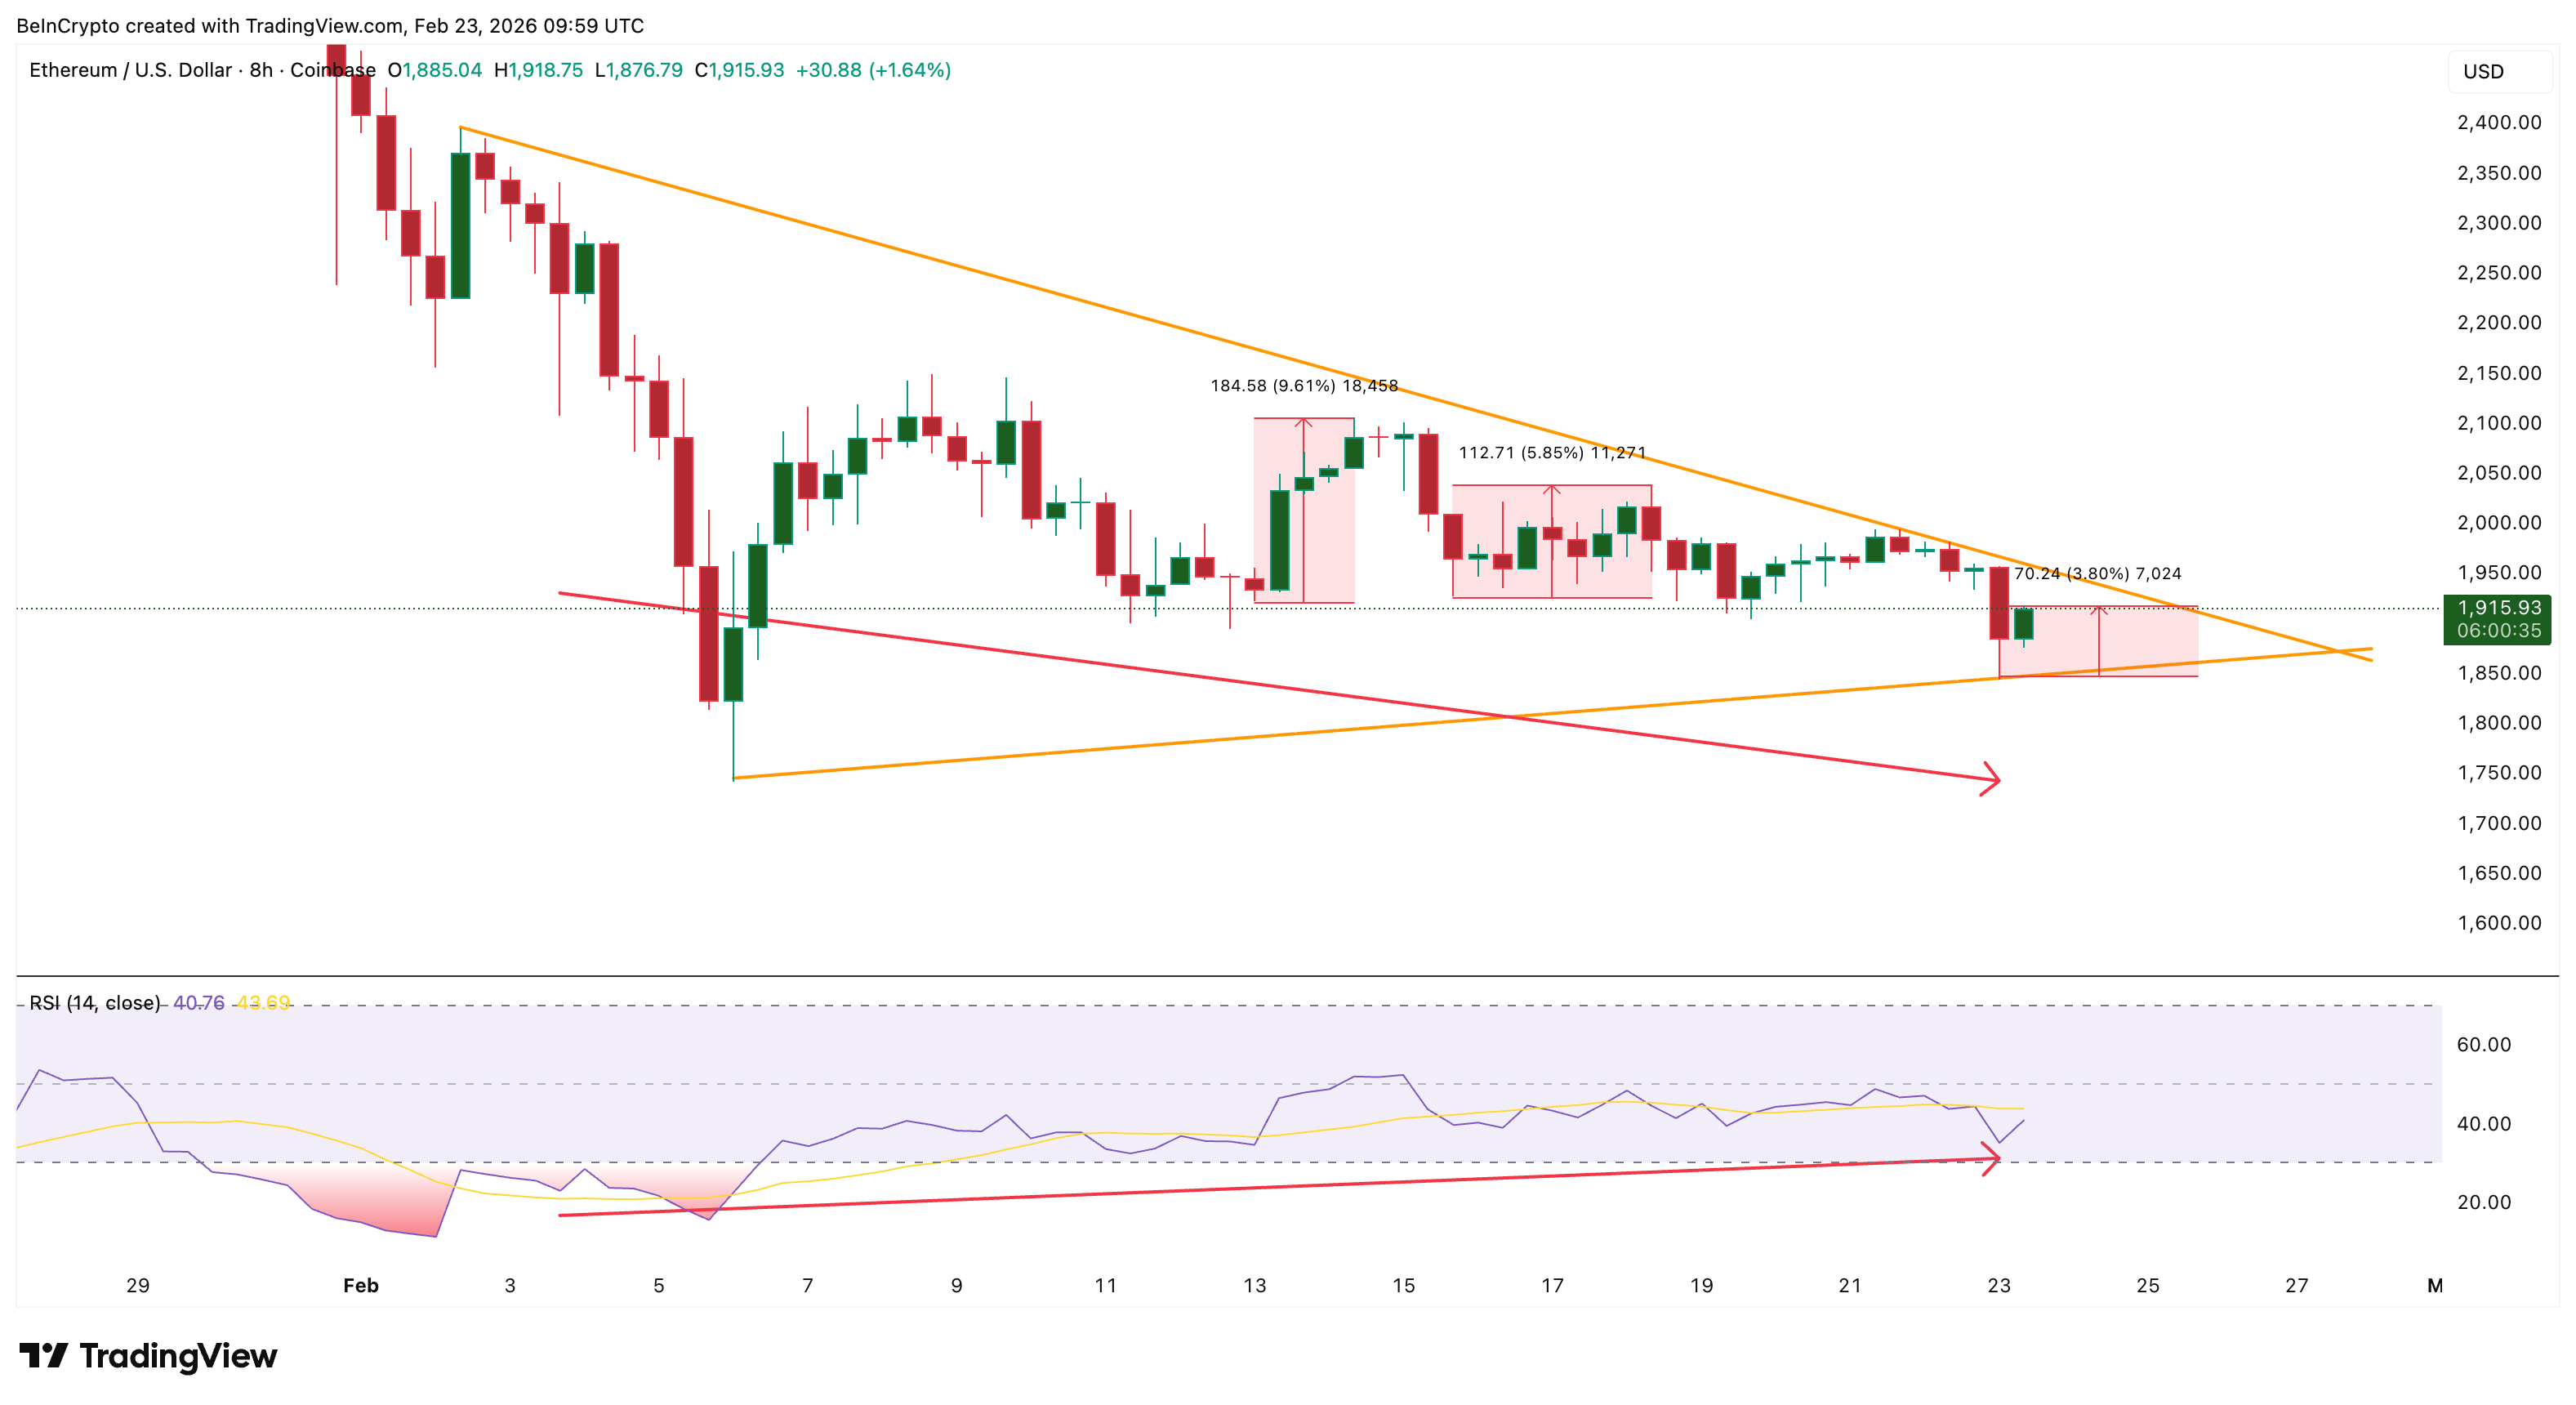
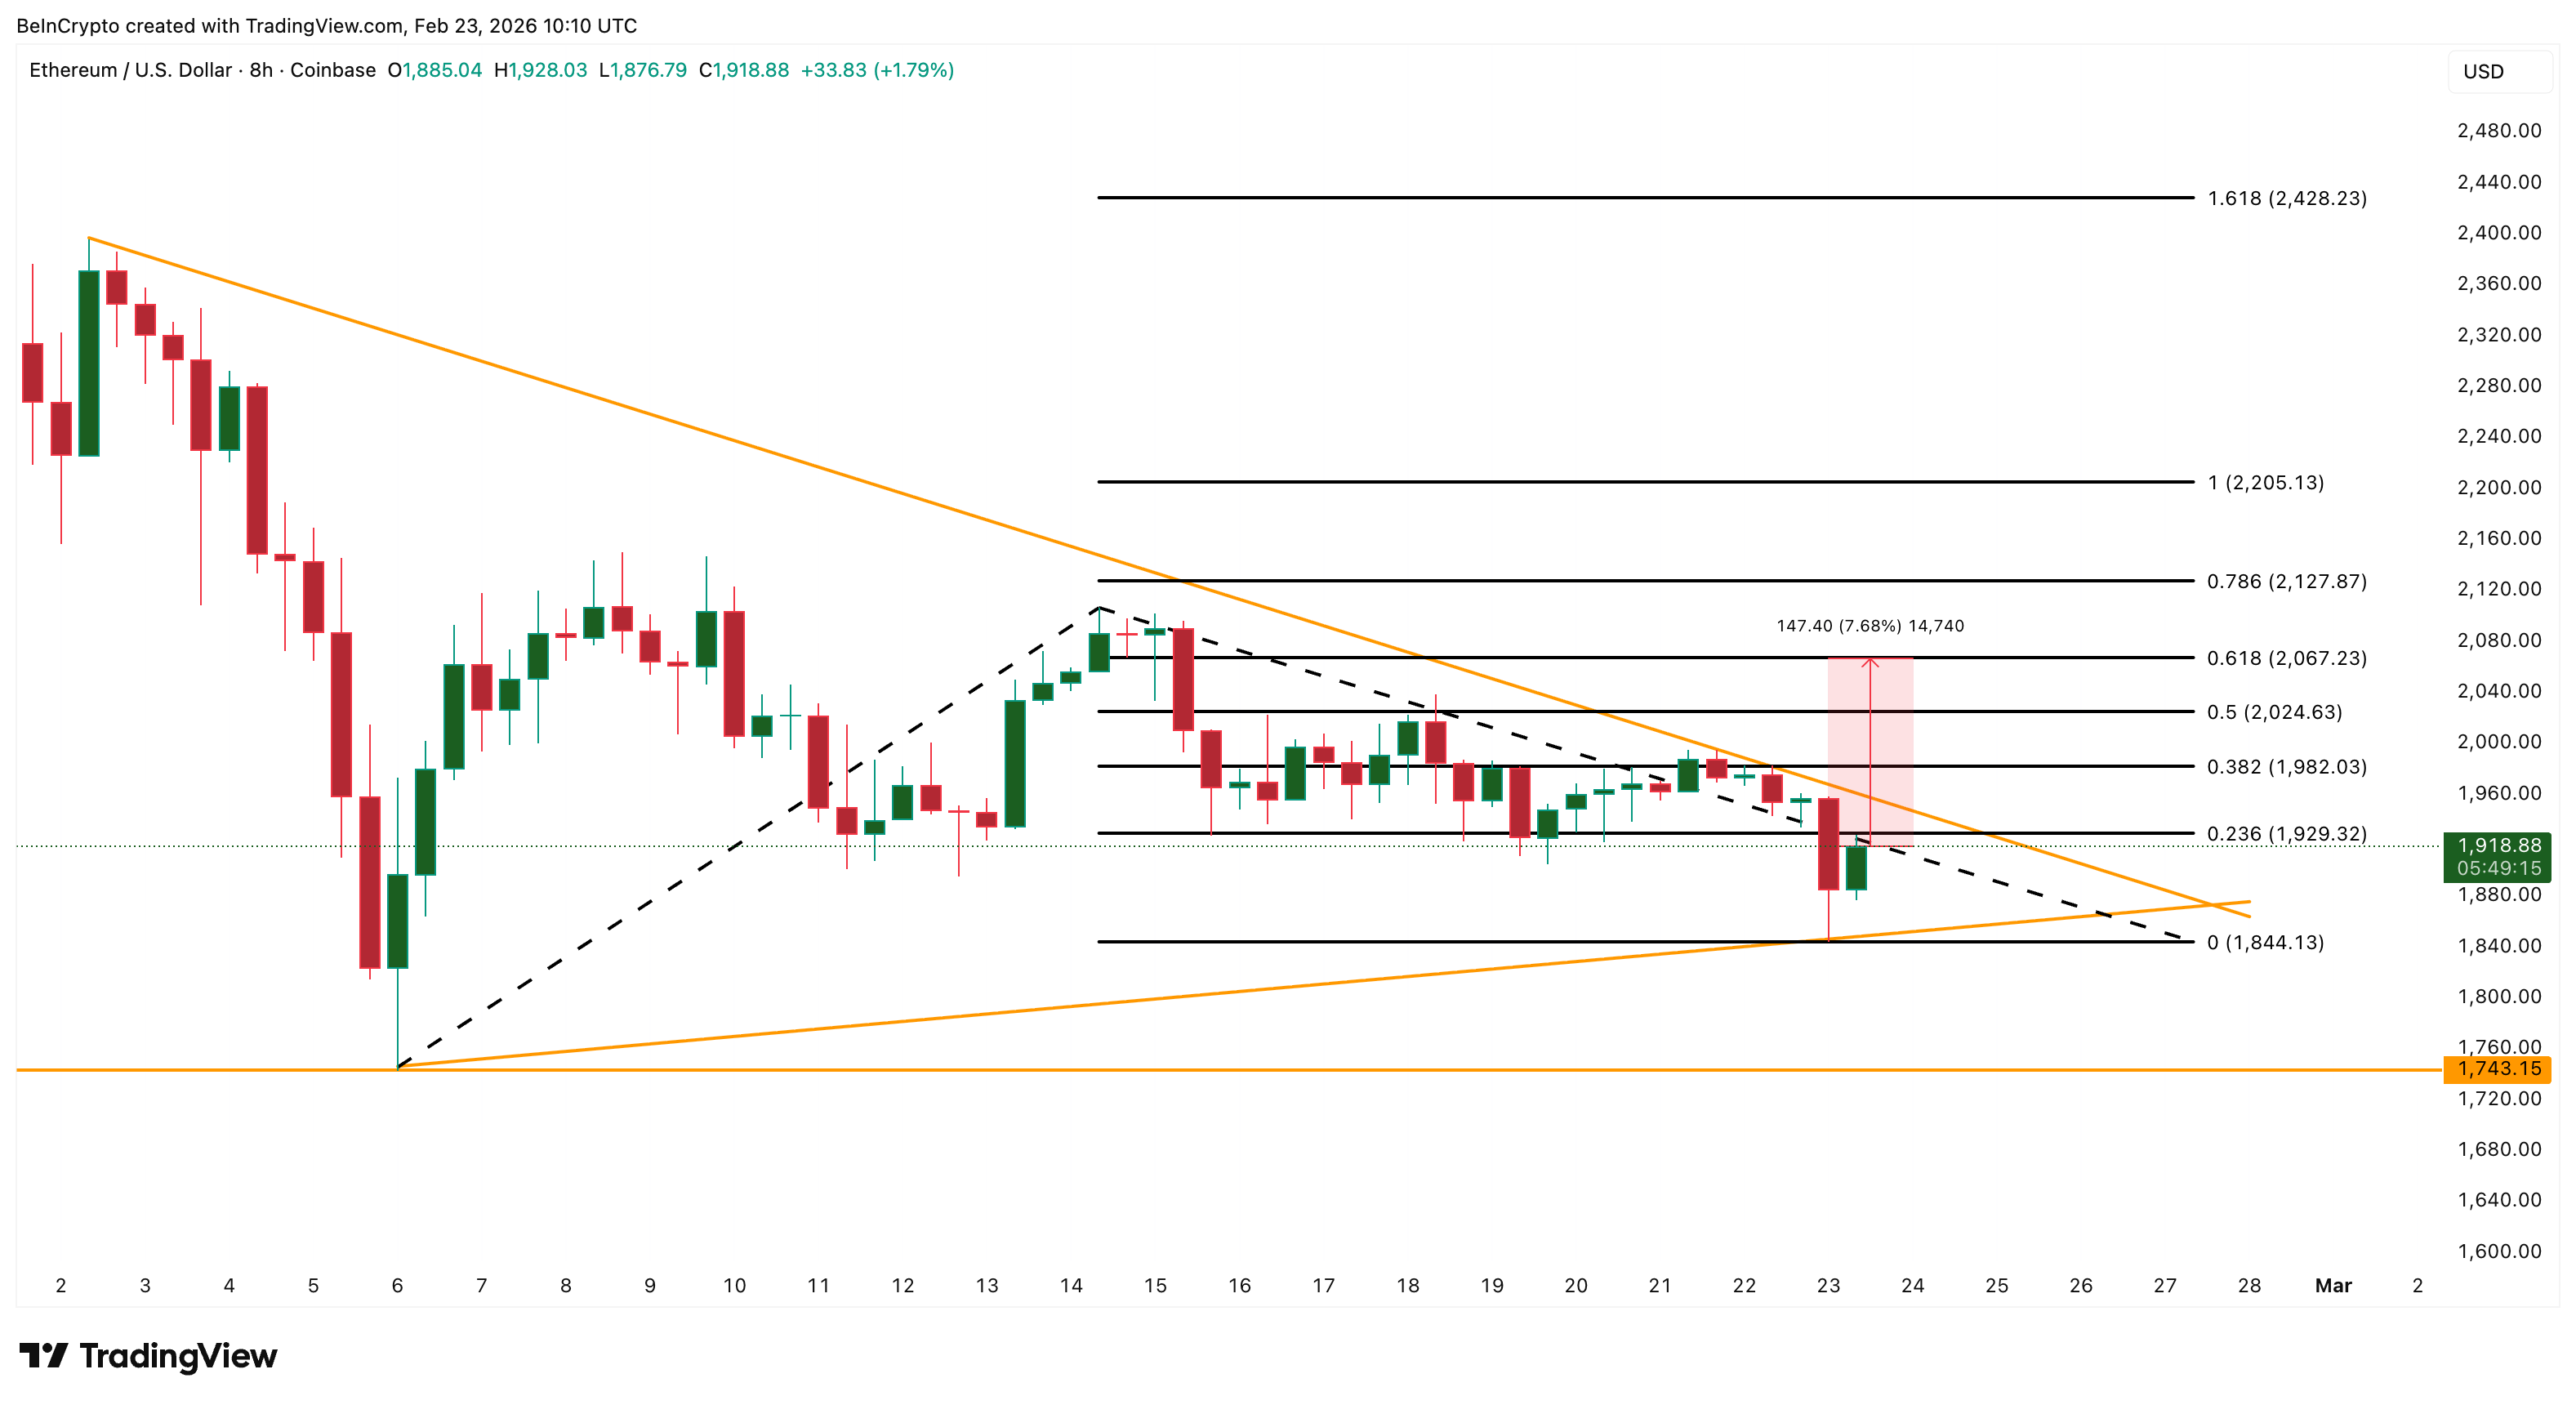
Ethereum’s short-term chart shows a symmetrical triangle. This pattern reflects indecision, where buyers and sellers are fighting for control.
At the same time, a bullish divergence has appeared between price and the Relative Strength Index (RSI). The RSI is a momentum indicator that measures whether selling pressure is strengthening or weakening. Between early February and today (February 23), Ethereum’s price has made lower lows, but the RSI has made higher lows. This pattern often signals that selling pressure is fading.
Want more token insights like this? Sign up for Editor Harsh Notariya’s Daily Crypto Newsletter here.
This same signal worked recently. Between February 3 and February 13, a similar divergence triggered a nearly 10% rebound. Another divergence between February 3 and February 15 led to a 6% move higher.
Ethereum has already started responding again. The recent 4% rebound shows buyers reacting to weakening downside momentum. But technical signals alone are not enough. The bigger question is what changed underneath the surface.
Selling Pressure Collapses 90% Even As Price Fell, Reveals Another Catalyst
The most important shift comes from exchange inflows. Exchange inflow measures the number of coins moving into exchanges. When coins move into exchanges, it usually signals intent to sell.
On February 7, Ethereum exchange inflows peaked near 1.06 million ETH. Since then, inflows have collapsed to just 126,000 ETH. This represents an almost 90% drop in potential selling pressure.
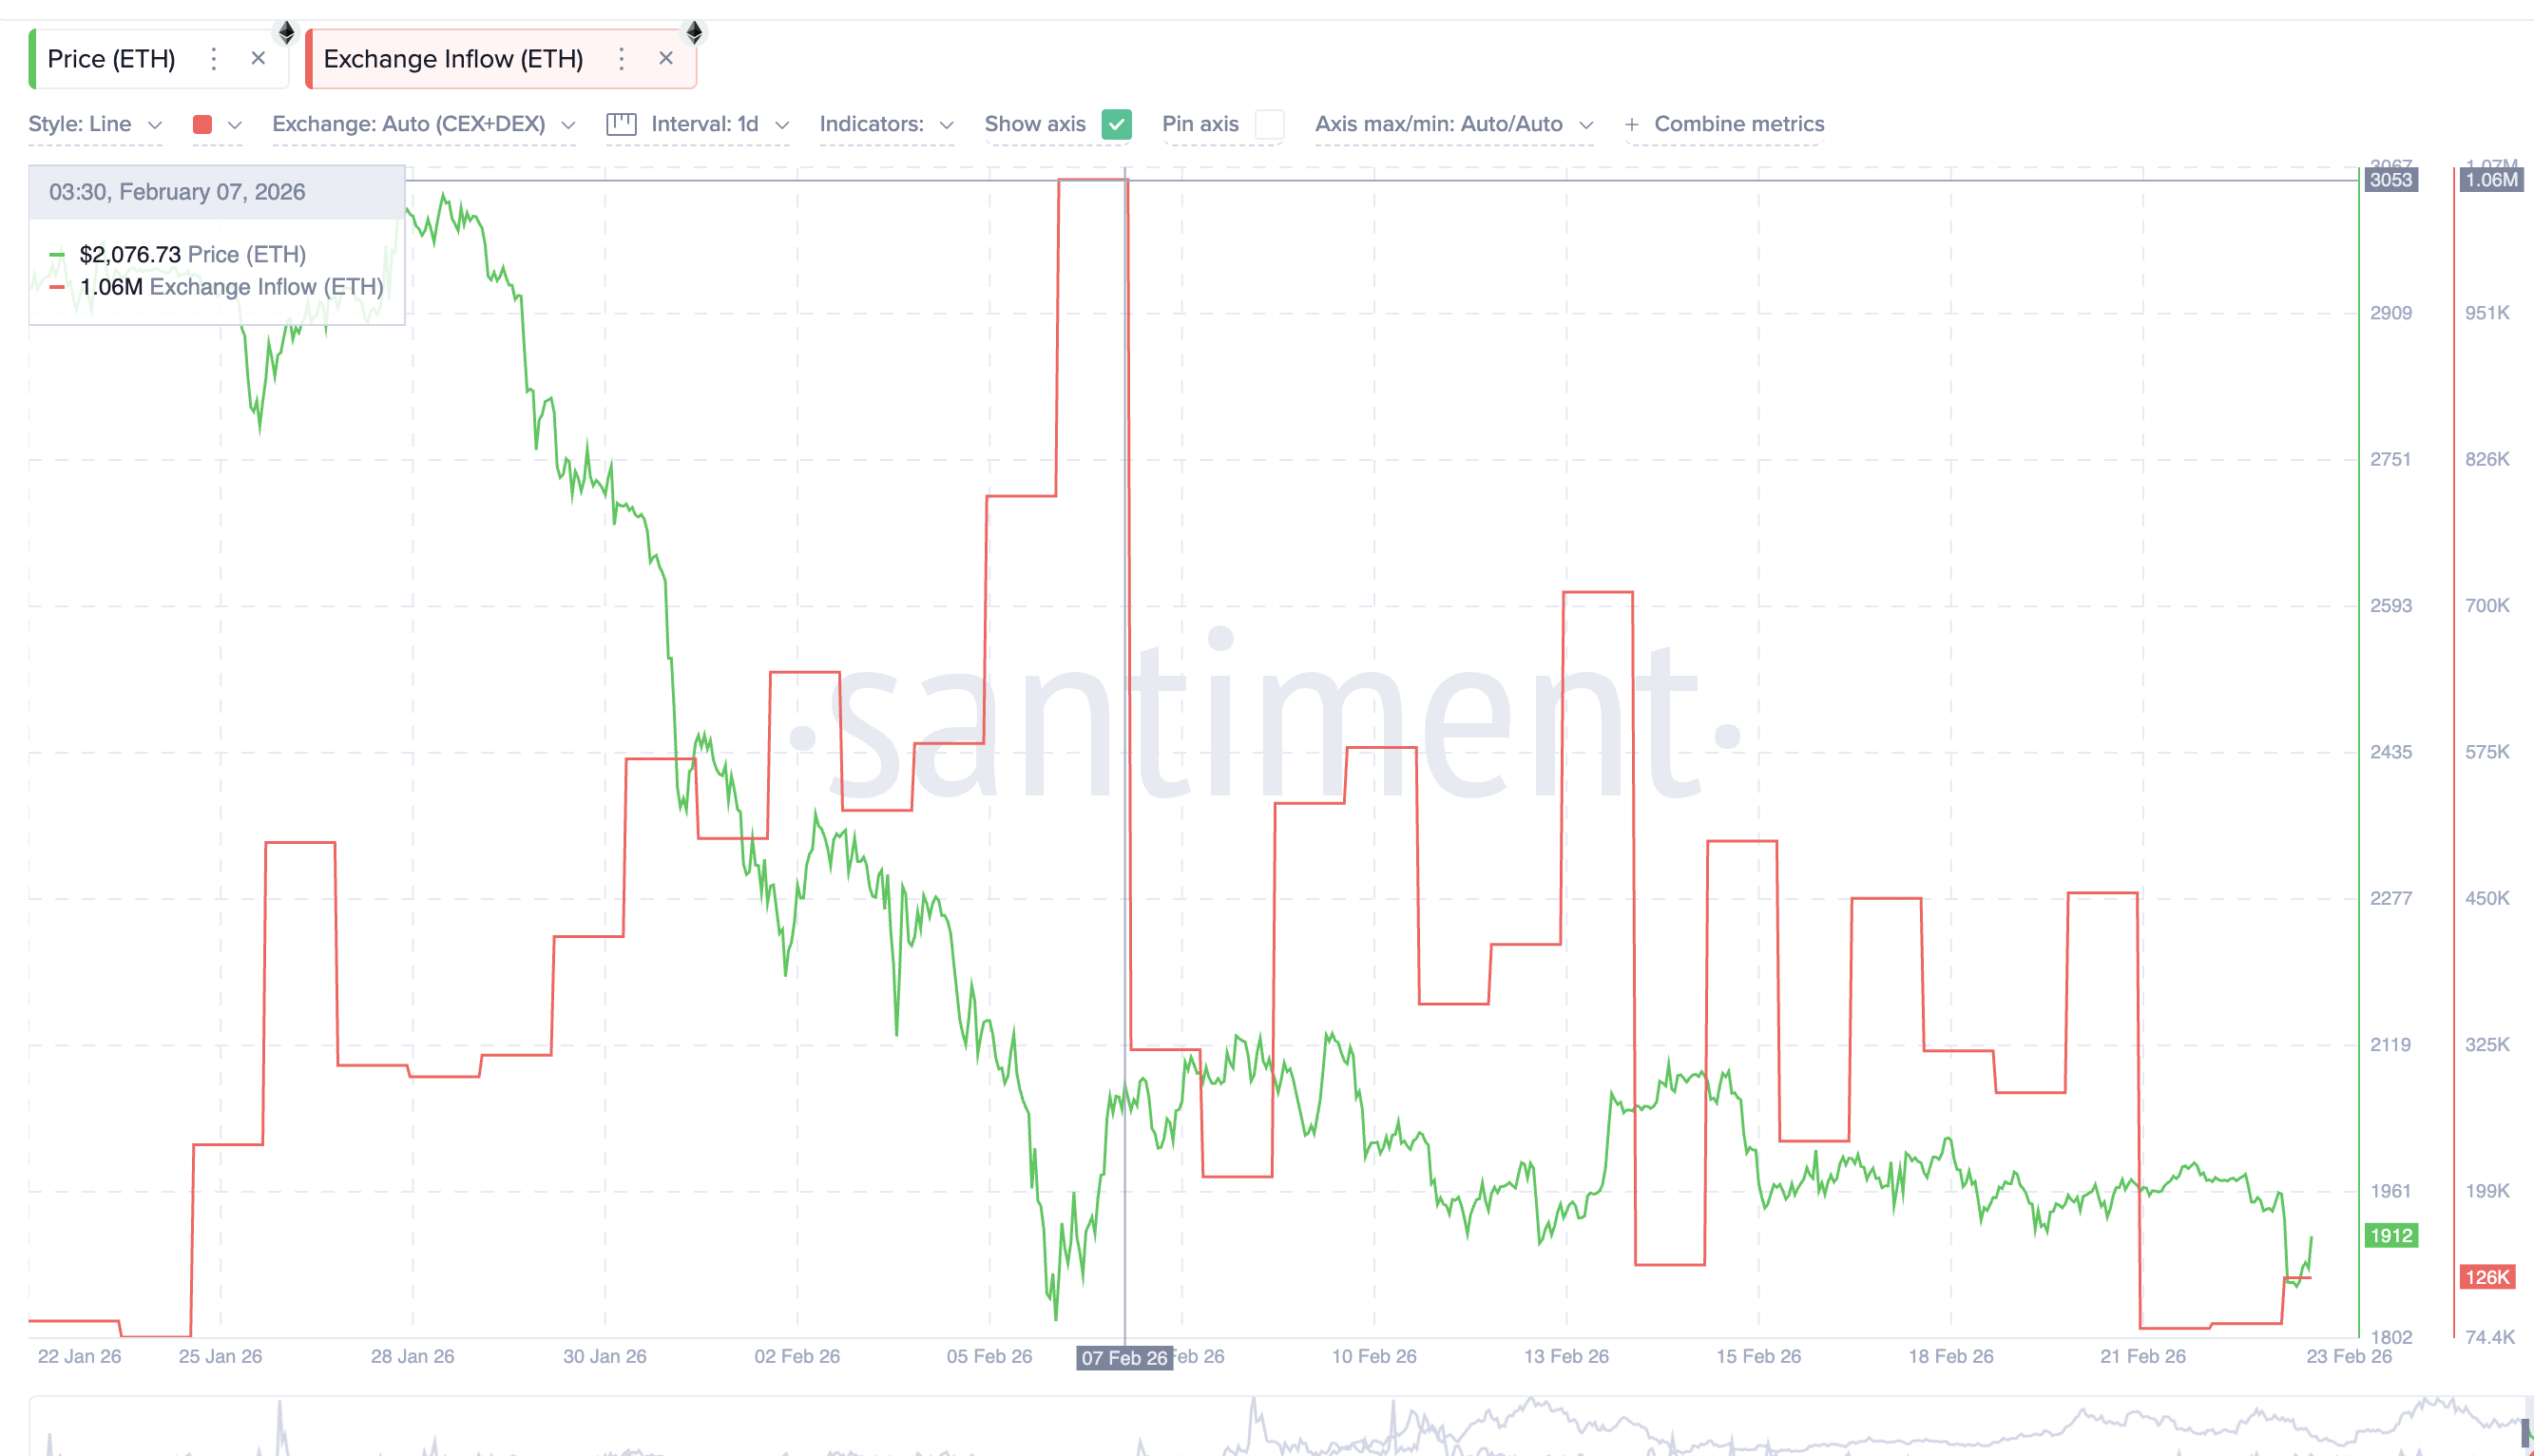
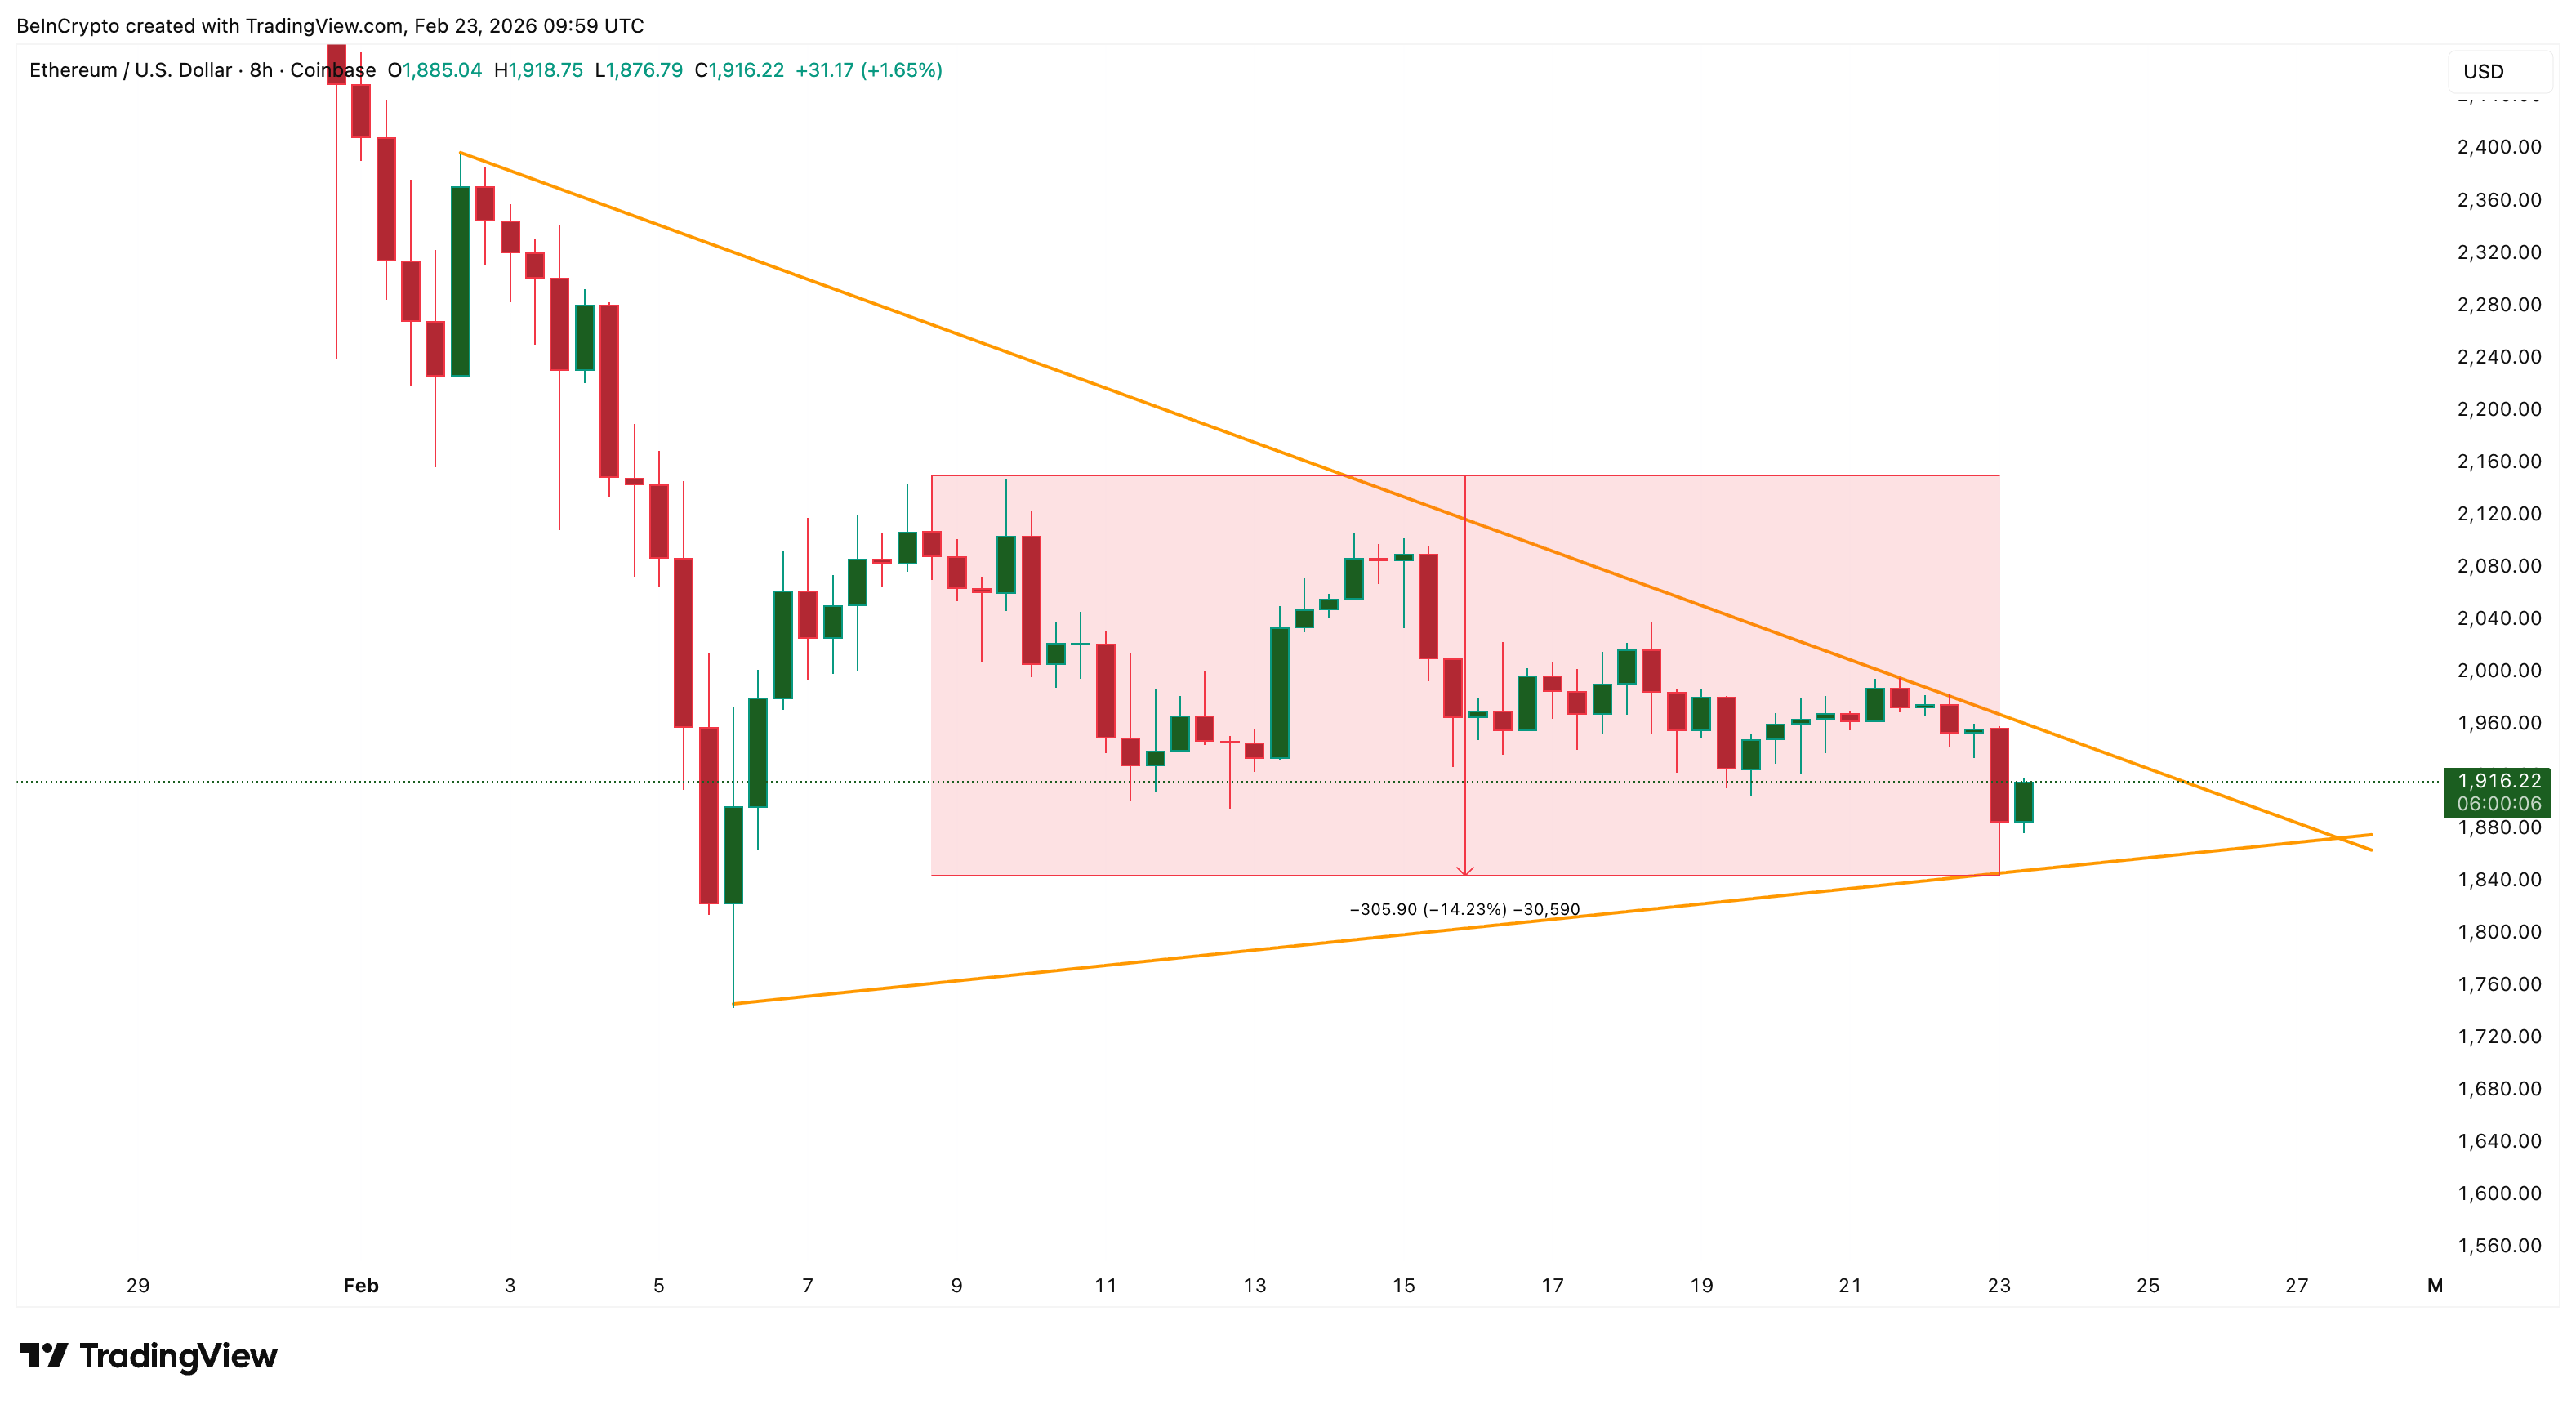
This change becomes even more important when compared to price. During the same period, Ethereum’s price still fell roughly 14%. Normally, price drops when selling pressure rises. But here, the price dropped while the selling pressure disappeared.
This shows the decline was not driven by aggressive spot selling. Instead, it suggests the weakness came from another source. That source appears to be derivatives traders. Ethereum’s funding rate has turned deeply negative. When funding is negative, short sellers are paying to maintain bearish positions.
Since February 7, funding rates dropped from slightly positive levels to around -0.02%. This marks one of the most bearish sentiment flips in recent weeks.
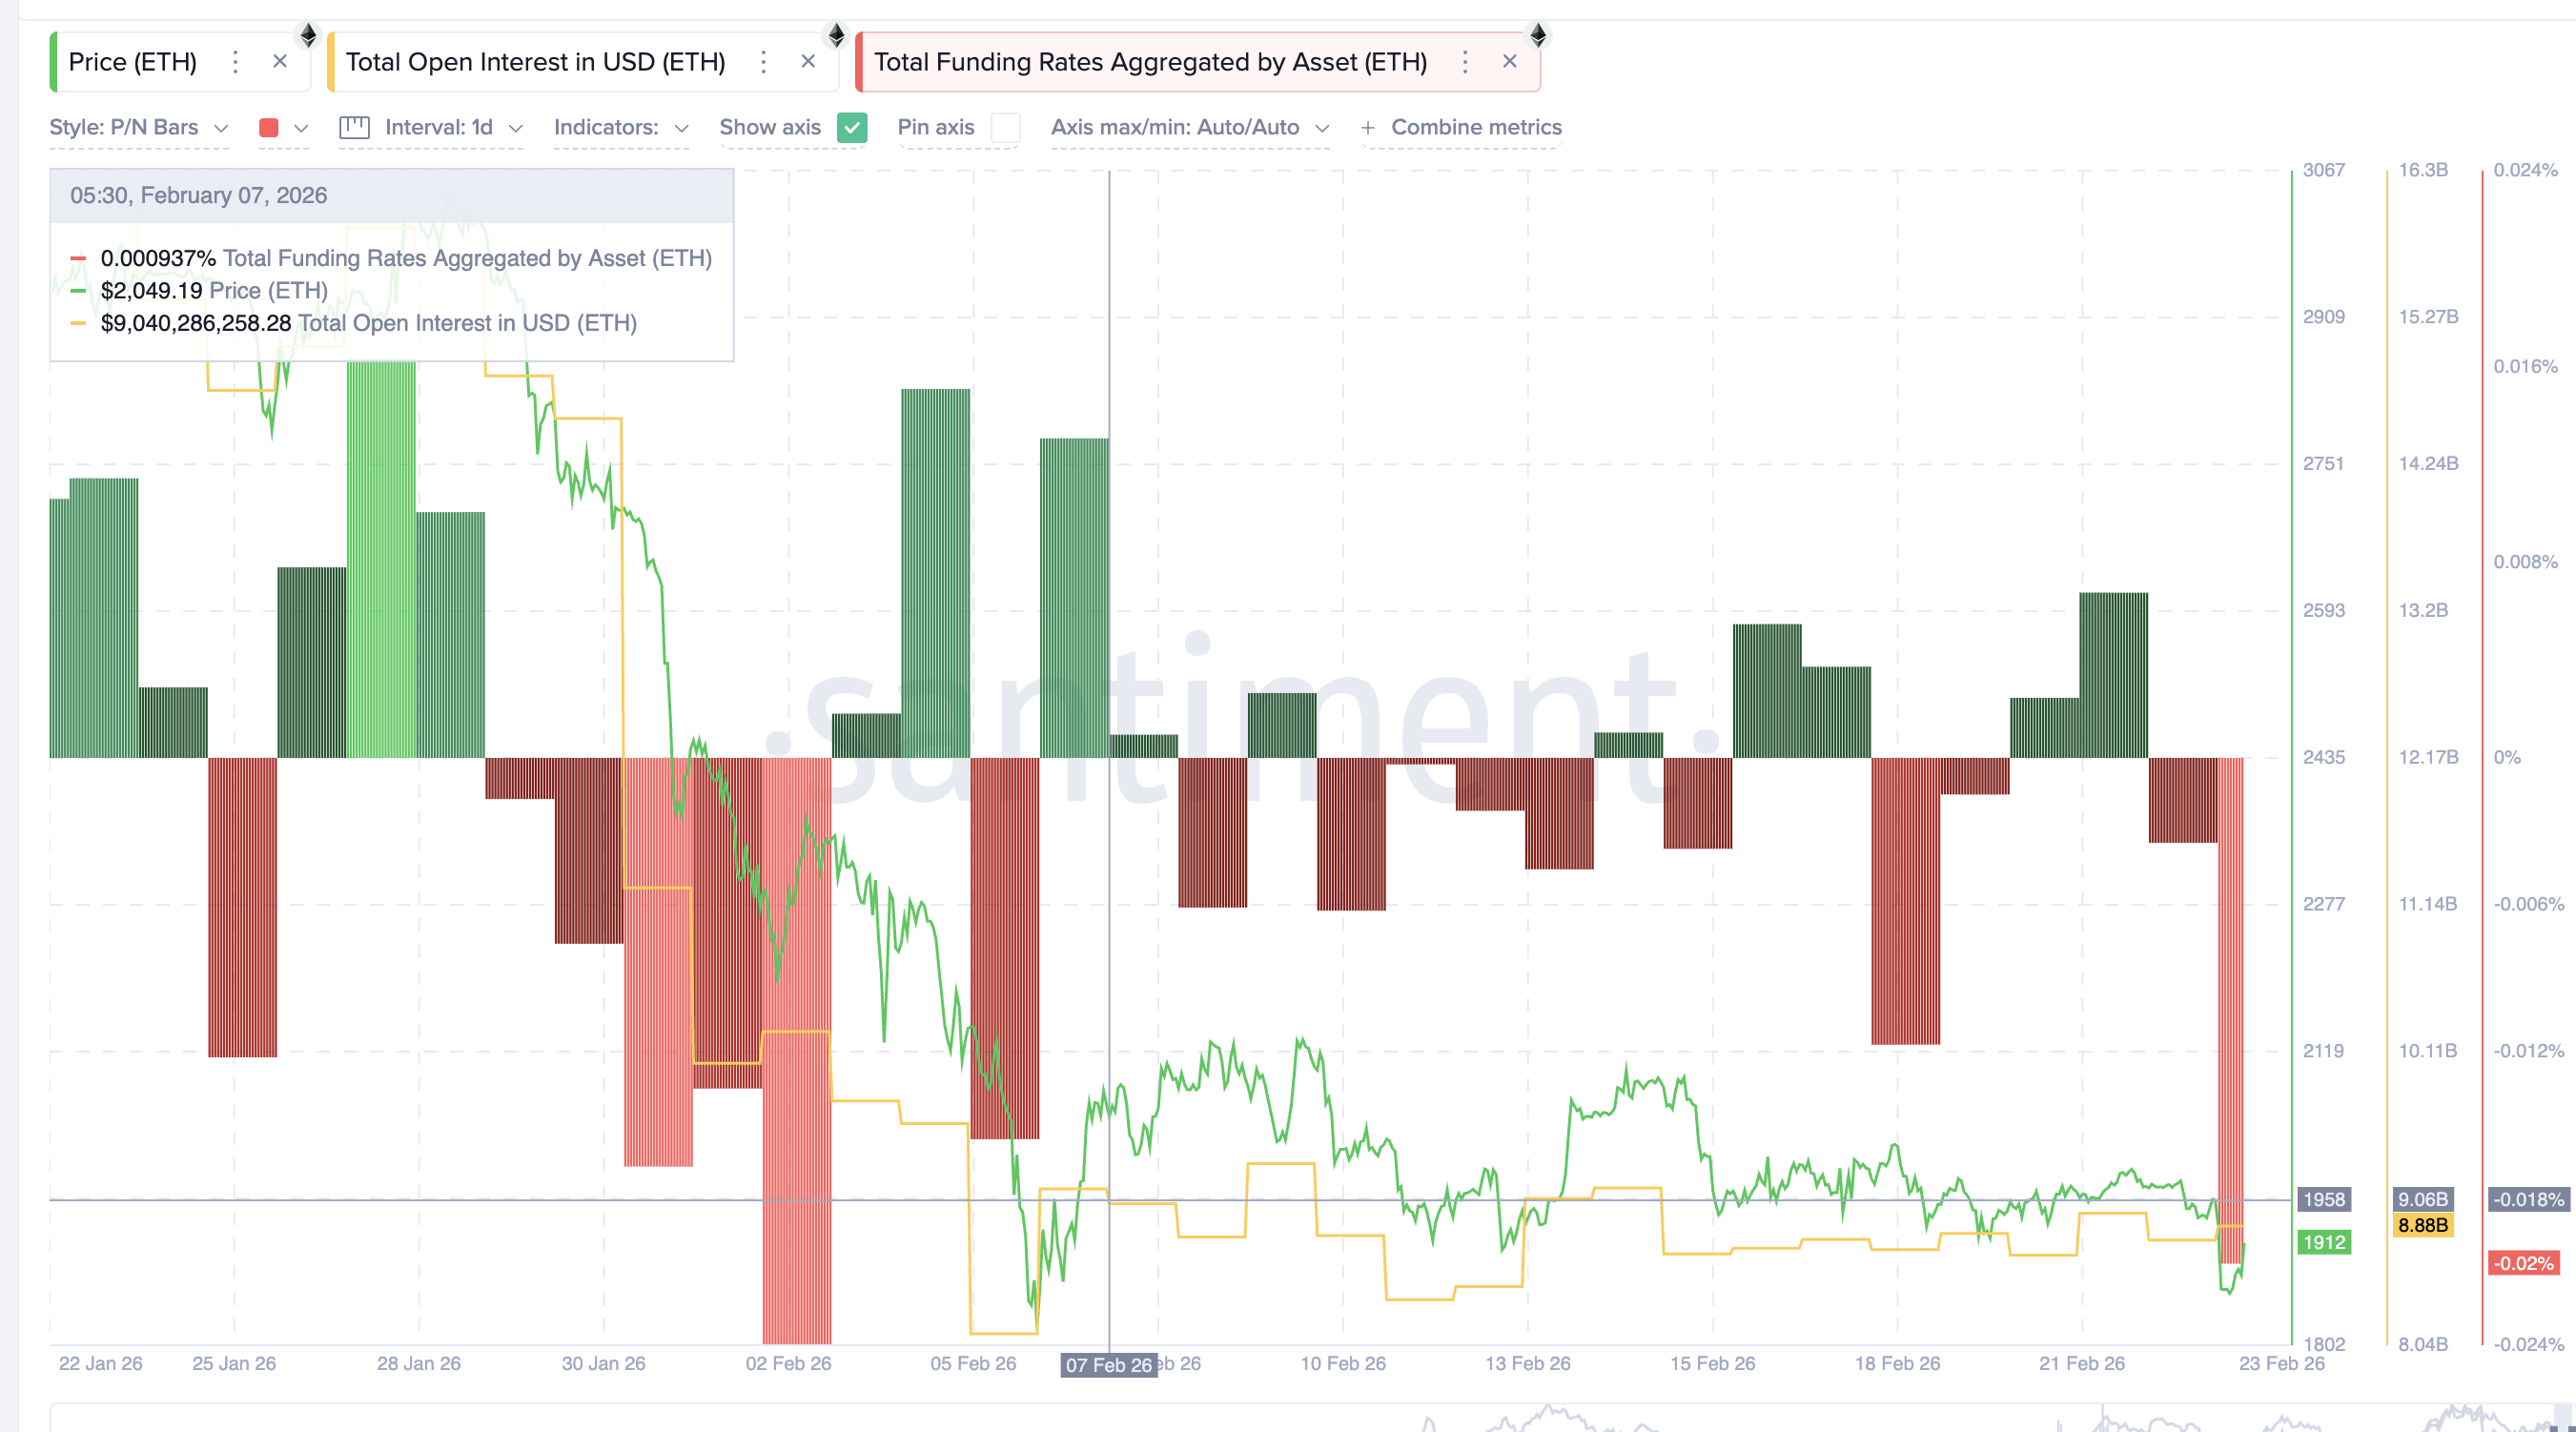
However, open interest tells a different story. Open interest measures the total value of active futures positions. During this period, open interest stayed mostly flat, falling only slightly from around $9.06 billion to $8.88 billion.
This combination is important. It shows that new short positions are not aggressively entering. Instead, existing traders have turned bearish, and long positions have likely exited.
This type of setup can be unstable. When bearish sentiment rises without large new positions, the market becomes vulnerable to a short squeeze. A short squeeze happens when rising prices force short sellers to close positions, pushing the price even higher.
This helps explain why Ethereum’s bounce could extend beyond a simple short-term rebound.
Long-Term Holders Suddenly Turn Buyers After Weeks of Selling
Another important shift comes from long-term holders. The Hodler Net Position Change metric measures whether long-term investors are buying or selling.
Between February 3 and February 20, this metric stayed negative. This showed sustained selling from experienced investors. At its peak, long-term holders sold more than 41,000 ETH on a net basis. But this trend has now reversed. Over the past two days, the metric turned positive, reaching a net accumulation of over 6,000 ETH.
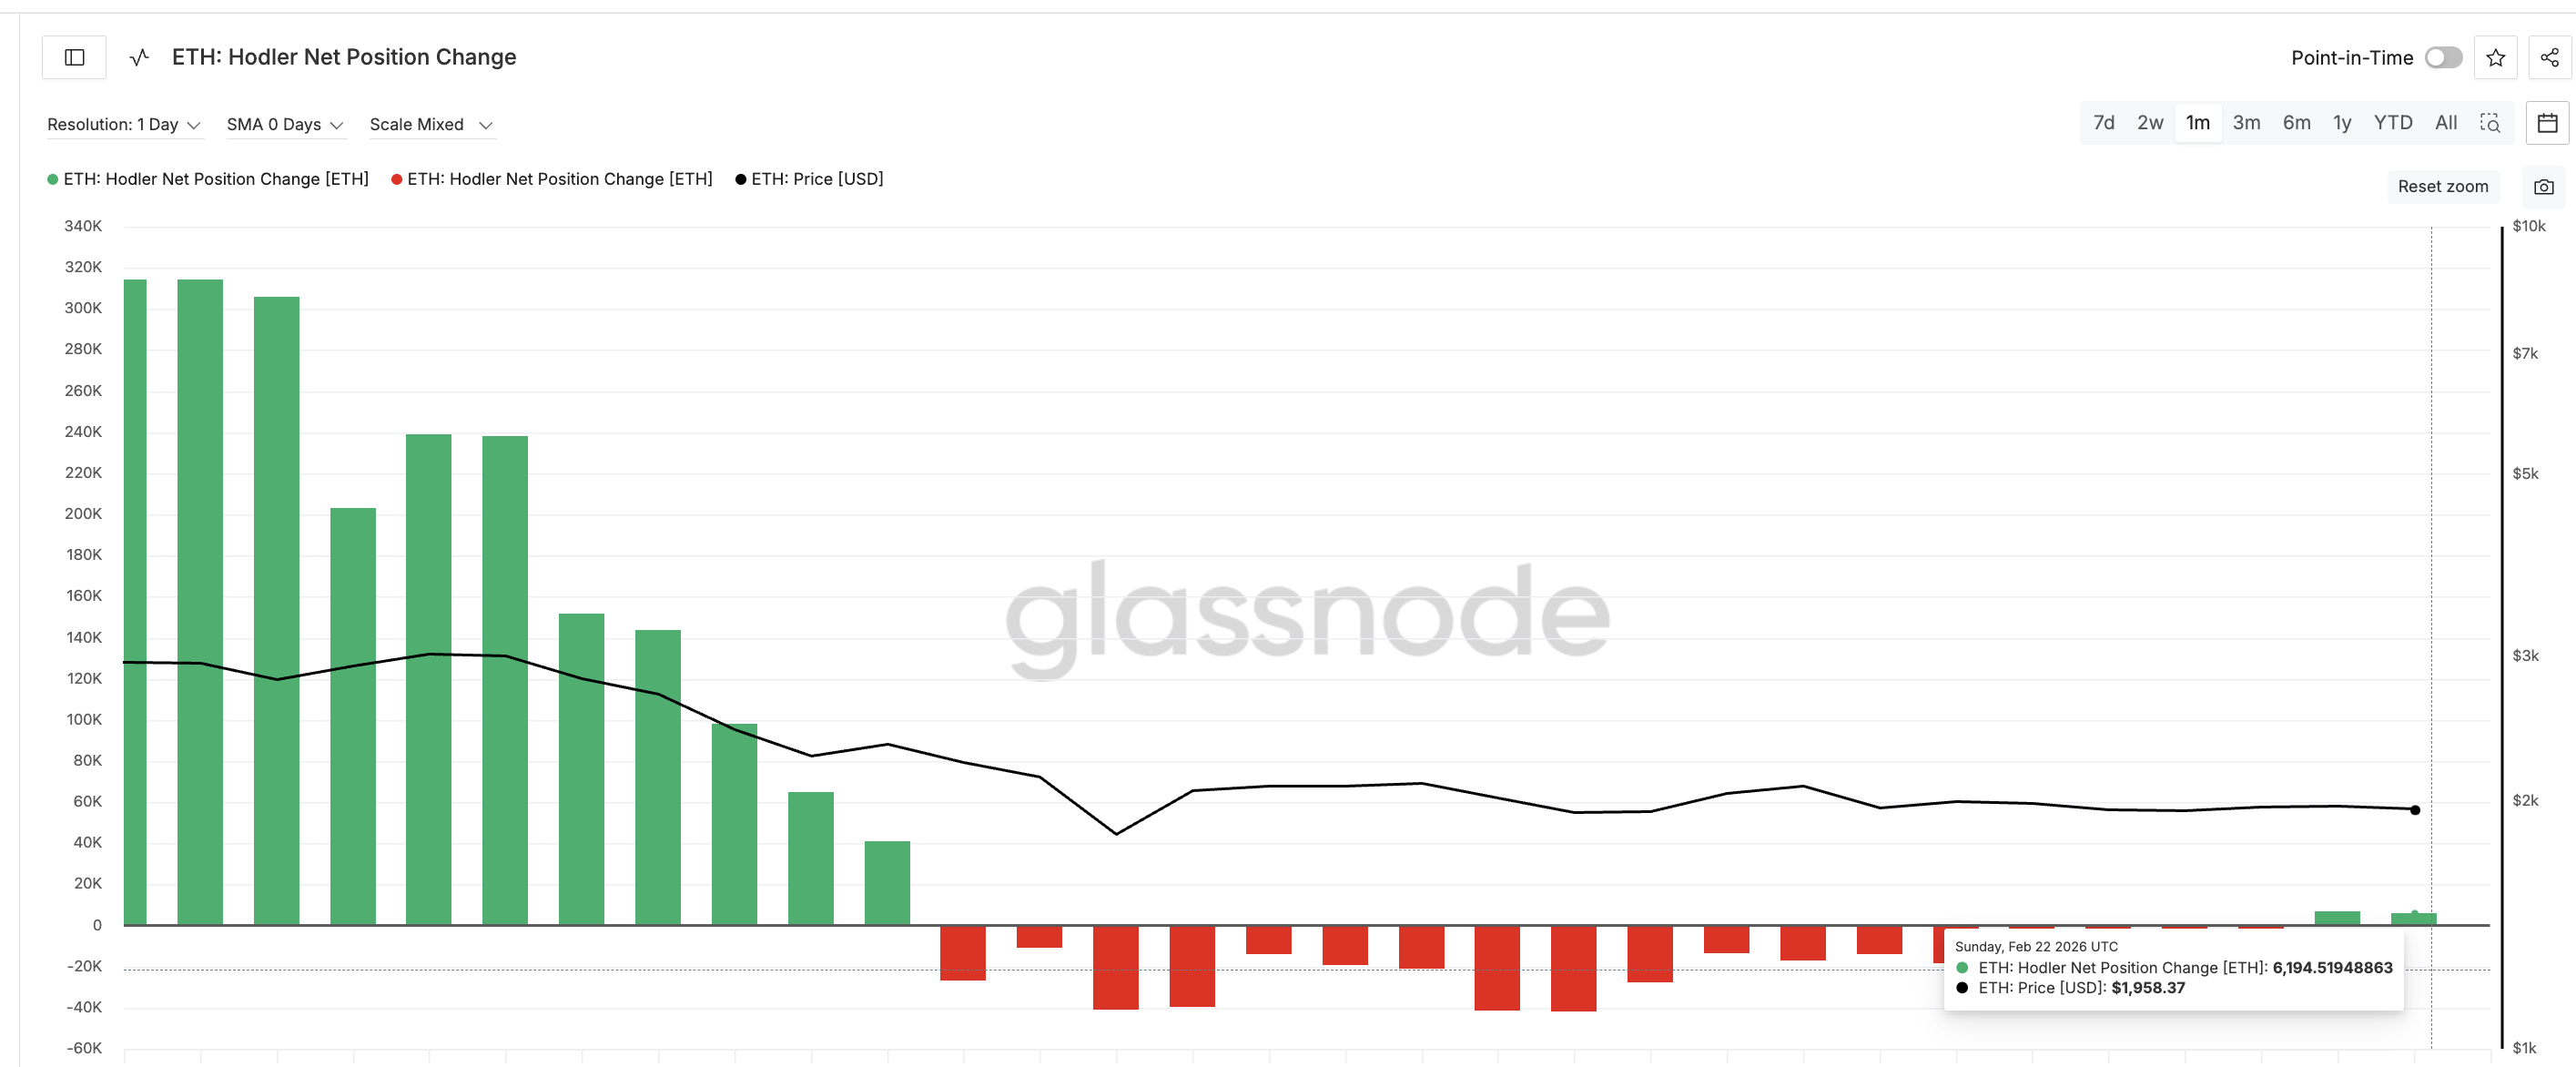
This confirms that experienced investors have resumed buying. This type of accumulation often happens near local bottoms, when long-term investors position early before broader recoveries begin.
With selling pressure falling, bearish derivatives sentiment stretched, and long-term buyers returning, Ethereum’s bounce setup now has stronger structural support.
Ethereum Price Faces Key Breakout Levels That Could Extend Bounce
Ethereum now faces several important resistance levels. The first key level sits at $1,920. Breaking above this level would confirm strengthening momentum. The next resistance appears at $2,020, followed by a major barrier near $2,060, a key technical level, where it can experience the most resistance.
If Ethereum breaks above $2,060, the bounce could accelerate toward $2,200 and potentially even $2,420.
However, the bullish setup depends on holding support. The critical downside level remains $1,840. If Ethereum falls below this level, the bounce structure would fail. In that case, the next downside target sits near $1,740.
For now, Ethereum’s bounce is no longer just a simple relief rally. Selling pressure has collapsed by nearly 90%. Bearish sentiment increased without strong conviction. And long-term holders have quietly returned as buyers.
These combined forces suggest Ethereum’s current rebound may be the early stage of a larger move — with the next breakout level now becoming the decisive trigger.
The post Ethereum (ETH) Bounces After 90% Selling Pressure Collapse — Bigger Move Coming? appeared first on BeInCrypto.
Read moreLatest News