
Ethereum ETF Flows Hide Clues To A 10% Price Recovery
Ethereum price is up 2.7% over the past seven days, yet down 1.8% in the last 24 hours, trading near $1,960. While modest, this move arrives alongside two consecutive weeks of positive Ethereum ETF inflows: a pattern that has historically preceded rallies (or bounces), depending on how you see them.
A developing bullish RSI divergence on the daily chart adds further weight to the case that an Ethereum price recovery may be forming.
ETF Flows Flash A Familiar Signal, And RSI Divergence Backs It Up
Ethereum spot ETF flows have turned positive for two consecutive weeks after a prolonged stretch of outflows. Data shows the last red week ended on February 20, when net outflows hit -$123 million and Ethereum price sat at $1,970. Since then, two green weeks have followed.
This matters because of what happened the previous two times Ethereum ETF flows flipped from red to green.
In the first instance, the week ending November 21 recorded -$500 million in outflows with ETH at around $2,730. The following week flipped to +$313 million, and the Ethereum price surged above $3,050 — a gain of 11.6%.
In the second instance, the week ending January 9 saw -$68 million in outflows with ETH at around $3,070. The next week turned positive at +$479 million, and the price rose to $3,290 — a 7.1% gain.
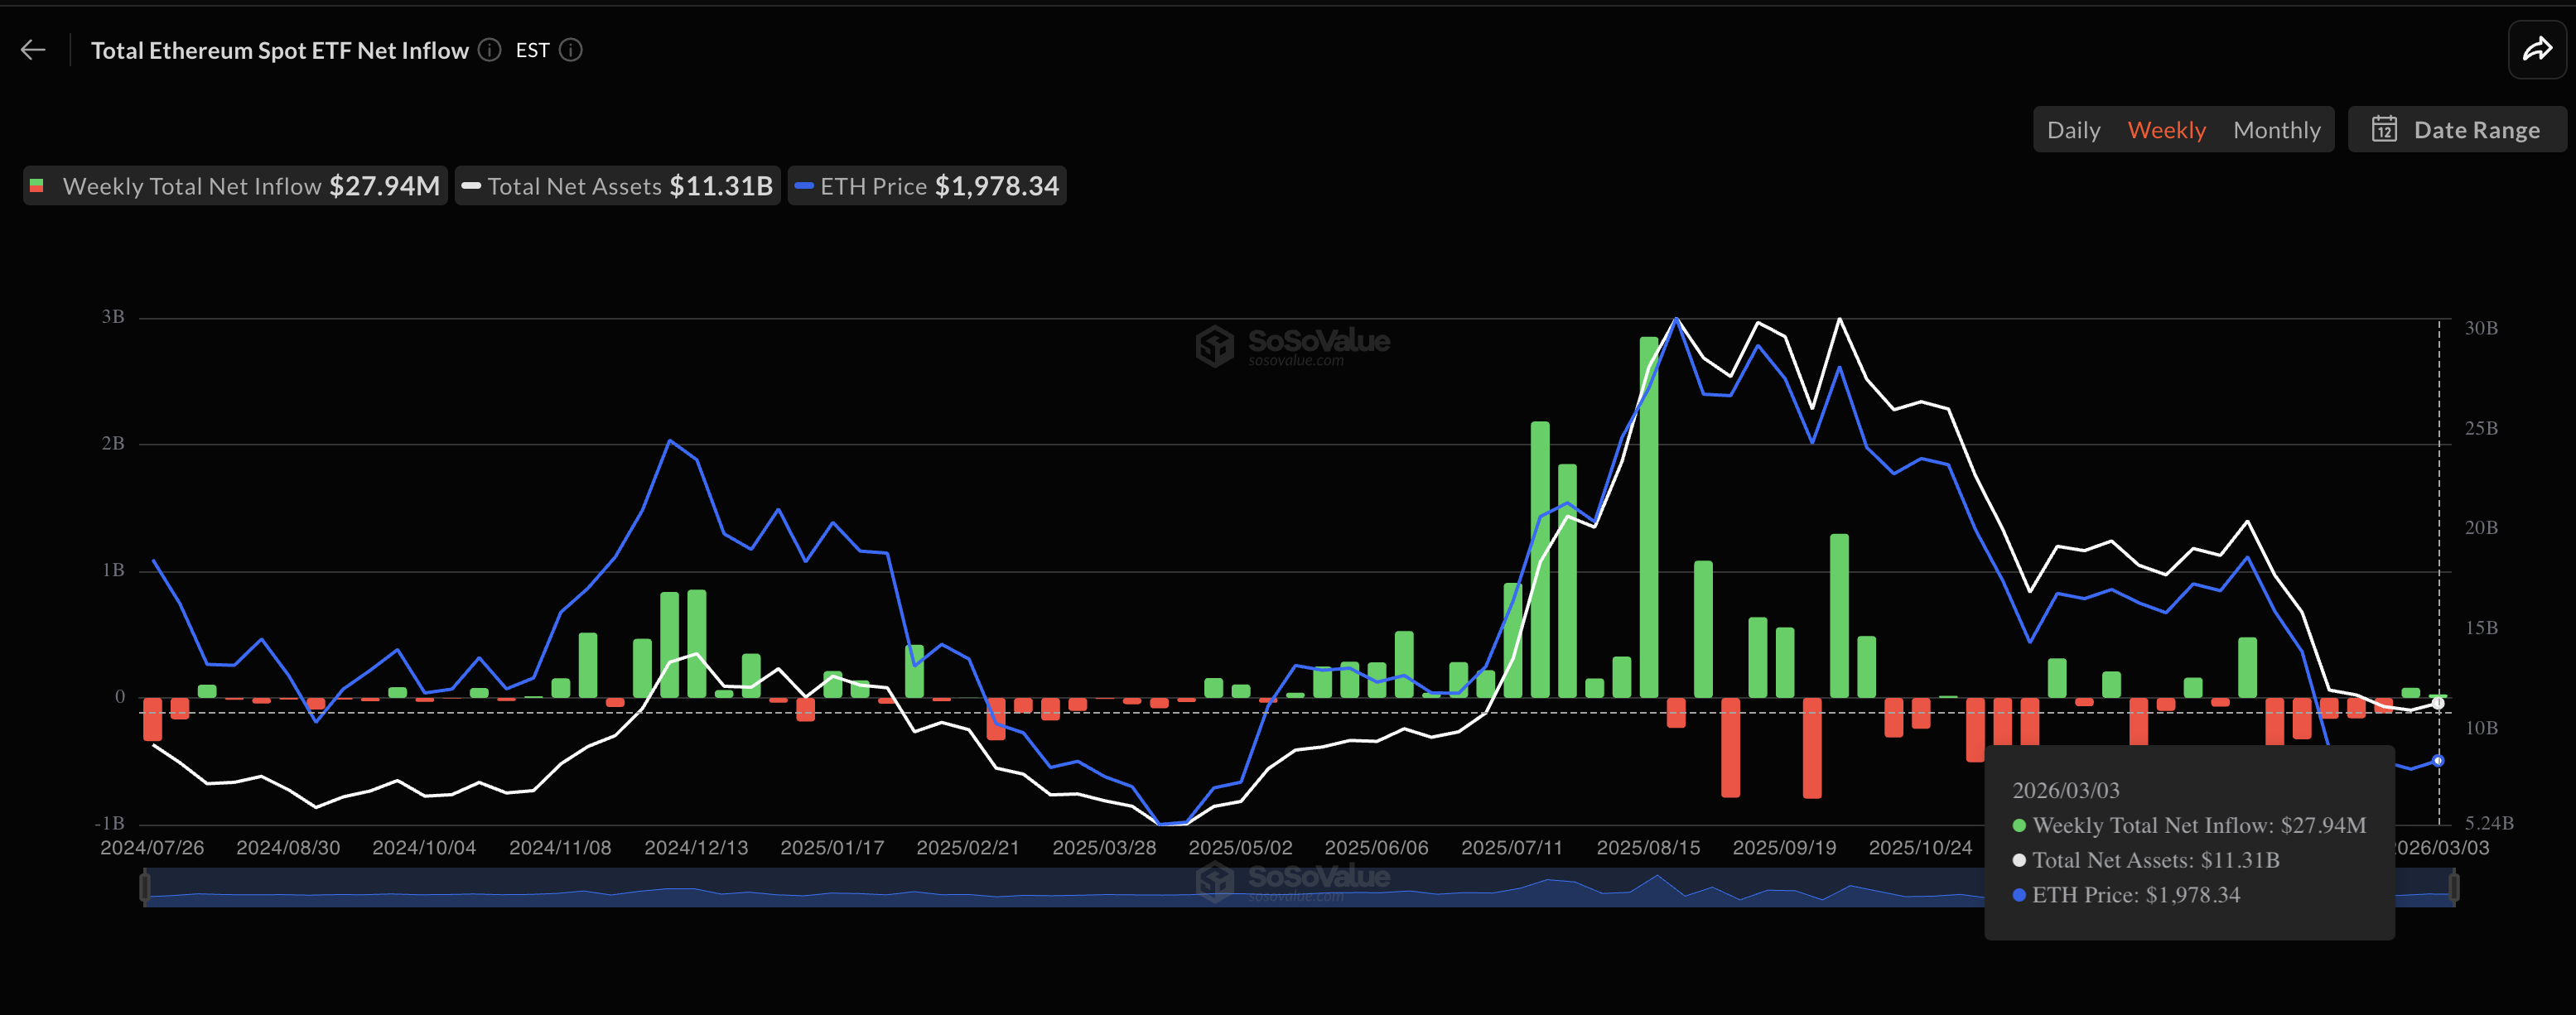
The average move across both flips is approximately 10%. With two consecutive green weeks now confirmed after the February 20 red close, the same pattern could be in play again.
Supporting this is a bullish relative strength index (RSI) divergence on the daily chart. Between January 25 and March 3, Ethereum’s price has been forming a lower low. The RSI, a momentum indicator, has printed a higher low, which is a classic rebound signal. While it is usually a trend reversal sign, the current market conditions could just keep it to a rebound.
The March 3 candle shows a swing low forming via its wick, keeping the immediate bounce case active. However, if the next candle breaks below $1,920, that swing low breaks, and the immediate rebound weakens.
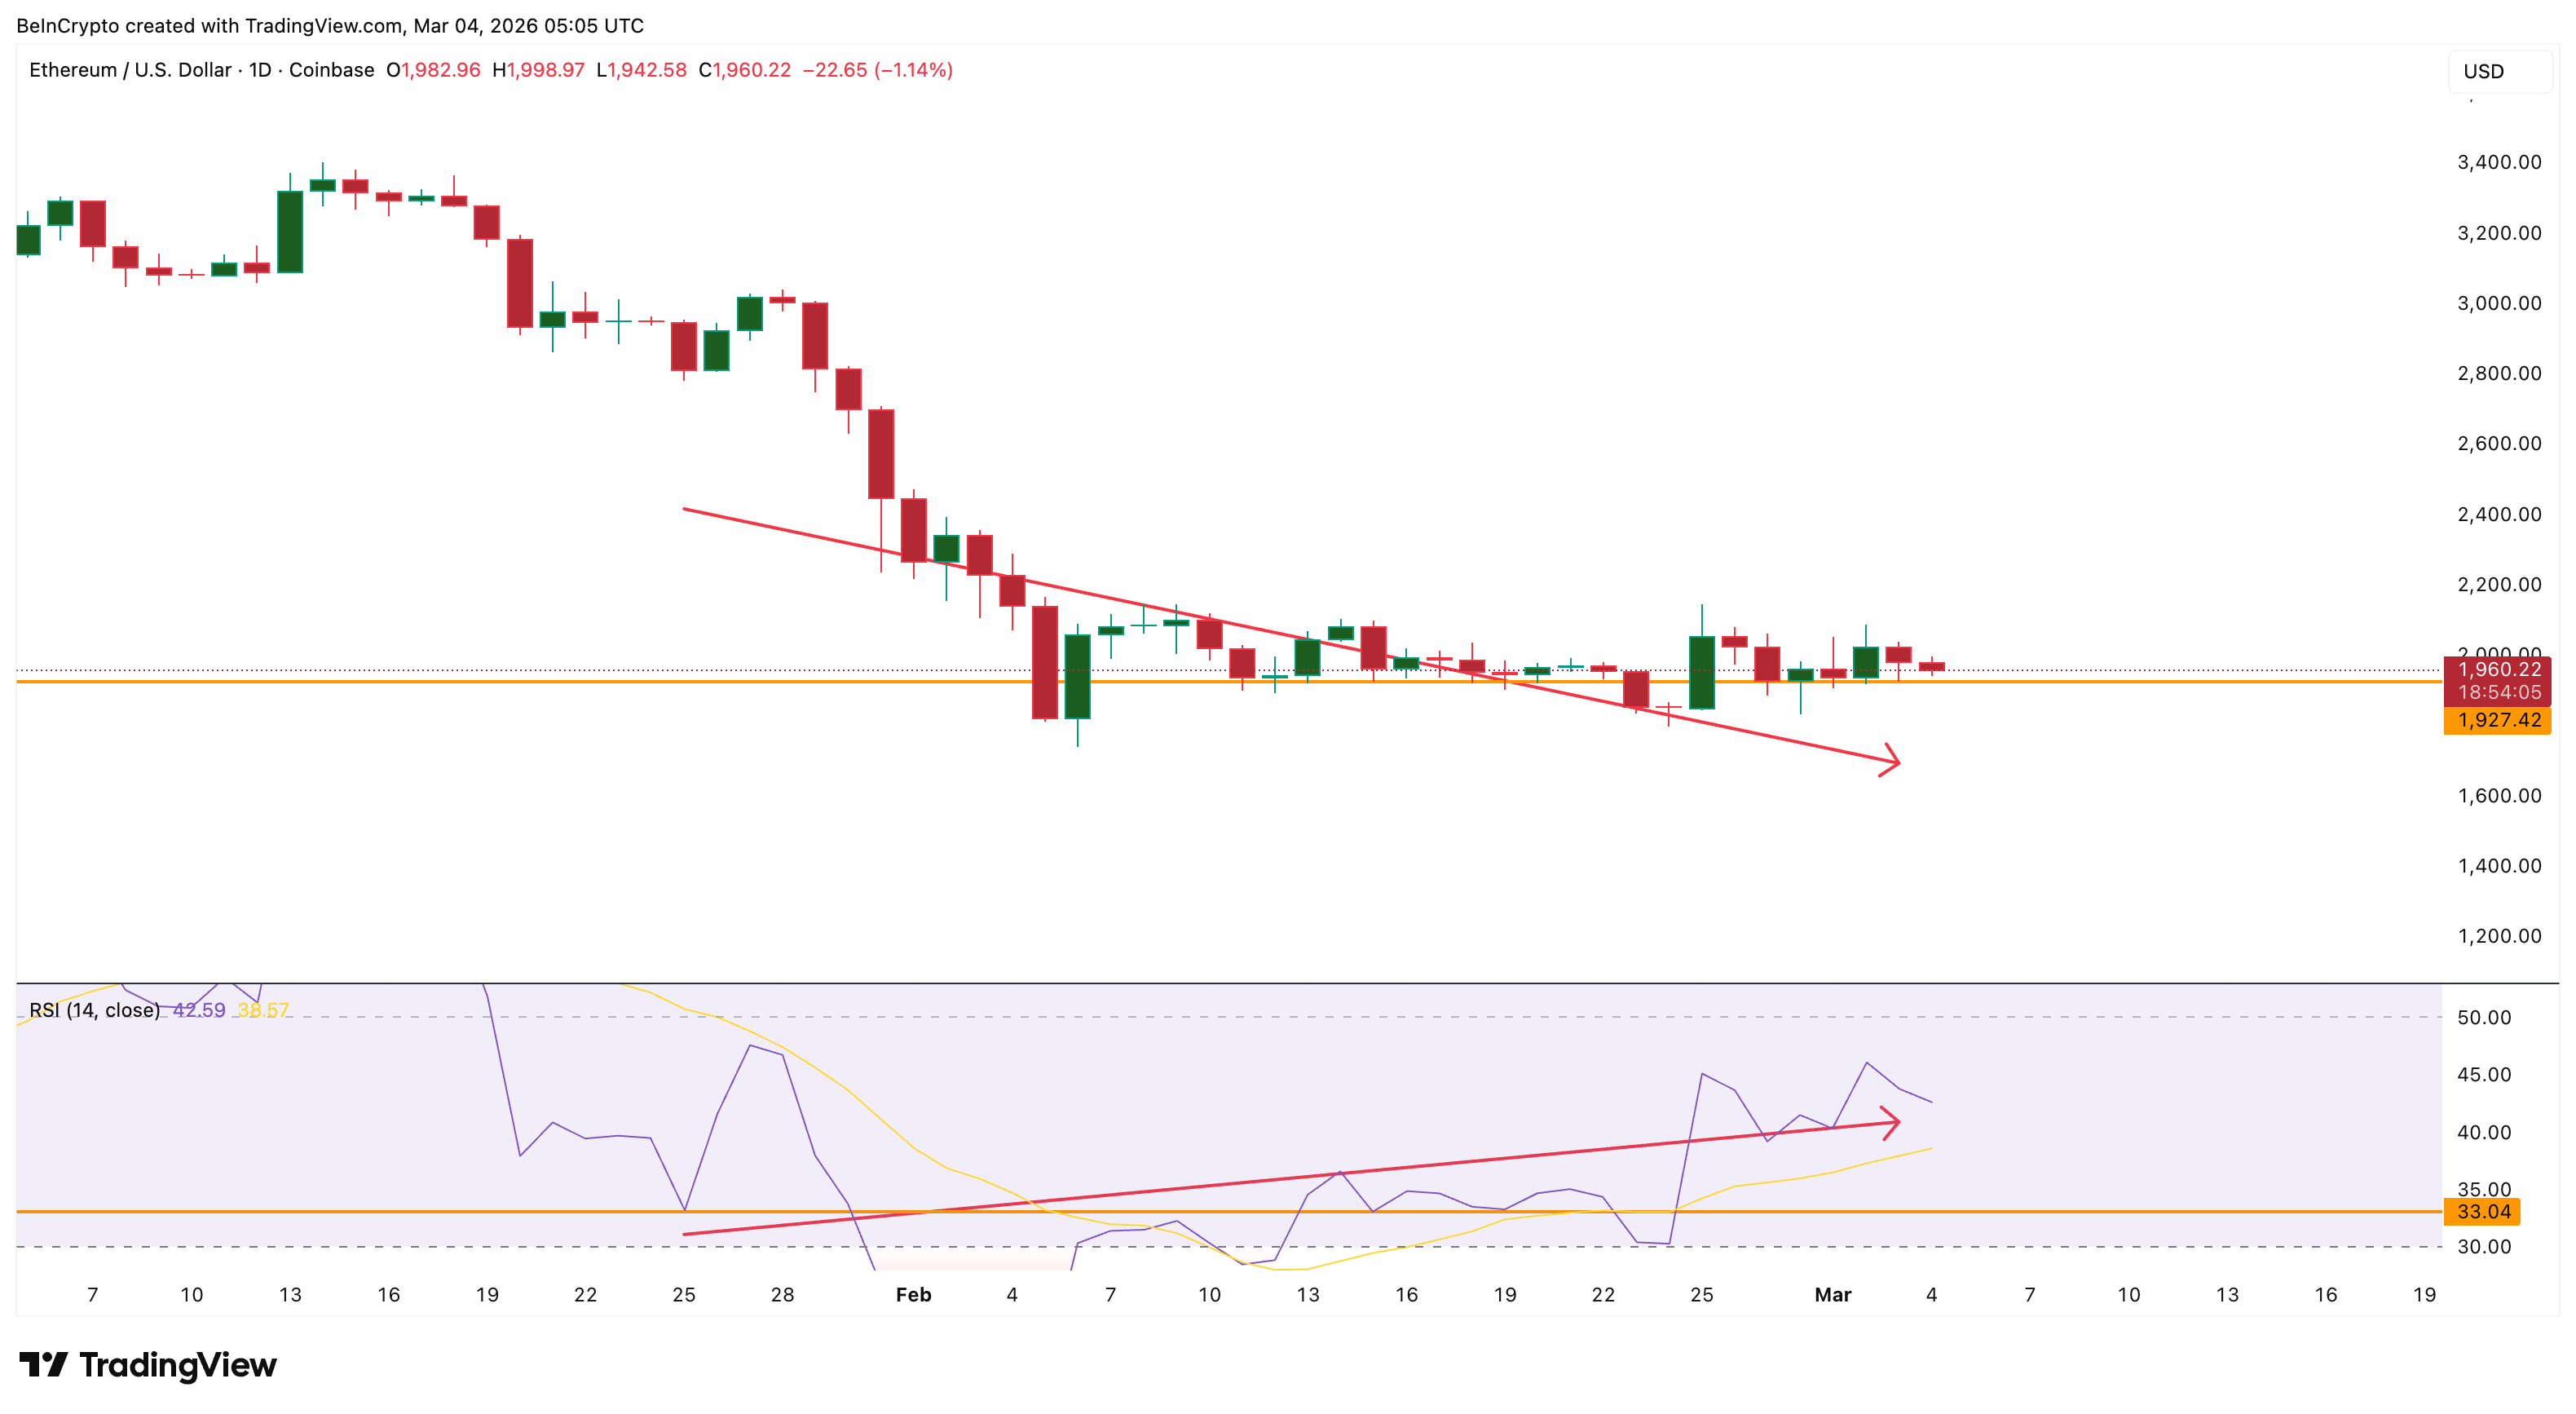
The broader divergence structure remains intact as the price would continue to be lower than the January 25 swing low.
Supply Clusters Map the Key Resistance (s)
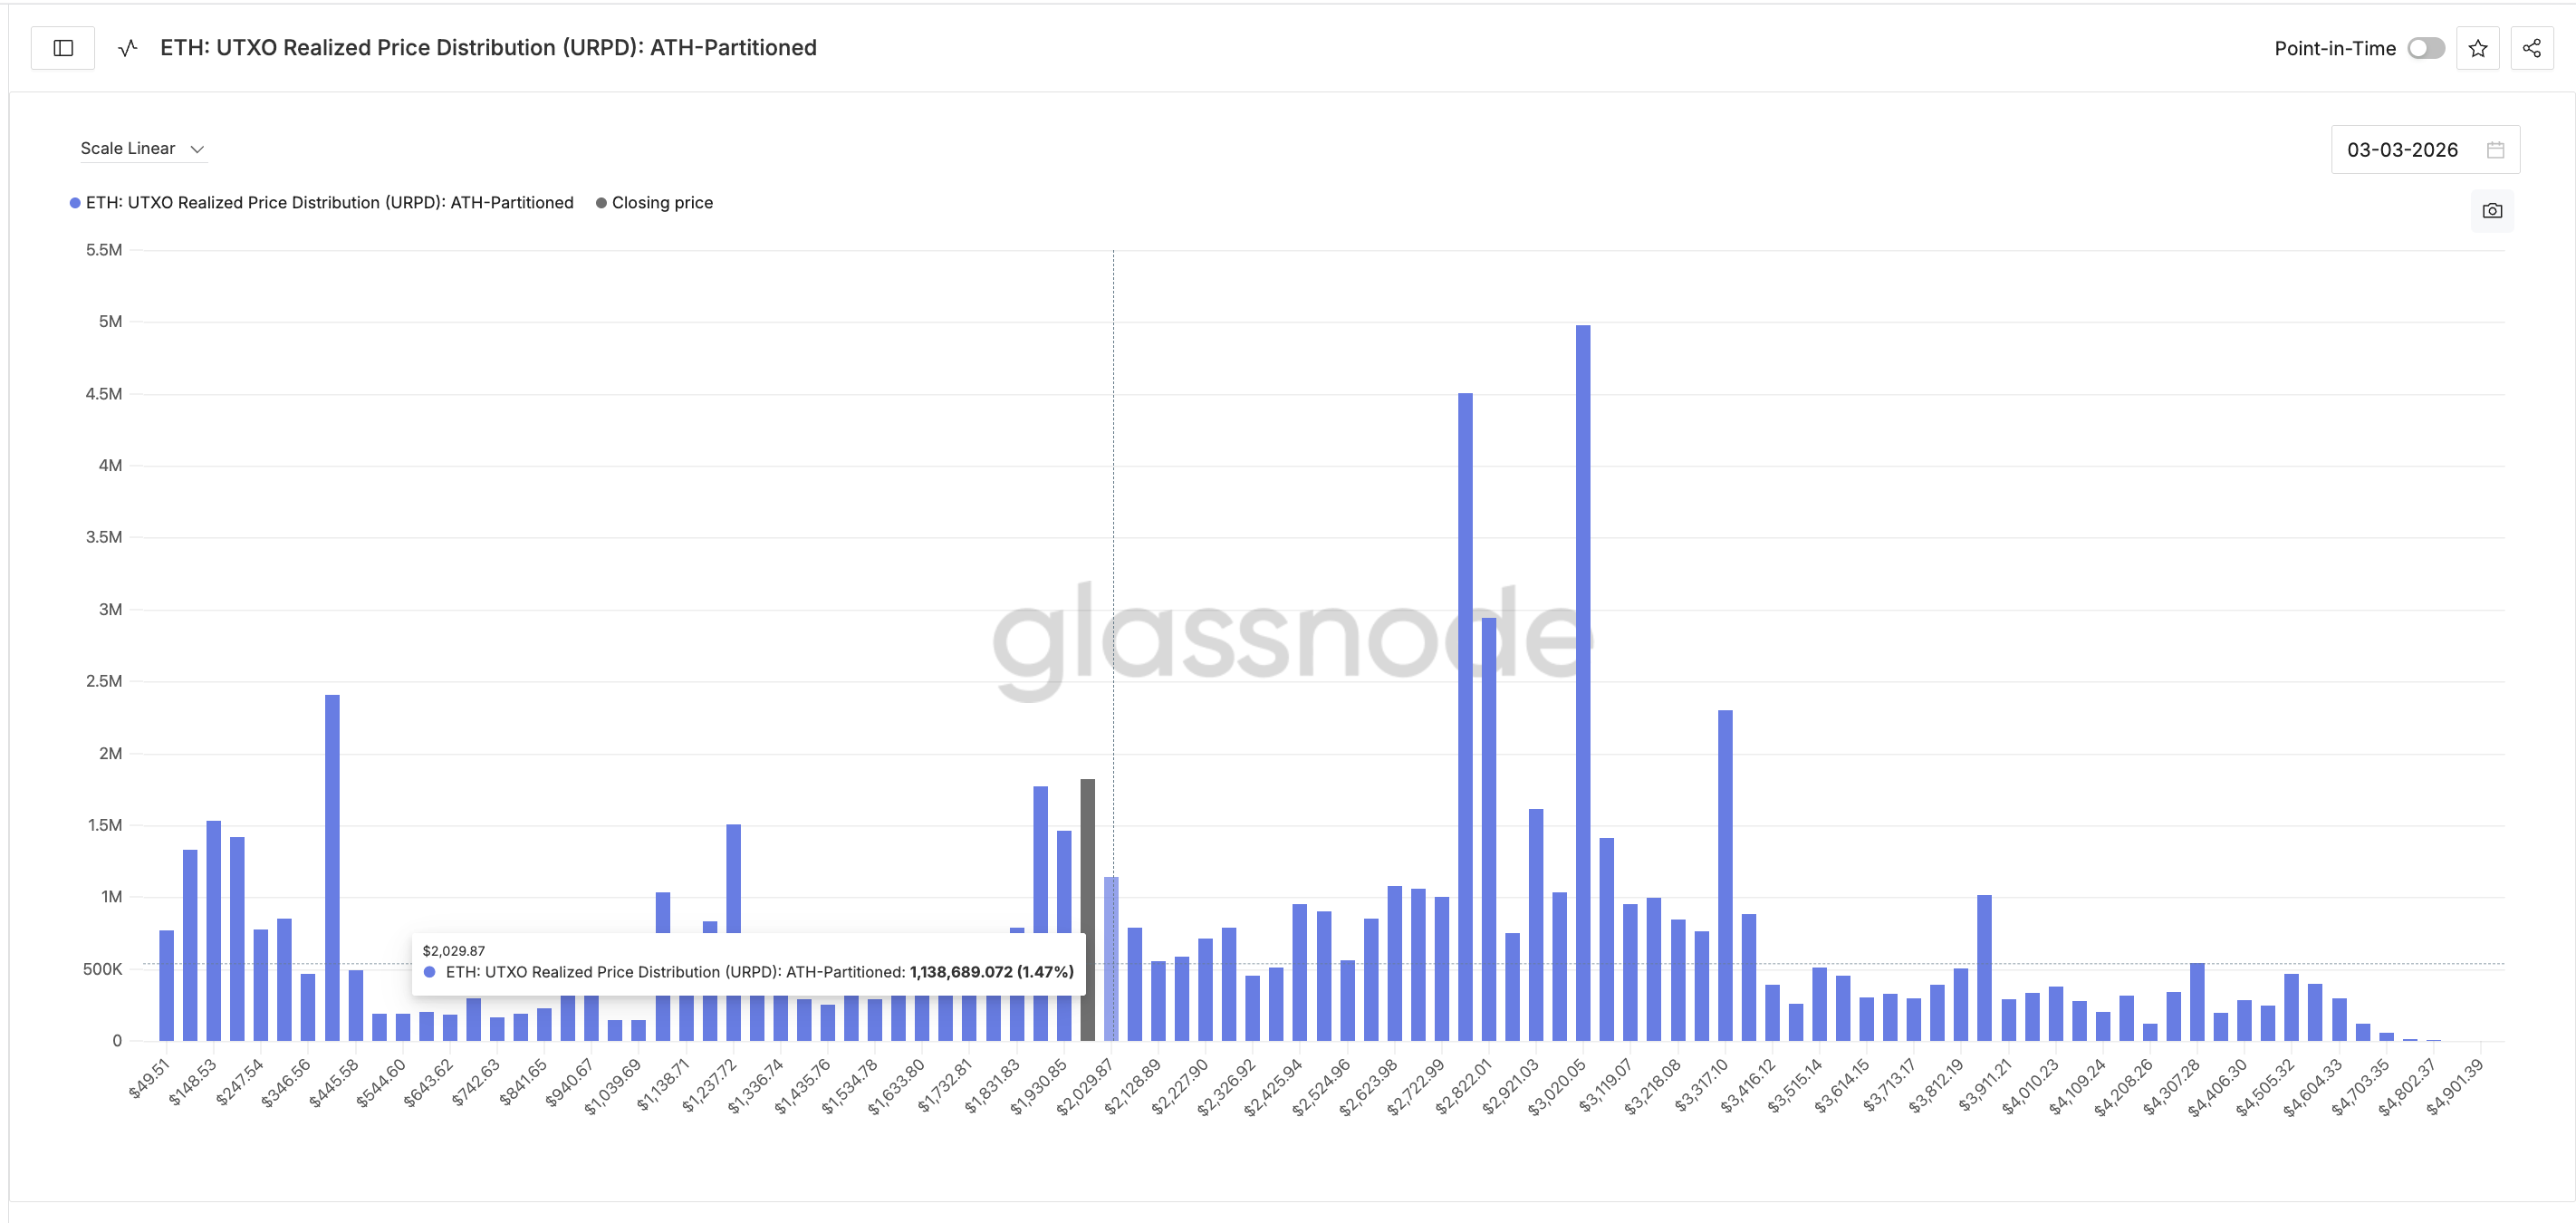
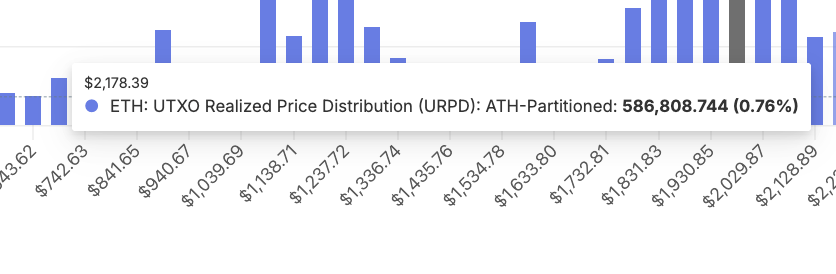
To understand where selling pressure could emerge during a recovery, Glassnode’s UTXO Realized Price Distribution (URPD) helps identify the price levels at which the most ETH supply was last transacted. While traditionally a UTXO-based metric, Glassnode applies it in a generalized form for account-based networks like Ethereum.
[ETH URPD: Glassnode]
The first significant cluster sits near $2,020. This comprises approximately 1.47% of the total ETH supply. This concentration of supply means a large number of holders acquired ETH around this level. On any recovery attempt, these holders may look to exit near breakeven, creating a wall of potential selling pressure.
Above that, a heavier zone forms between $2,120 and $2,170. The $2,120 level holds 0.72% of supply, while $2,170 holds 0.76% — a combined 1.5% of all ETH.
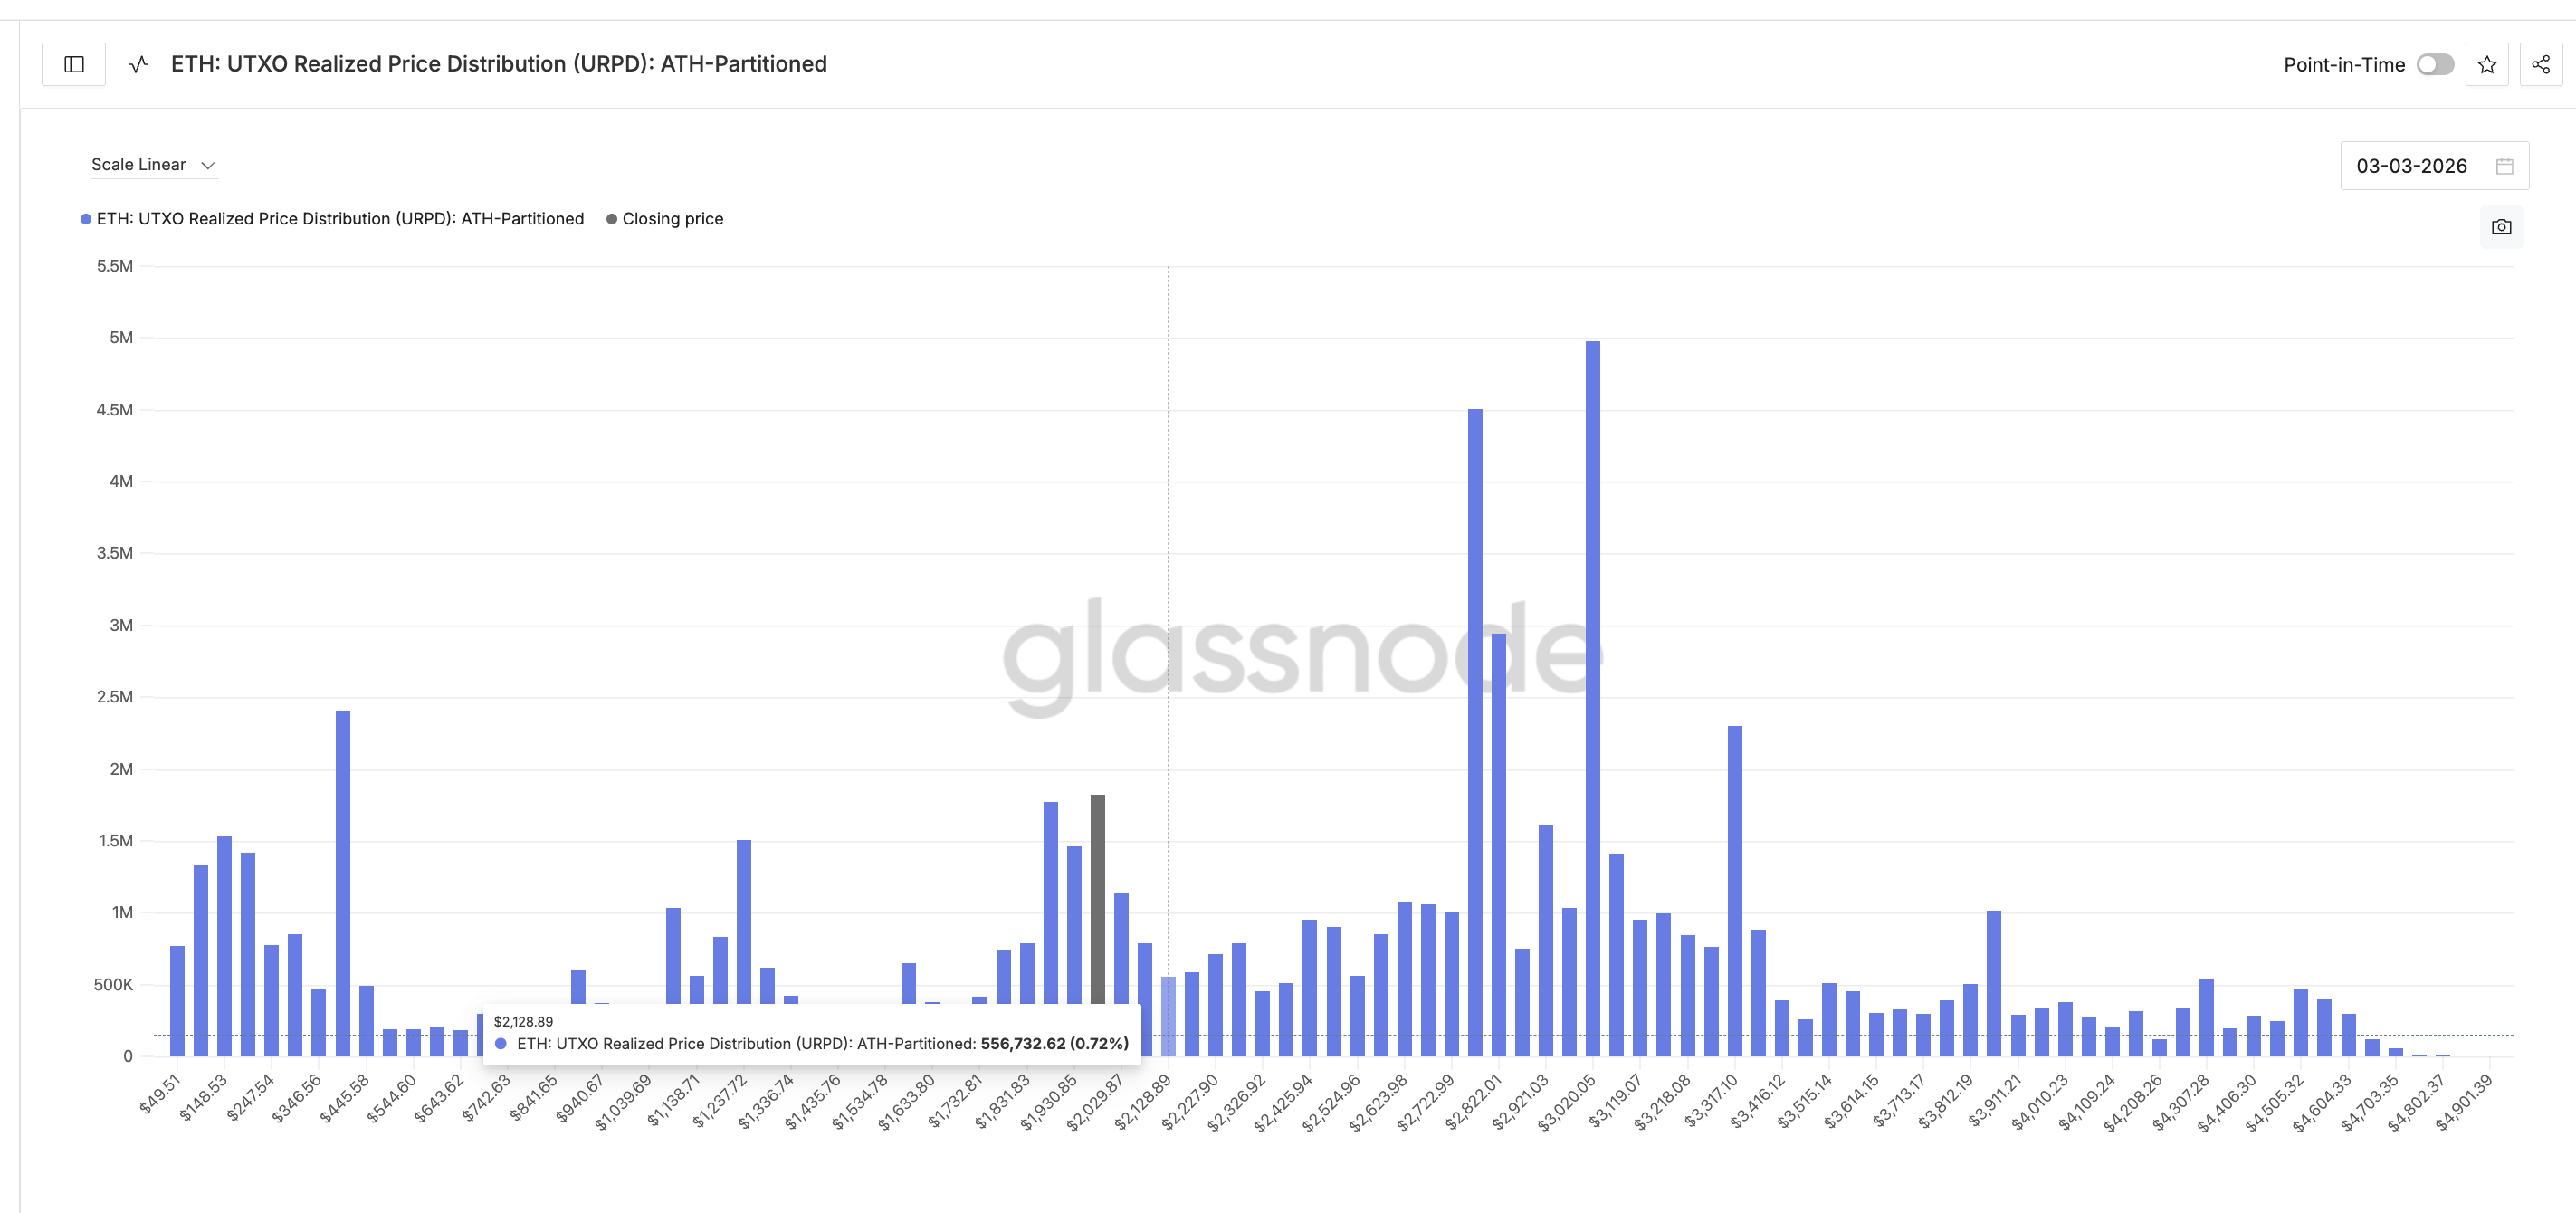
This makes it one of the densest resistance clusters near the current price, and the zone where conviction gets truly tested.
Want more token insights like this? Sign up for Editor Harsh Notariya’s Daily Crypto Newsletter here.
However, if the Ethereum price manages daily closes above these clusters without rejection, it would signal something important. It would mean that these holders are choosing to hold rather than sell, reflecting growing conviction. And that conviction could be fueled by the very ETF inflows that are now turning positive, giving holders a reason to stay patient rather than exit at breakeven.
This is where the URPD clusters connect directly with the price chart.
Ethereum Price Levels Connect The ETF Clue With The Chart
The Fibonacci levels drawn from the February 5 swing give structure to the recovery path. This Fib path still relies on the bearish bias, focusing on the downward impulse wave and the subsequent bounce. More so, as the broader trend for ETH is still bearish, down almost 13%, month-on-month.
The levels now map almost directly onto the URPD clusters.
The first barrier sits at the $2,040 zone. On the Fibonacci chart, $2,040 marks the 0.236 level. On the URPD, $2,020 is the 1.47% supply cluster. These two levels are practically adjacent, making this the first real test. A daily close above $2,040 would mean the $2,020 supply cluster has held rather than been sold — a sign of strengthening conviction.
If that clears, the next target is $2,140. On the URPD, it sits right inside the $2,120–$2,170 resistance zone where a combined 1.5% of the ETH supply sits. And critically, a move to $2,140 from the February 20 ETF flip level of $1,970 represents almost a 10% gain. This matches the historical average when Ethereum ETF flows turn from red to green.
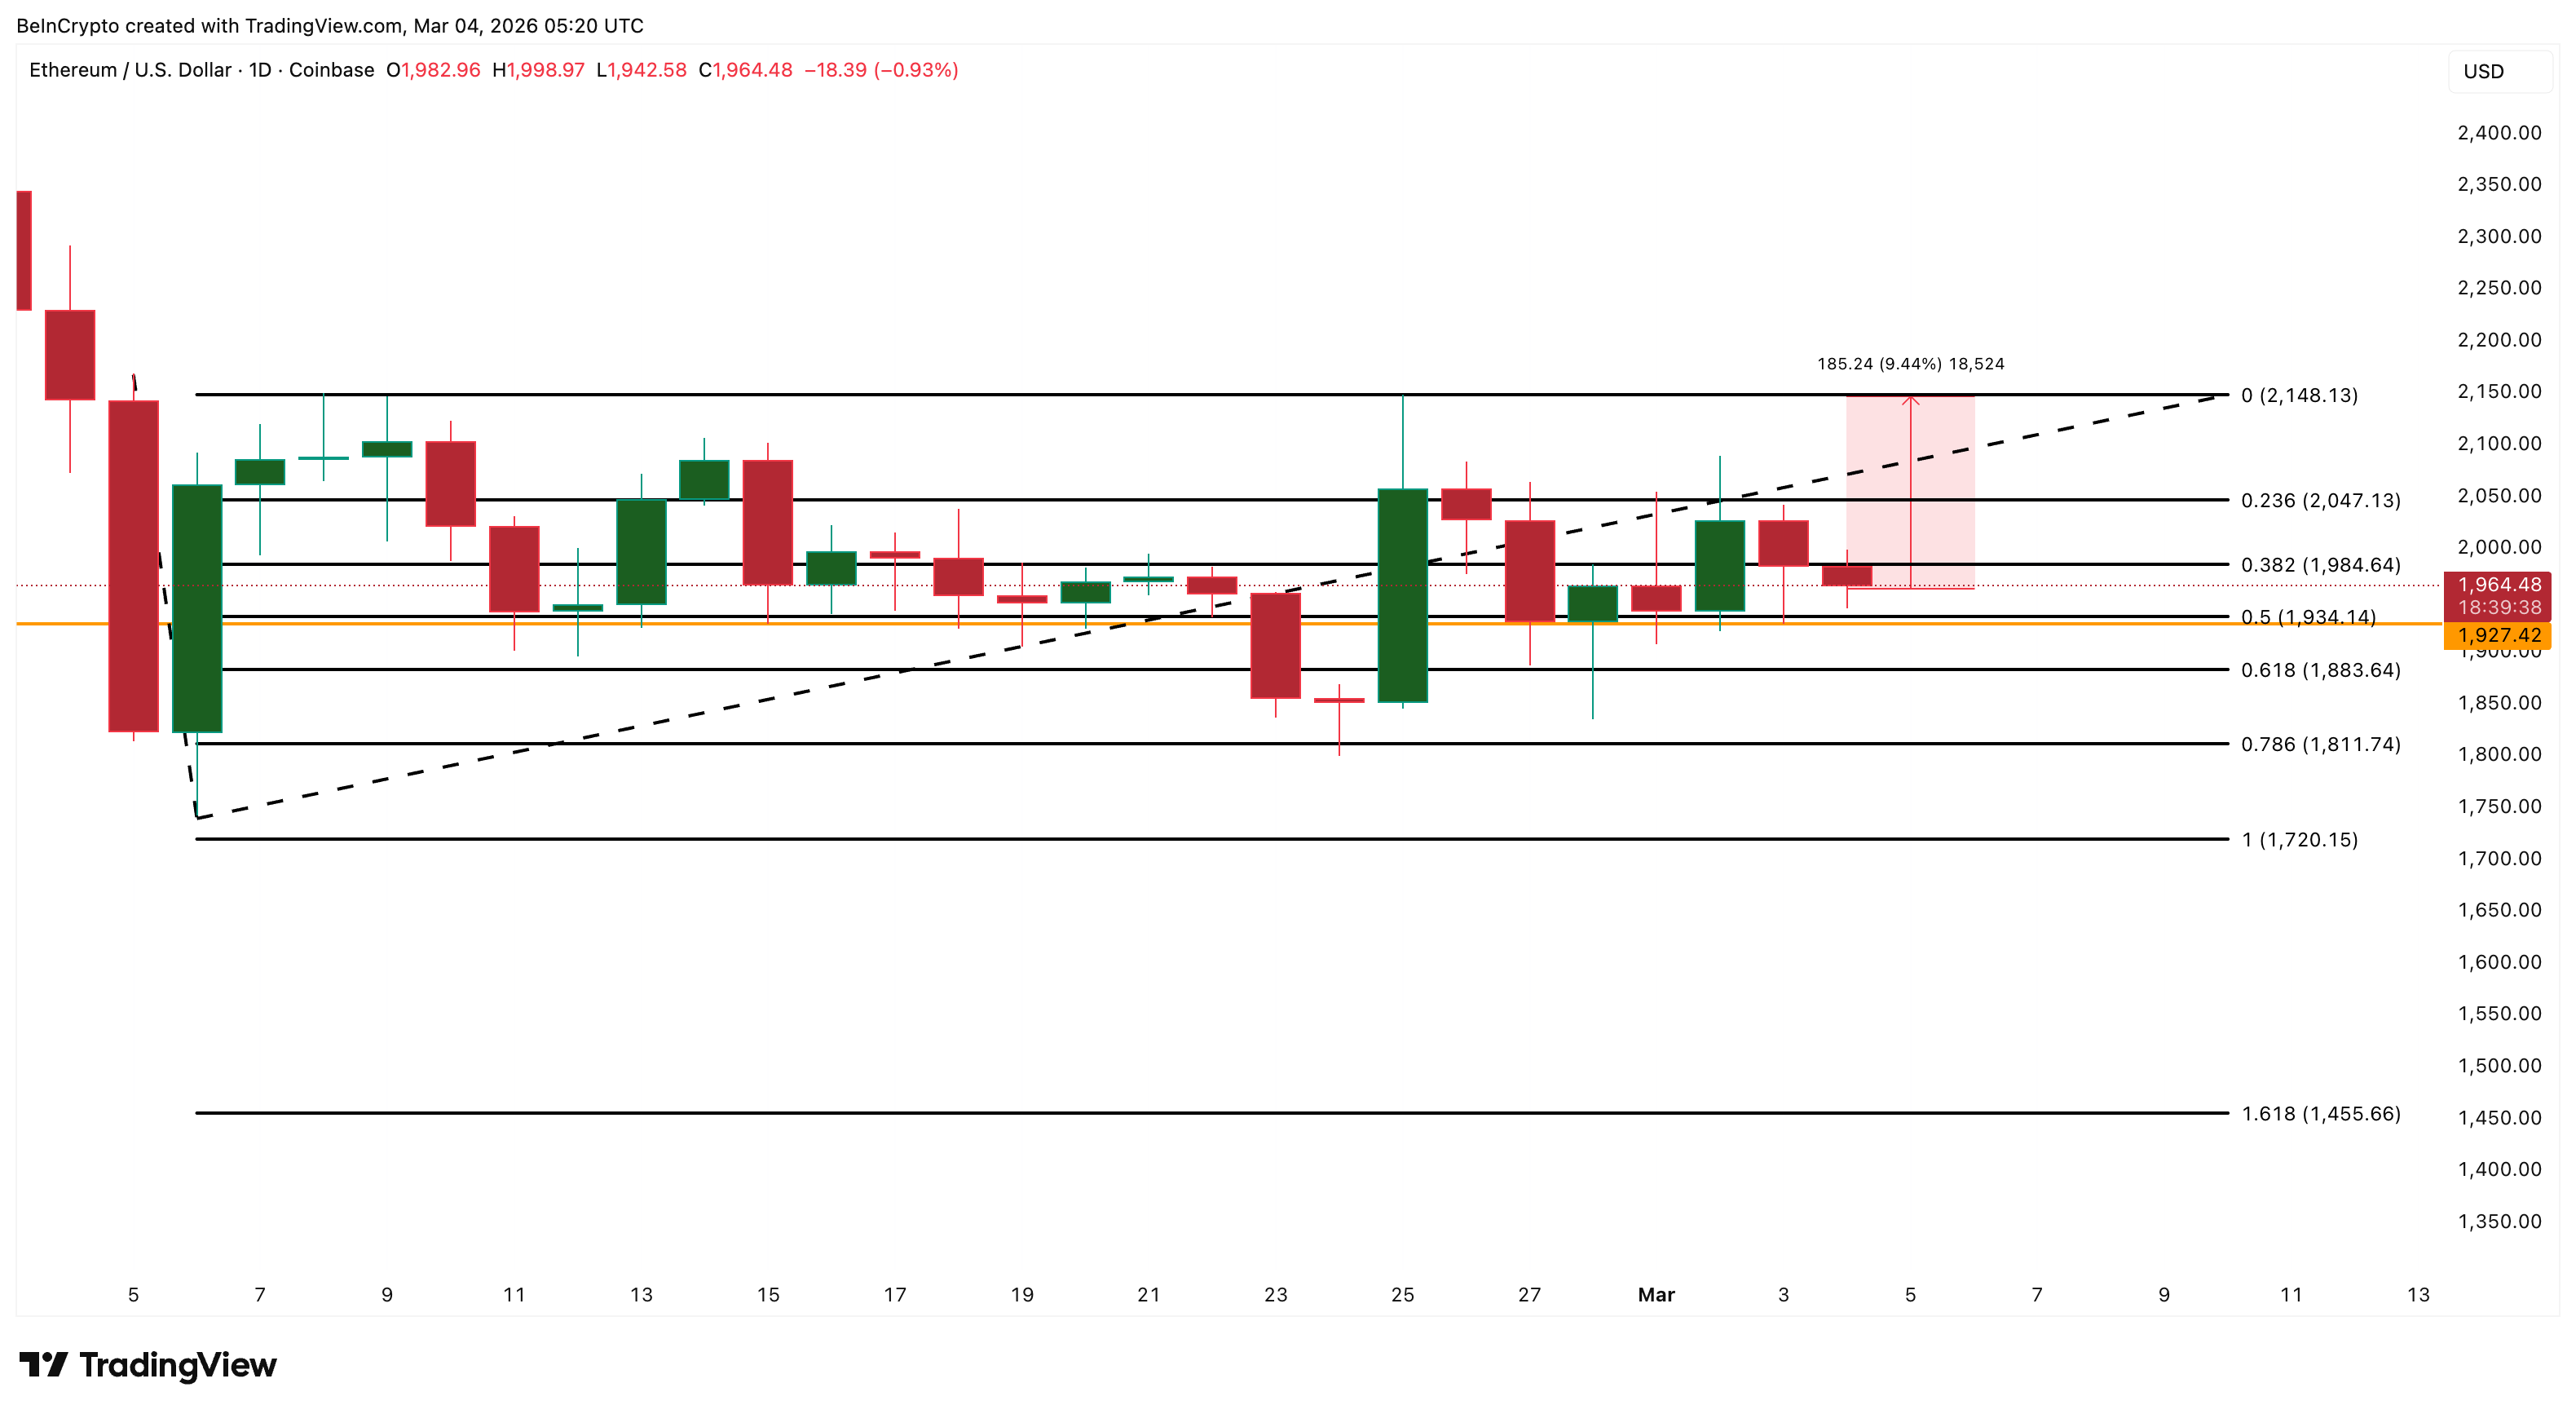
That triple convergence: Fibonacci, URPD cluster, and ETF precedent, makes $2,140 the level where the clue hidden in ETF tries its luck.
On the downside, $1,930 (0.5 Fib) is the nearest support. Below that, $1,920 is the swing low — a break weakens the immediate RSI rebound case, though the broader divergence structure stays intact. A drop under $1,810 (0.786 Fib) would invalidate the divergence entirely and expose $1,720, with $1,460 as the deeper Fibonacci extension.
The post Ethereum ETF Flows Hide Clues To A 10% Price Recovery appeared first on BeInCrypto.
Read moreLatest News