
Ethereum at Crossroads: Will $4,500 Liquidity Pull Win Over $4,200 Risk?
Leading altcoin Ethereum has been locked in a horizontal channel since August 12. Its price has oscillated between resistance at $4,664 and support at $4,211, with traders awaiting a decisive breakout.
Now, with a liquidity cluster building above its current price and futures traders increasingly positioning for upside, ETH appears poised for a potential breakout in the near term.
ETH Bulls Circle $4,500
According to Coinglass, ETH’s liquidation heatmap shows a concentration of liquidity at the $4,520 price zone. For context, the altcoin currently trades at $4,385.
For token TA and market updates: Want more token insights like this? Sign up for Editor Harsh Notariya’s Daily Crypto Newsletter here.
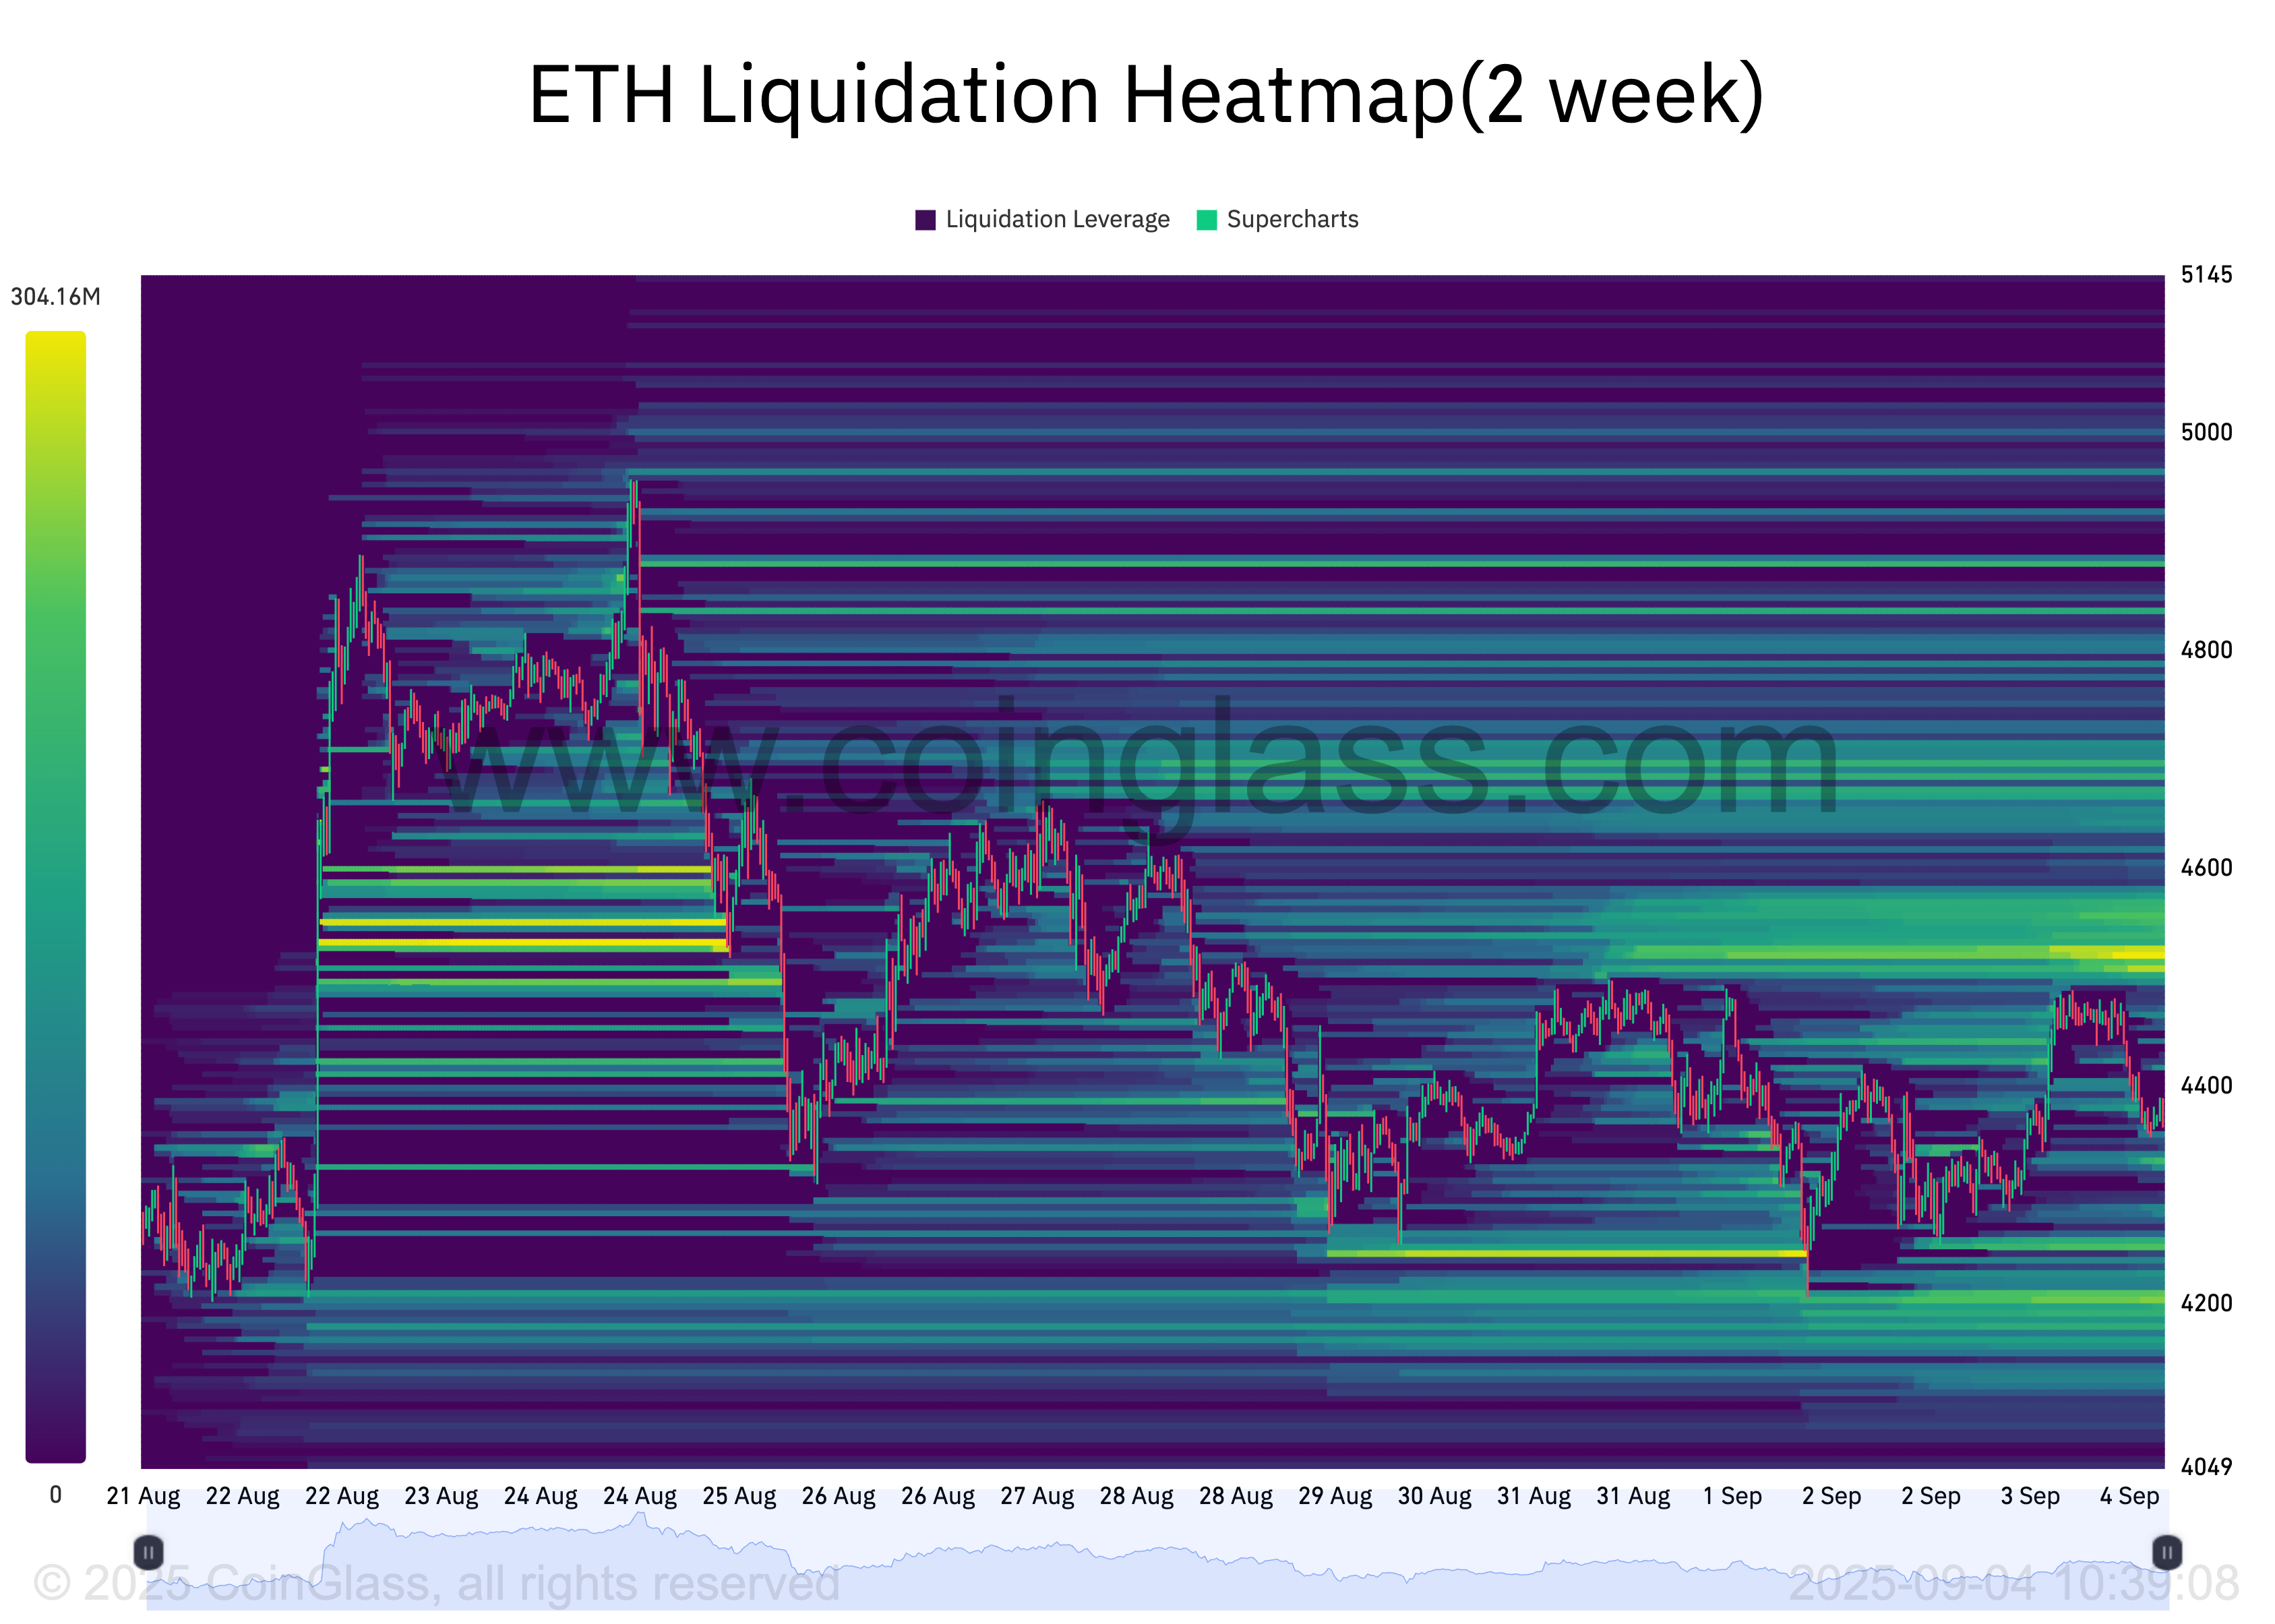
Liquidation heatmaps are visual tools traders use to identify price levels where large clusters of leveraged positions are likely to be liquidated. These maps highlight areas of high liquidity, often color-coded to show intensity, with brighter zones representing larger liquidation potential.
Usually, these price zones act as magnets for price action, as the market tends to move toward these areas to trigger liquidations and open fresh positions.
Therefore, for ETH, the cluster of liquidity around the $4,500 price zone signals that its price could be drawn upward toward this level in the short term.
Moreover, Coinglass data shows a rise in ETH’s long/short ratio, indicating a stronger bullish tilt in sentiment among futures traders. At press time, this stands at 1.01.
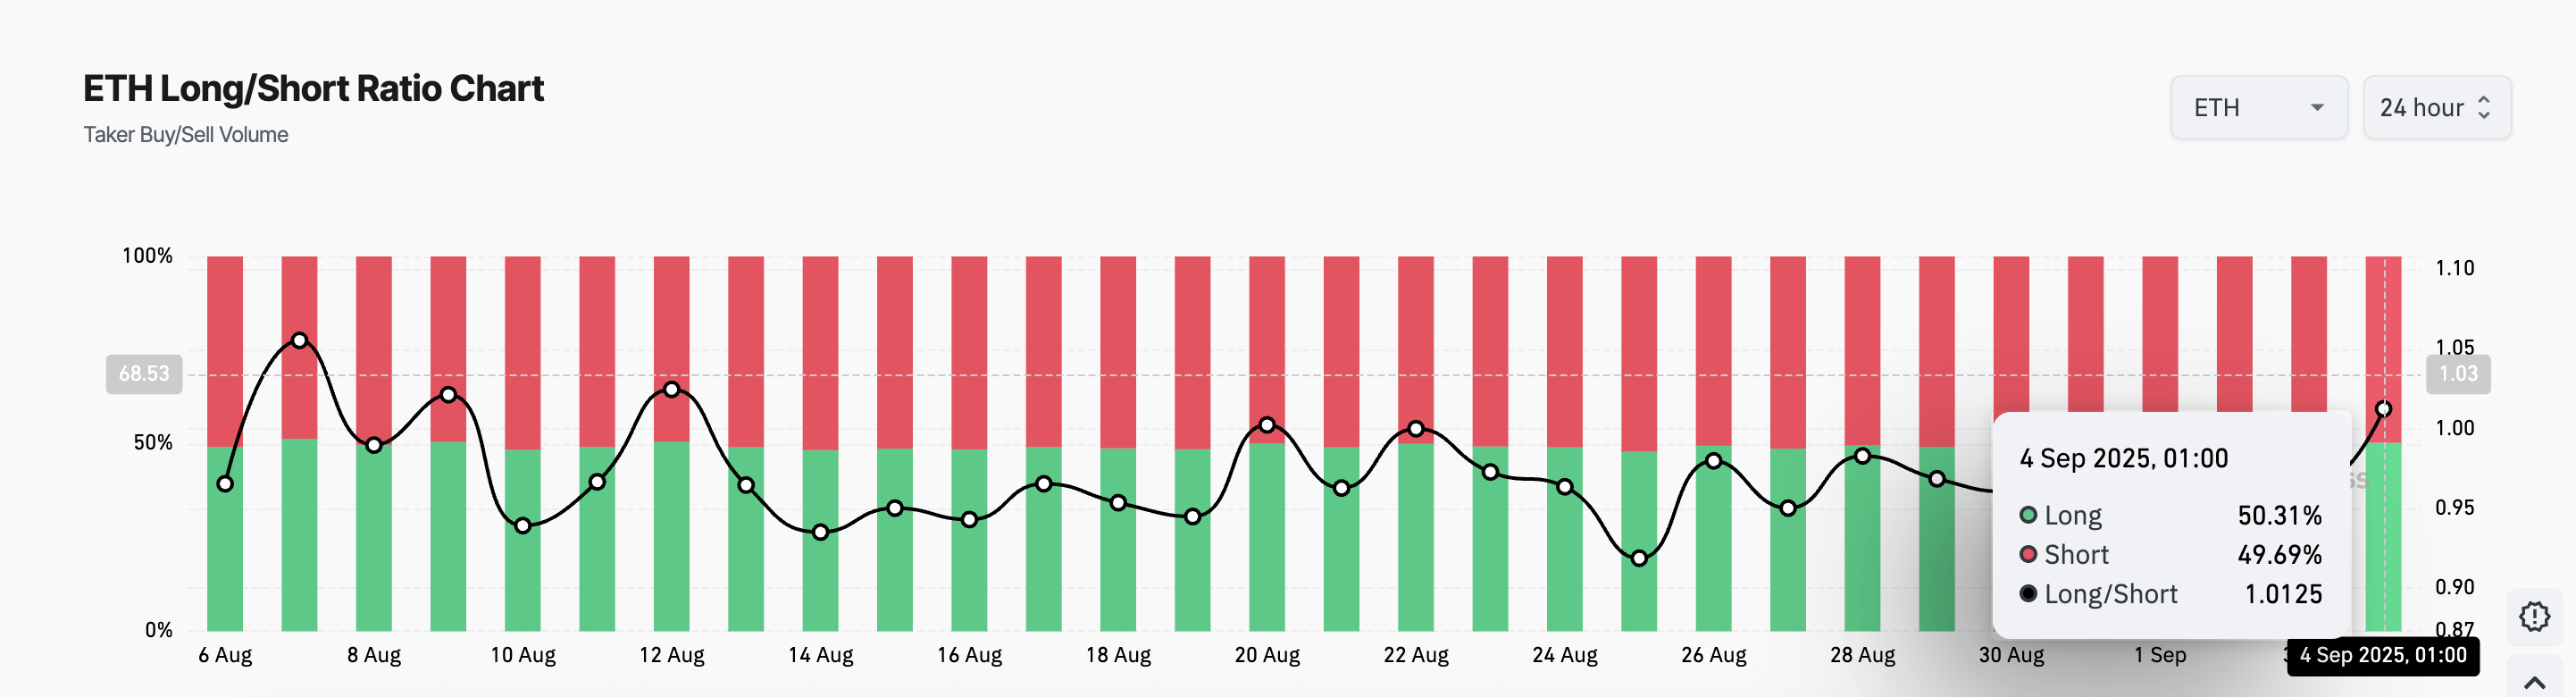
The long/short ratio measures the balance between traders holding bullish (long) and bearish (short) positions in the futures market. A reading above 1 suggests that more traders are betting on price increases, while a value below 1 indicates a stronger presence of bearish bets.
With ETH’s ratio currently at 1.01, the market shows a slight but notable lean toward bullish expectations. This further confirms the case for a potential upward move.
All-Time High in Sight if Bulls Win This Battle
If bullish momentum persists, ETH could break above the upper line of the horizontal channel, which forms resistance at $4,664. A breach of this level could cause the coin to revisit its all-time high of $4,957.
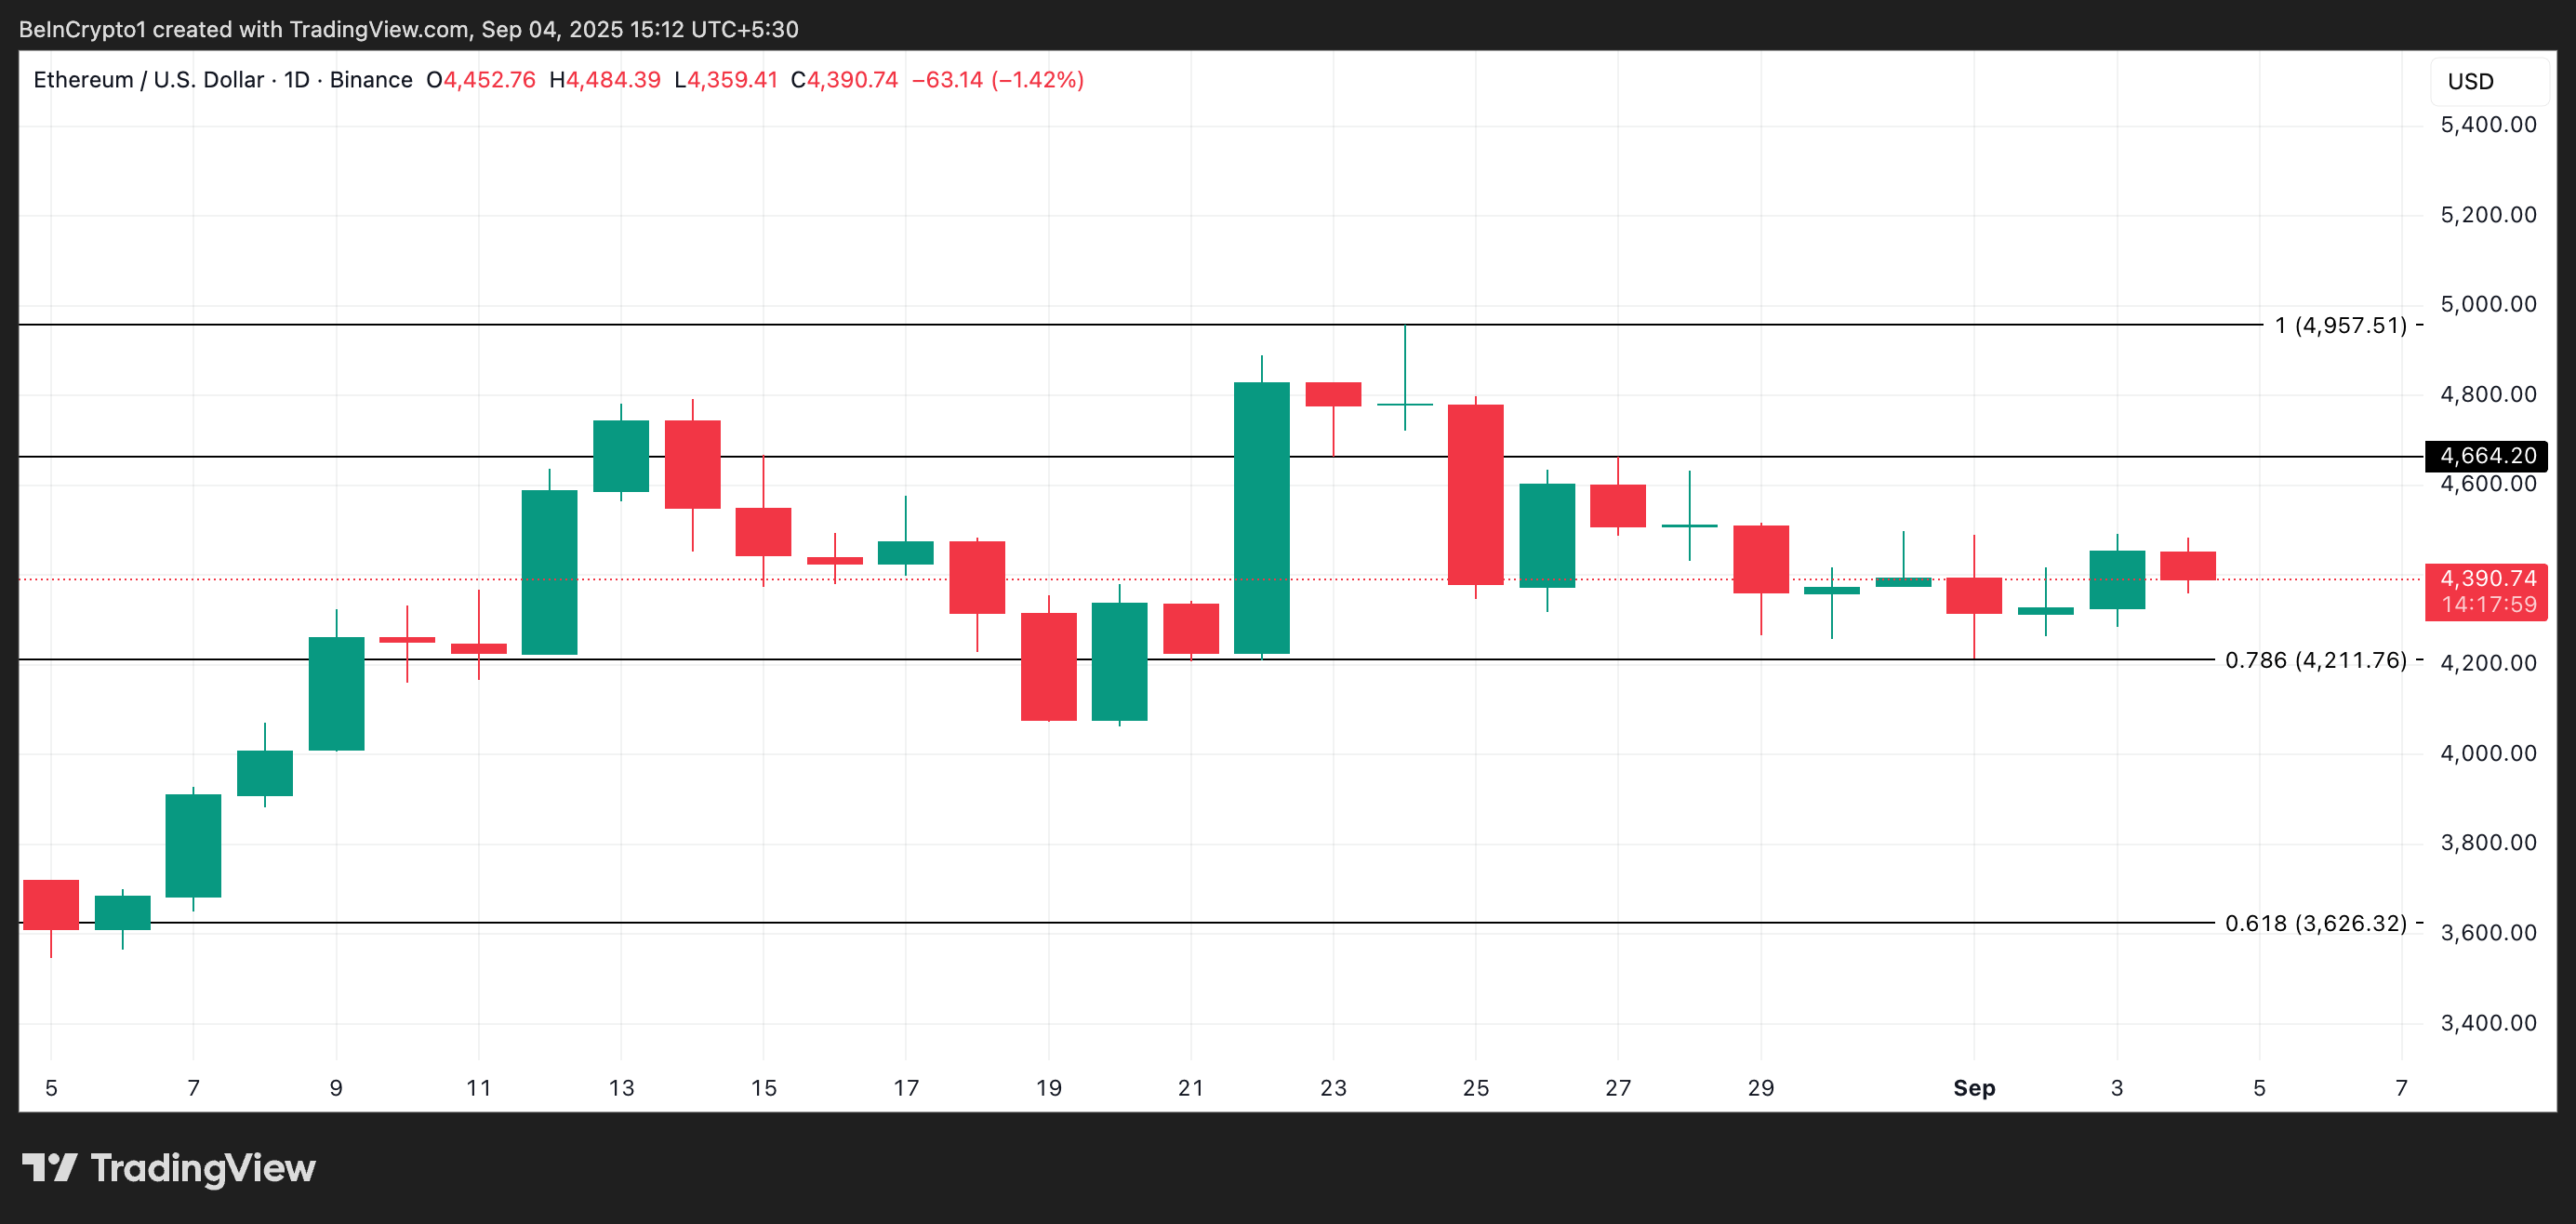
On the other hand, if demand falls and ETH falls below support at $4,211, it could decline further to $3,626.
The post Ethereum at Crossroads: Will $4,500 Liquidity Pull Win Over $4,200 Risk? appeared first on BeInCrypto.
Read moreLatest News