
Chiliz Eyes $0.05 as On-Chain Data and Parallel Channel Confirm Bullish Setup
Chiliz (CHZ) surged 14.7% in the past 24 hours on April 16, trading at $0.0429 with a market cap of $441.9 million, as a convergence of technical and on-chain signals suggests a renewed push toward the $0.050 resistance zone.
Price broke above both the 20 and 50-period daily moving averages for the first time since the January 2026 fakeout. On-chain data shows exchange inflows near six-month lows, reinforcing the case for organic demand.
Daily Structure Points to a Breakout Attempt
CHZ has been building a base since February 2025, forming two distinct zones that have repeatedly absorbed selling pressure. The deeper support sits between $0.028 and $0.030. A secondary zone between $0.036 and $0.038 held on four separate occasions since mid-2025, with each rebound marked by green arrows on the chart.
On the resistance side, the $0.050 to $0.052 band has rejected CHZ at least three times over the same period (red arrows). In January 2026, the price temporarily pushed into the $0.062 to $0.064 region. That move failed quickly and price pulled back sharply through both resistance levels, resetting conditions for a more measured attempt.
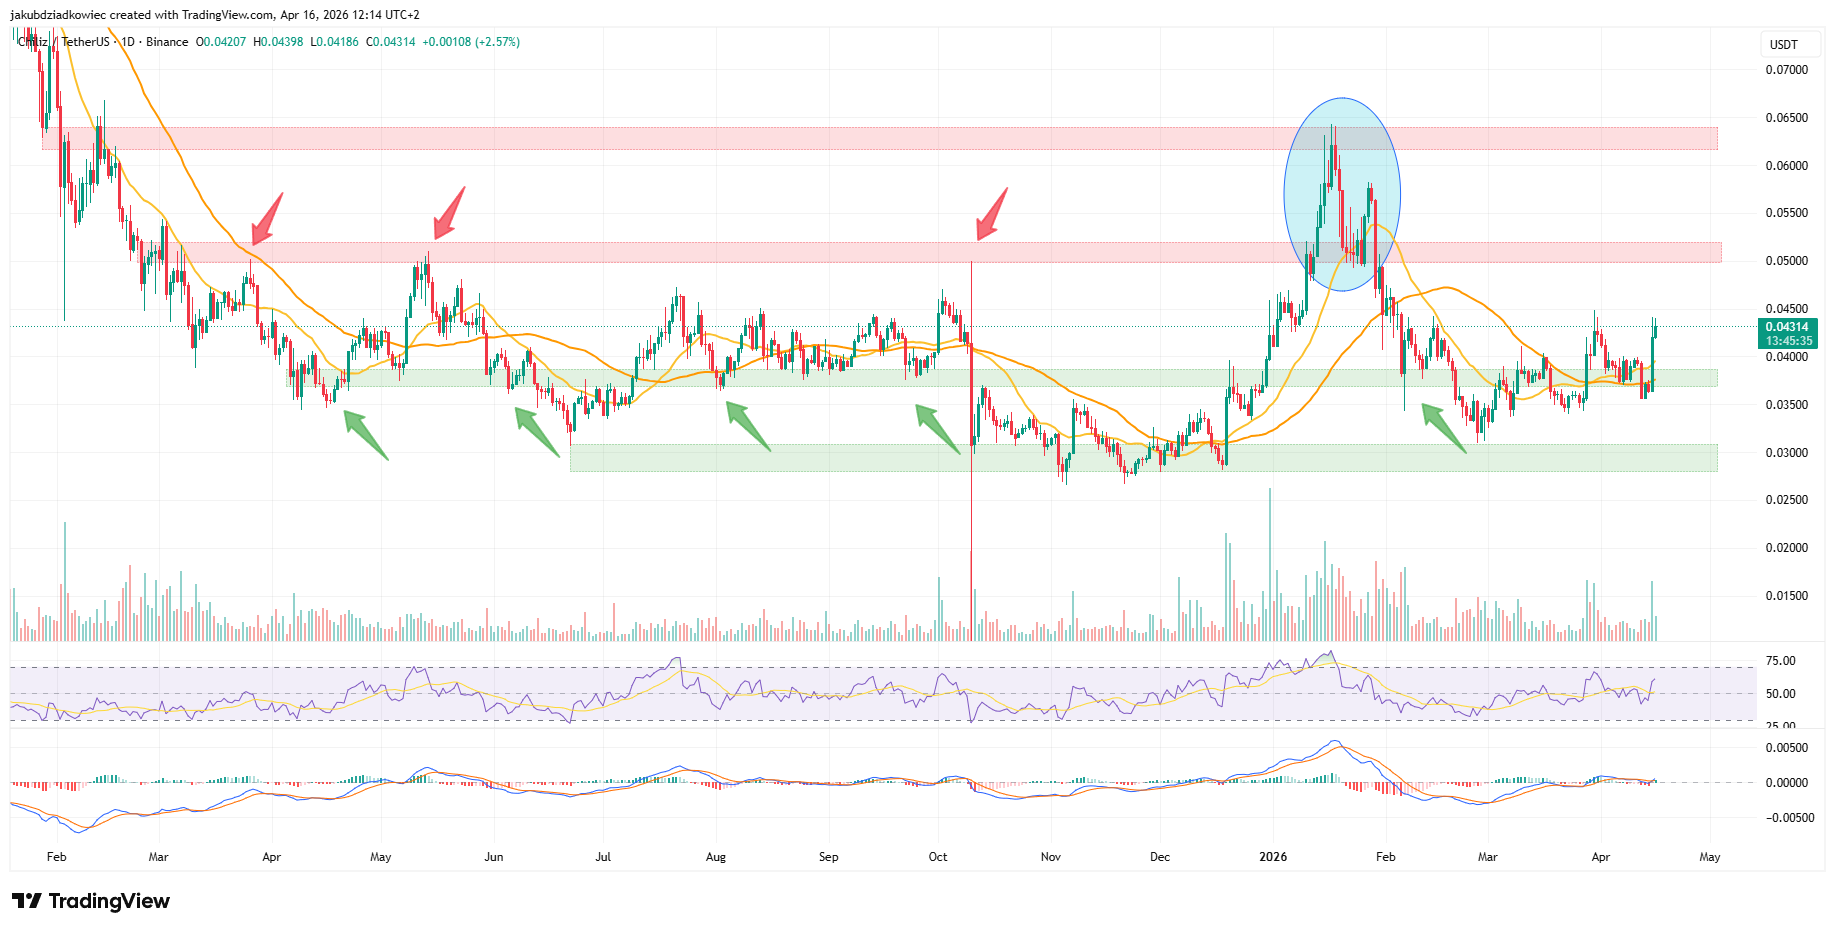
The April 16 daily candle closed at $0.04314, above both moving averages for the first time since the January peak (blue ellipse). Volume registered a notable spike alongside the close, ending a prolonged downtrend in trading activity.
The RSI is rising from neutral territory and has not yet reached overbought levels. The MACD histogram has turned positive, indicating that bullish momentum is accelerating on the daily timeframe.
Prior analysis of CHZ highlighted the difficulty of sustaining closes above these averages, making the current structure notable.
Four-Hour Channel Points to $0.046
The four-hour chart presents a parallel ascending channel dating back to February 19. Price has respected both the upper and lower bands as well as the midline throughout the pattern. Four distinct midline touches (blue circles) confirm its role as a dynamic pivot.
Chiliz is now trading above the midline at $0.04292. The upper band near $0.046 represents the next near-term target. A sustained close above that level would expose the $0.050 zone, which aligns directly with the daily resistance band. CHZ has previously required a confirmed daily close above $0.050 to sustain any move into the higher range.
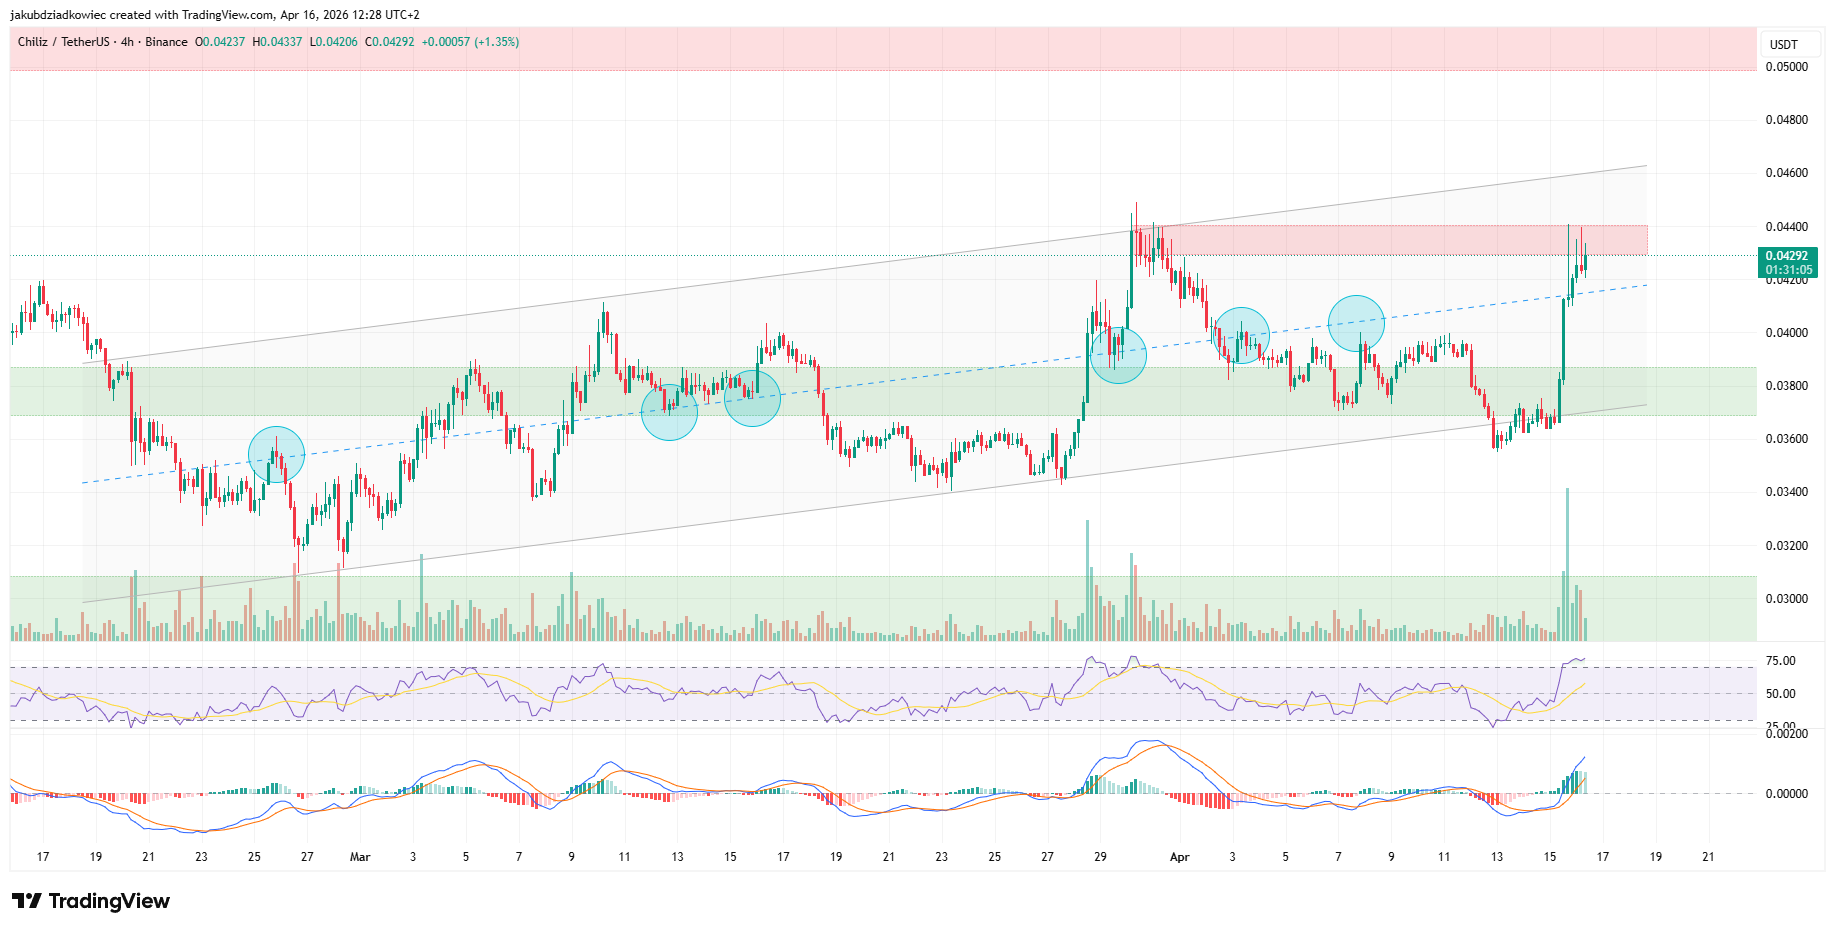
The four-hour RSI has climbed above 70, reflecting strong short-term momentum. The MACD remains positive but is beginning to lose steam, which may produce a brief consolidation before another leg higher.
A pullback toward the $0.036 to $0.038 zone would negate the current structure. There, the channel lower band converges with daily support to form a reinforced floor.
Chiliz Whale Activity and Low Inflow Support the Bullish Case
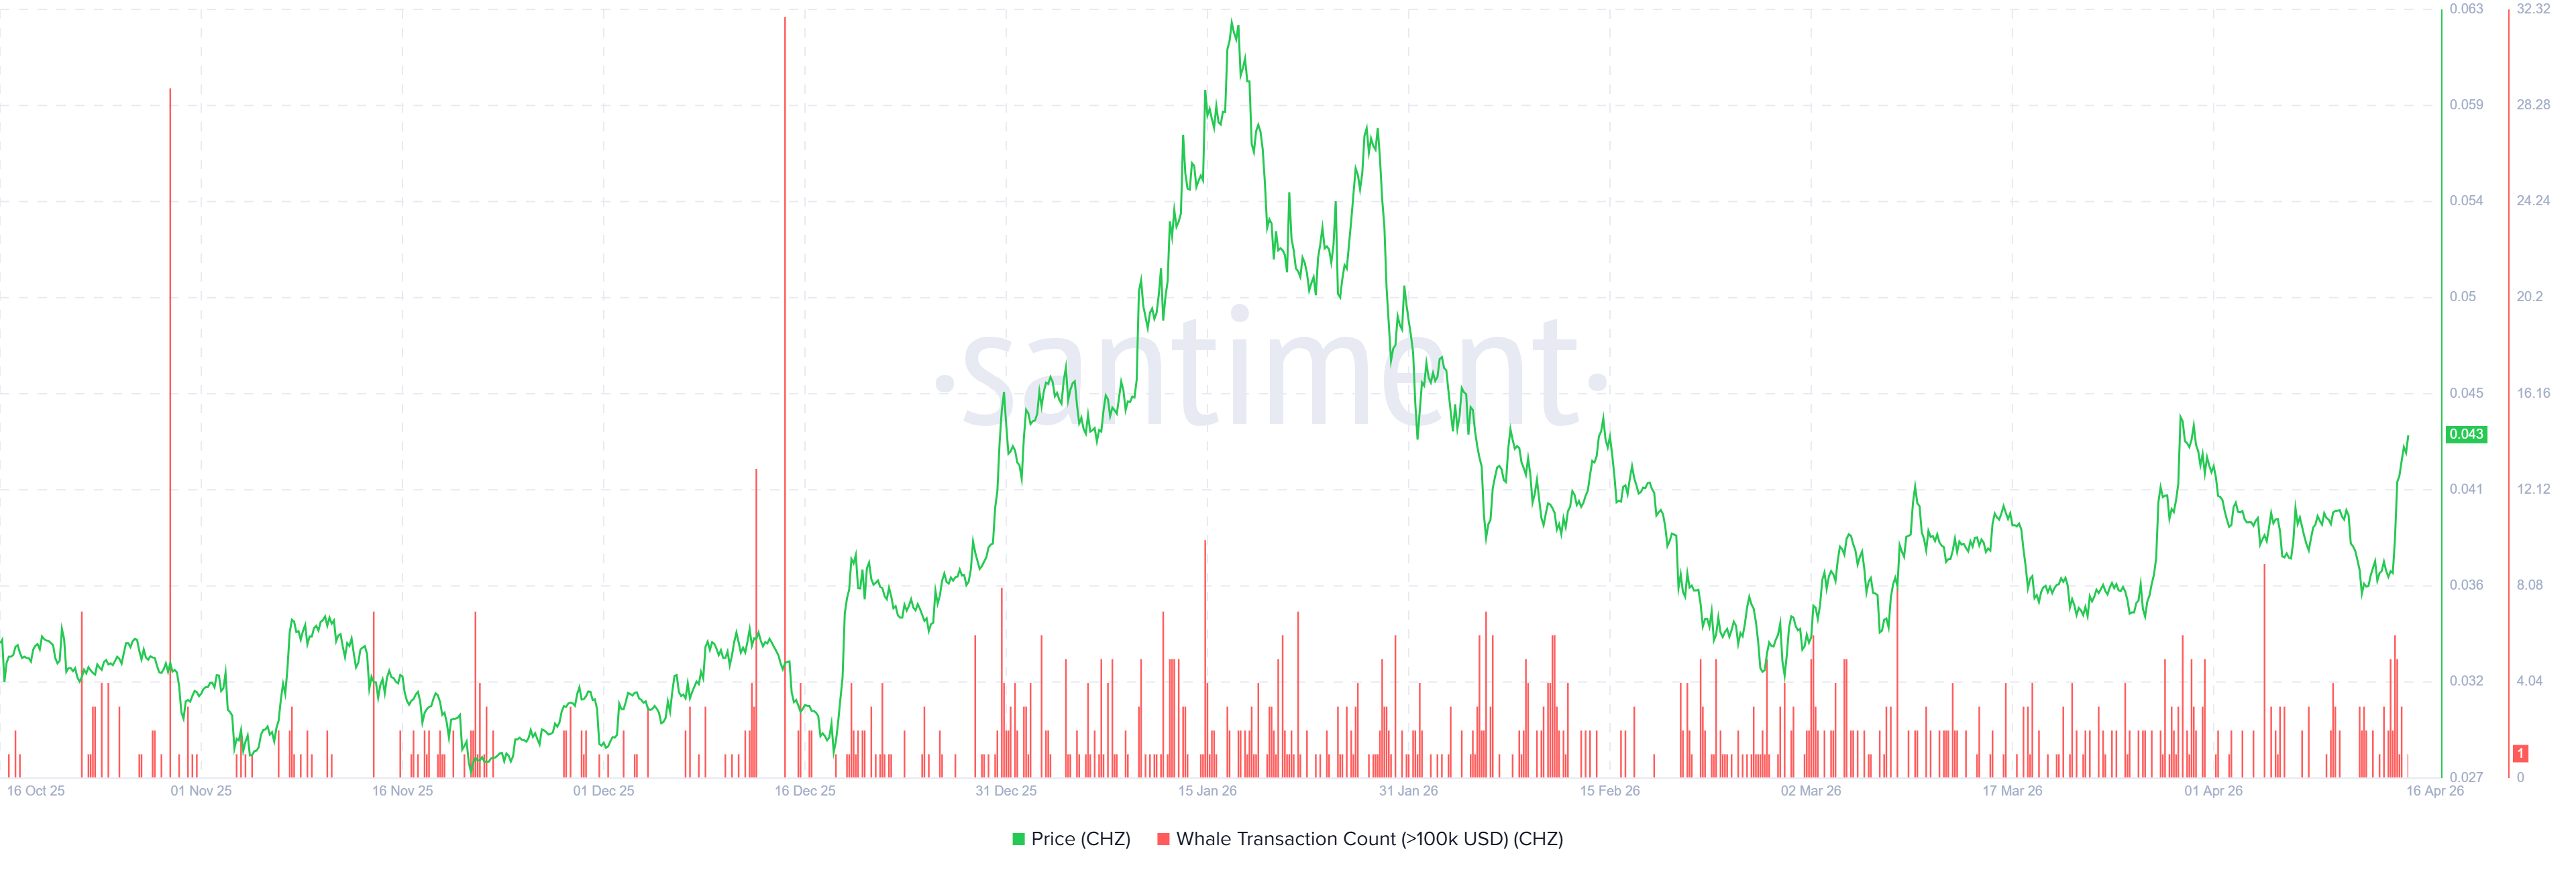
Santiment data shows that whale transaction count for CHZ, tracking transfers above $100,000, registered a modest uptick on April 16. The spike is small relative to the peaks recorded during the January 2026 rally and the December 2025 accumulation phase.
That context is constructive. It suggests large players are cautiously re-entering rather than aggressively positioning, a pattern that has historically preceded sustained moves. Prior rebounds driven by whale accumulation at similar structural support levels were followed by multi-week price advances.
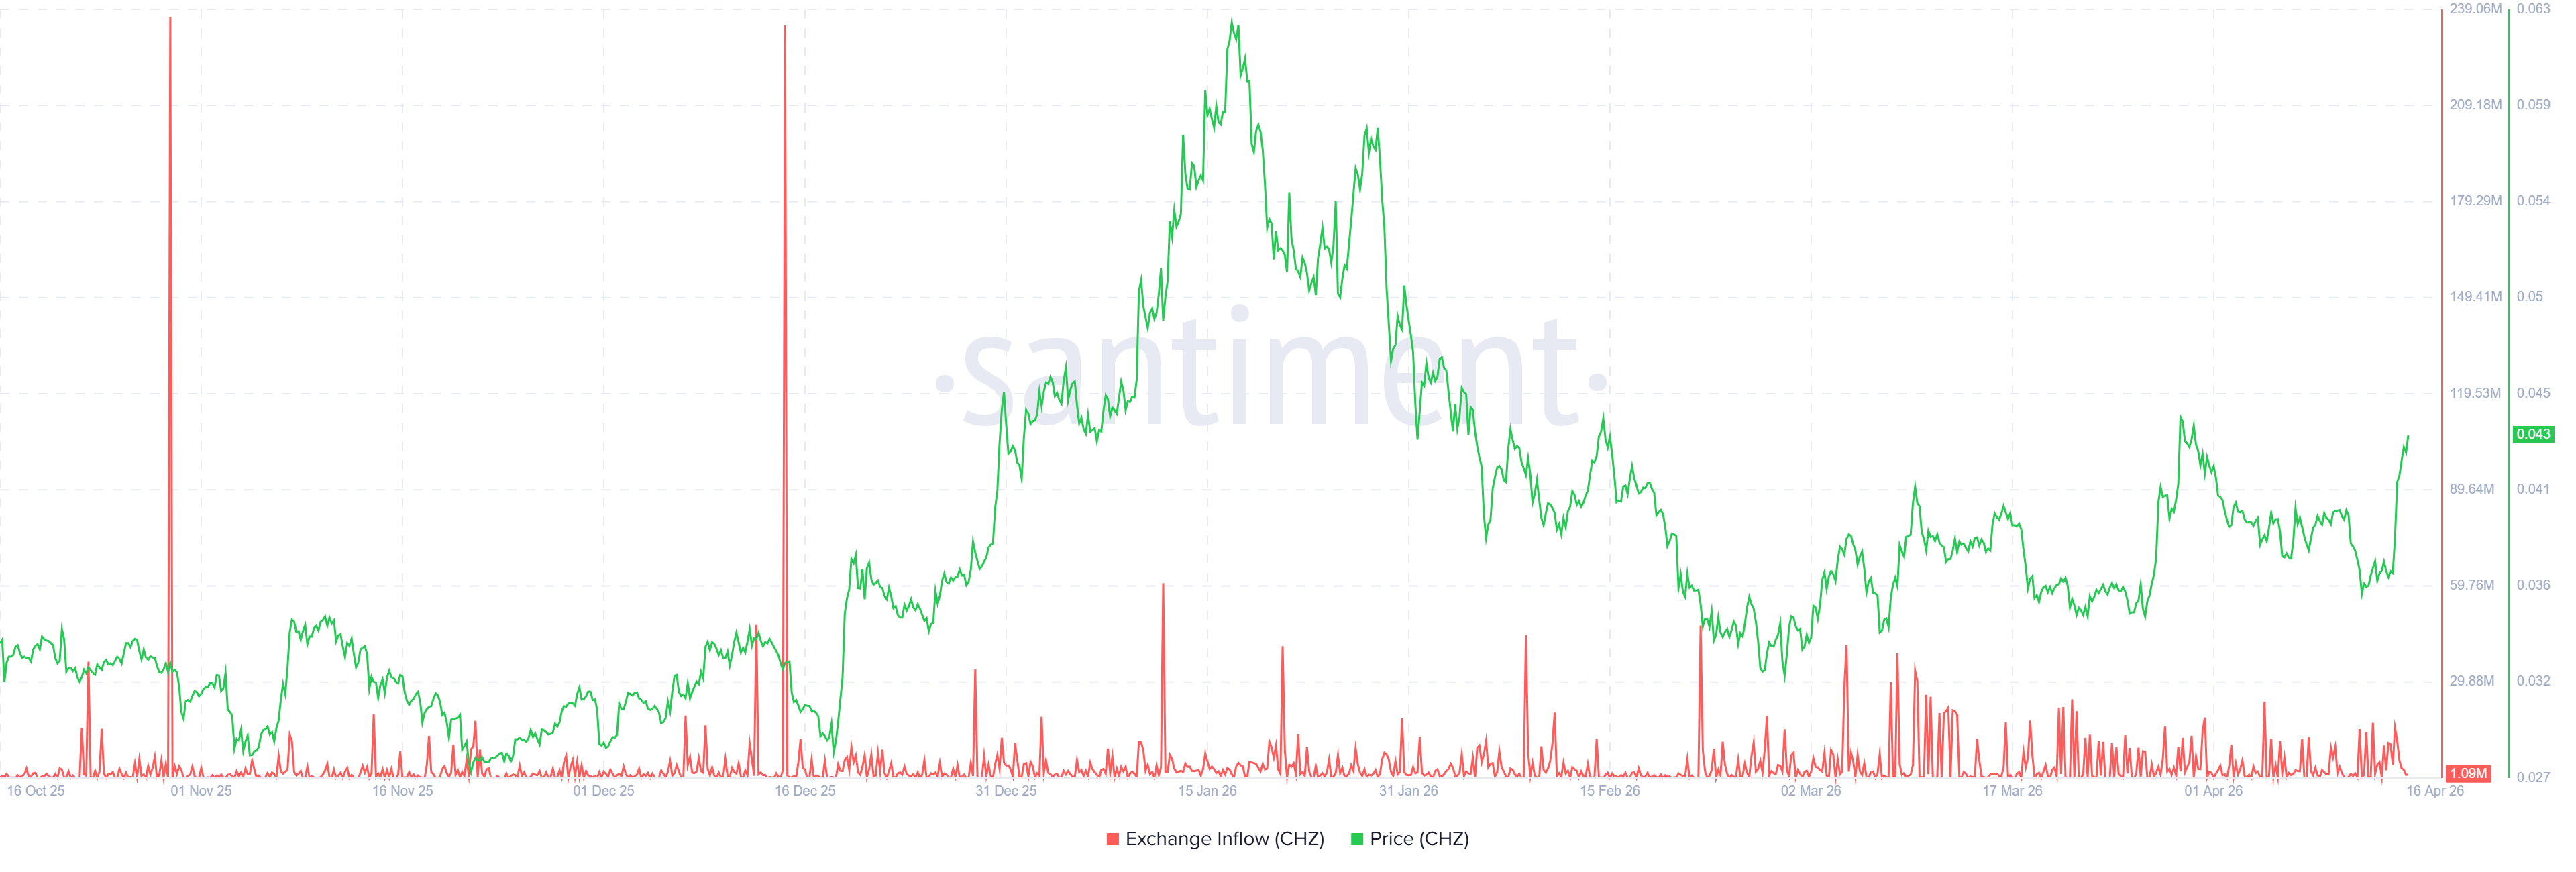
Exchange inflow data reinforces that reading. The current inflow stands at just 1.09 million CHZ, one of the lowest readings over the past six months. For comparison, spikes above 200 million CHZ were recorded in November and December 2025 during periods of heavy distribution.
Low exchange inflow indicates that holders are not moving assets to selling venues. That dynamic is consistent with organic accumulation rather than manufactured price movement, the kind of setup that preceded each of CHZ’s recoveries from the $0.036 to $0.038 support zone over the past year.
Chiliz may extend toward $0.046 in the near term, then test the $0.050 to $0.052 resistance band. A decisive daily close above $0.052 could open the path toward the $0.062 to $0.064 region last visited during the January fakeout.
A failure to hold $0.038 would shift the probability back toward the deeper $0.028 to $0.030 accumulation zone and suggest the current breakout attempt has run out of fuel.
The post Chiliz Eyes $0.05 as On-Chain Data and Parallel Channel Confirm Bullish Setup appeared first on BeInCrypto.
Read moreLatest News