Bitcoin Price Flashed 3 Bullish Hints in a Week and None Delivered a Breakout
Bitcoin (BTC) price trades at $69,192 on April 6 after gaining approximately 4% from a local low on April 5. The bounce is the third in just a week to emerge from the same technical signal on the 8-hour chart.
Each time, the signal has produced a move to the upside. But each time, the rally has stalled below the same zone. The pattern raises a question that on-chain data can answer, and the answer determines whether this attempt ends differently or joins the first two as another failed breakout.
Three Cues, Same Ceiling
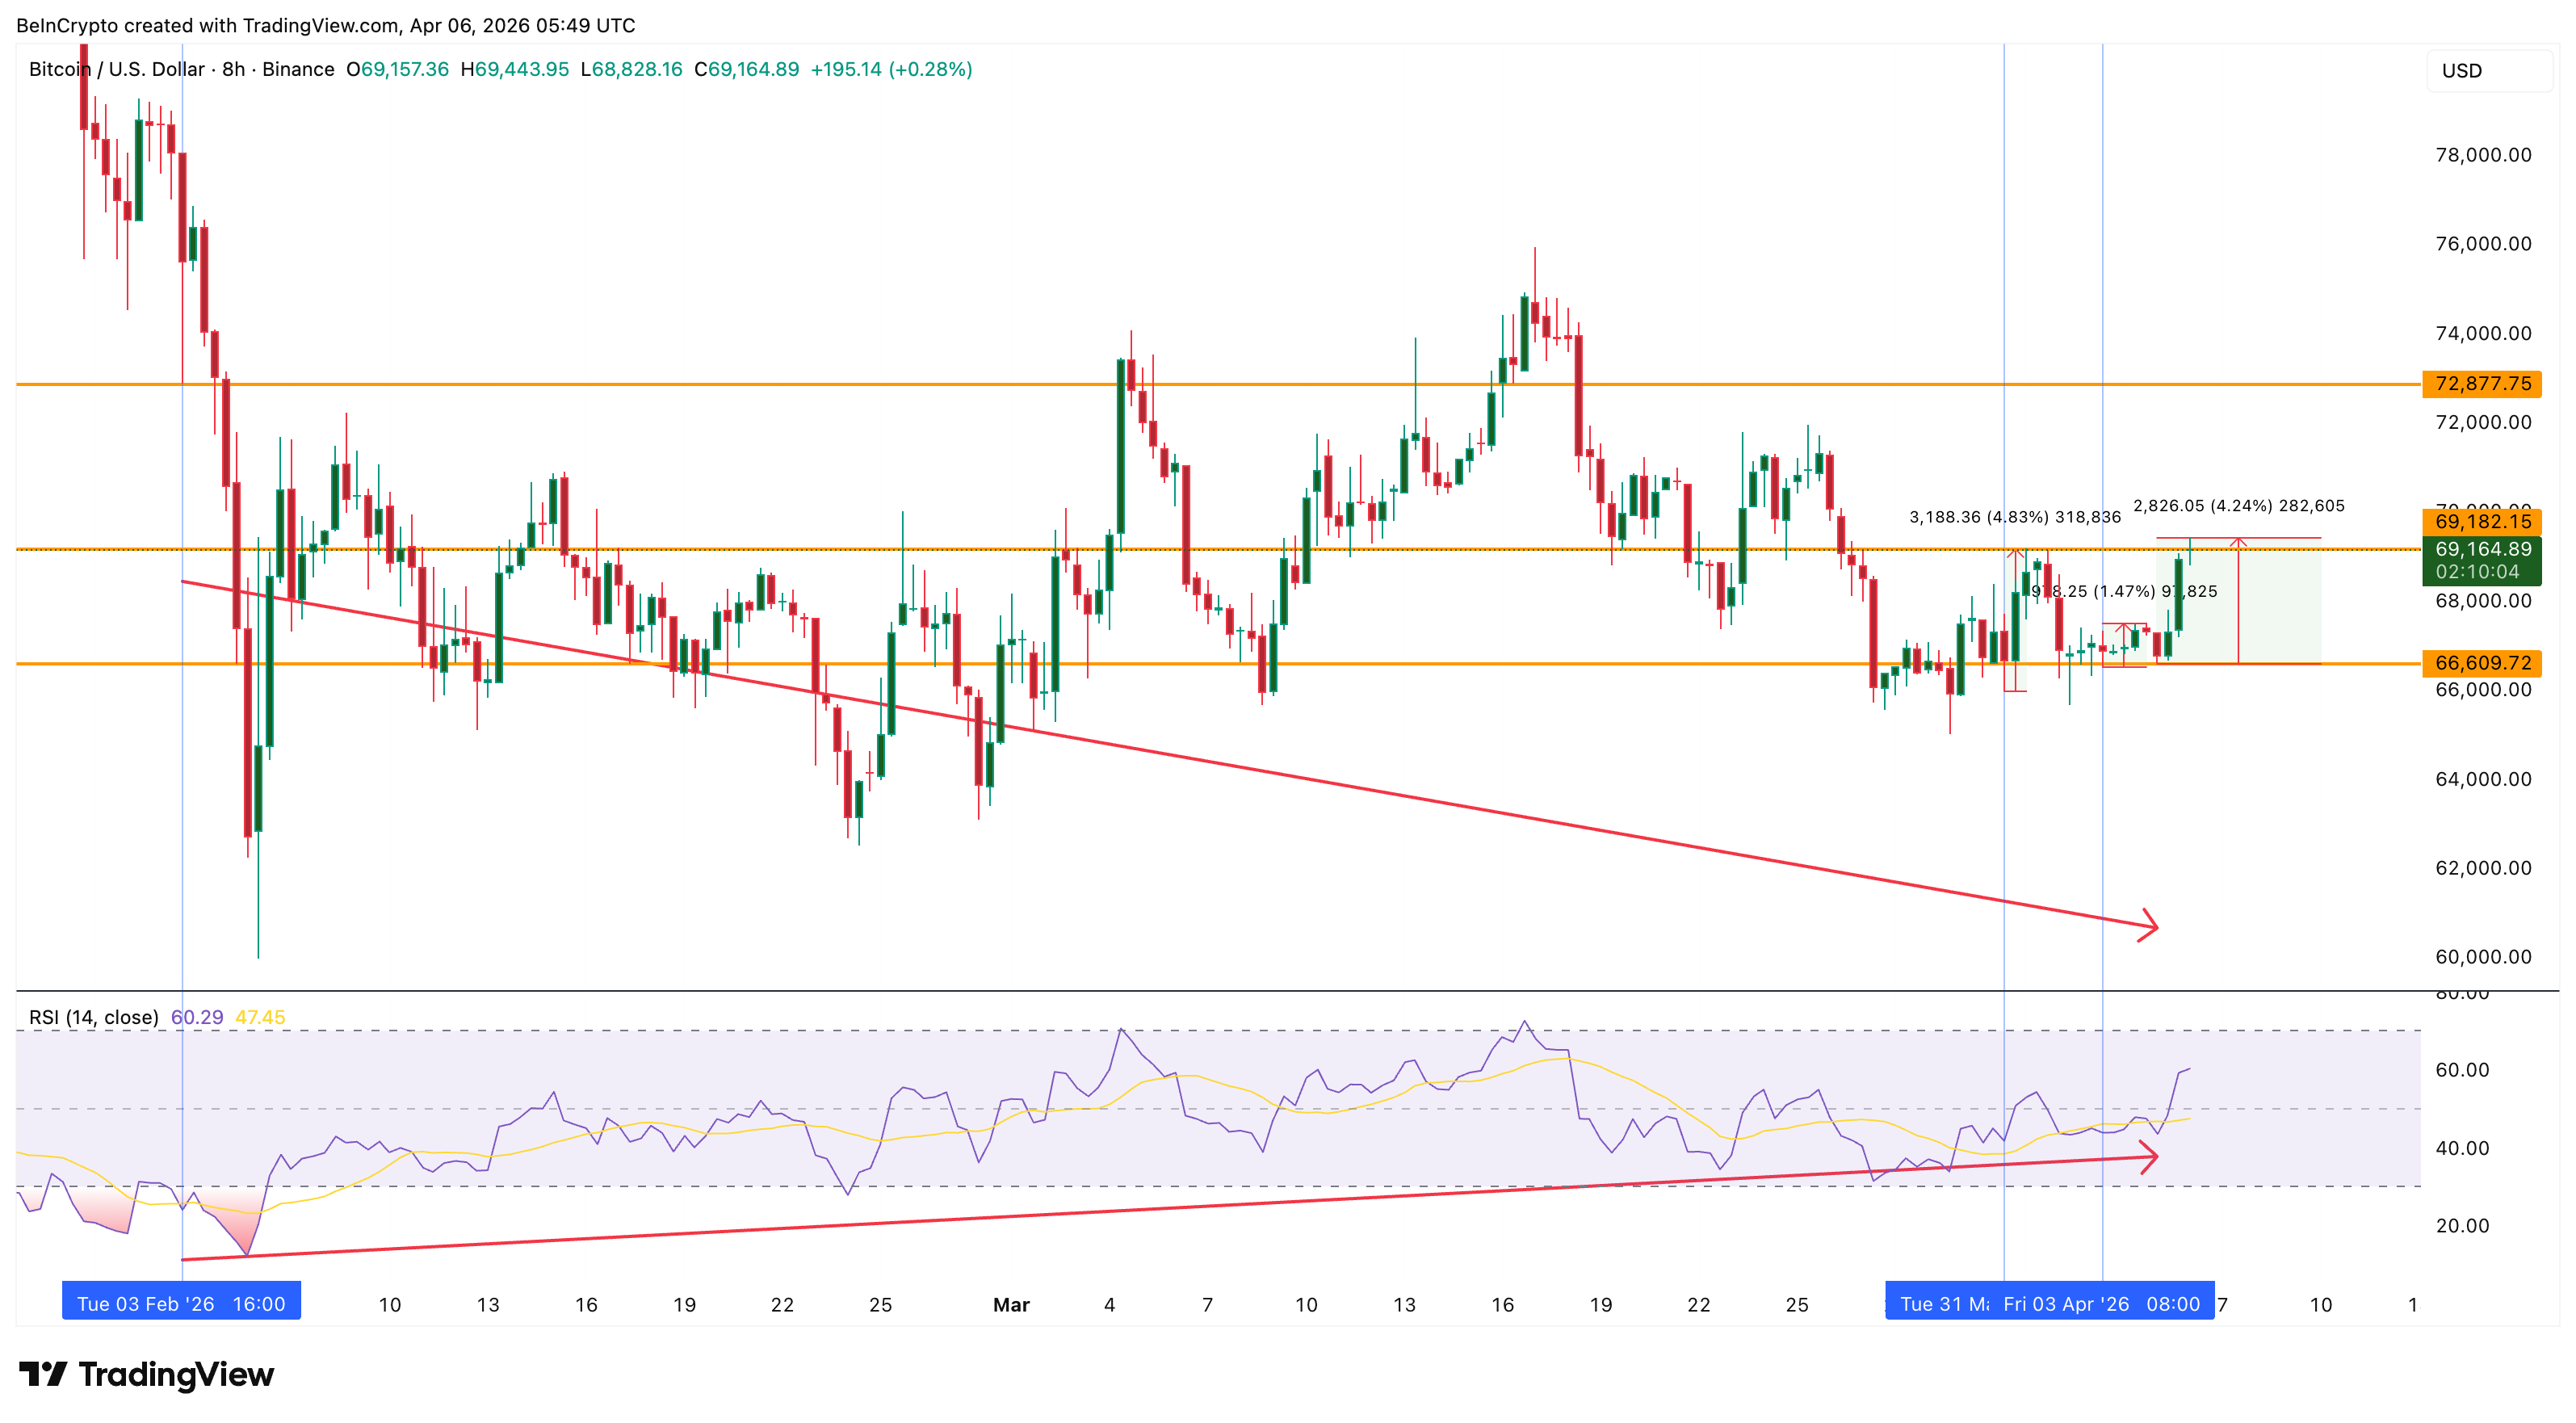
Bitcoin price has been forming a series of near-term standard bullish divergences on the 8-hour chart. The Relative Strength Index (RSI), a momentum oscillator that measures the speed and direction of price changes, made a higher low on each occasion while price printed a lower low. This pattern typically signals weakening selling pressure and precedes a reversal.
The first divergence completed on March 31, with the base date at February 3. Bitcoin rallied 4.83% before the move stalled. The second completed on April 3 and produced only a 1.47% bounce, the weakest of the three. The third completed on April 5 and has so far generated a 4.24% rally, pushing price back toward $69,192.
Want more token insights like this? Sign up for Editor Harsh Notariya’s Daily Crypto Newsletter here.
All three rallies share a common trait. None managed to close decisively above $69,182 on the 8-hour chart, a level where one of the previous bounces flattened. The signal keeps firing. The ceiling keeps holding.
At press time, Bitcoin price sits just above that level, testing whether the third attempt has enough momentum to break through where the first two failed. The answer lies not in the chart pattern itself but in who is buying and who is selling behind the scenes.
Two Conviction On-Chain Pillars Are Weakening
The reason the divergences have not translated into a sustained rally becomes visible in two on-chain datasets.
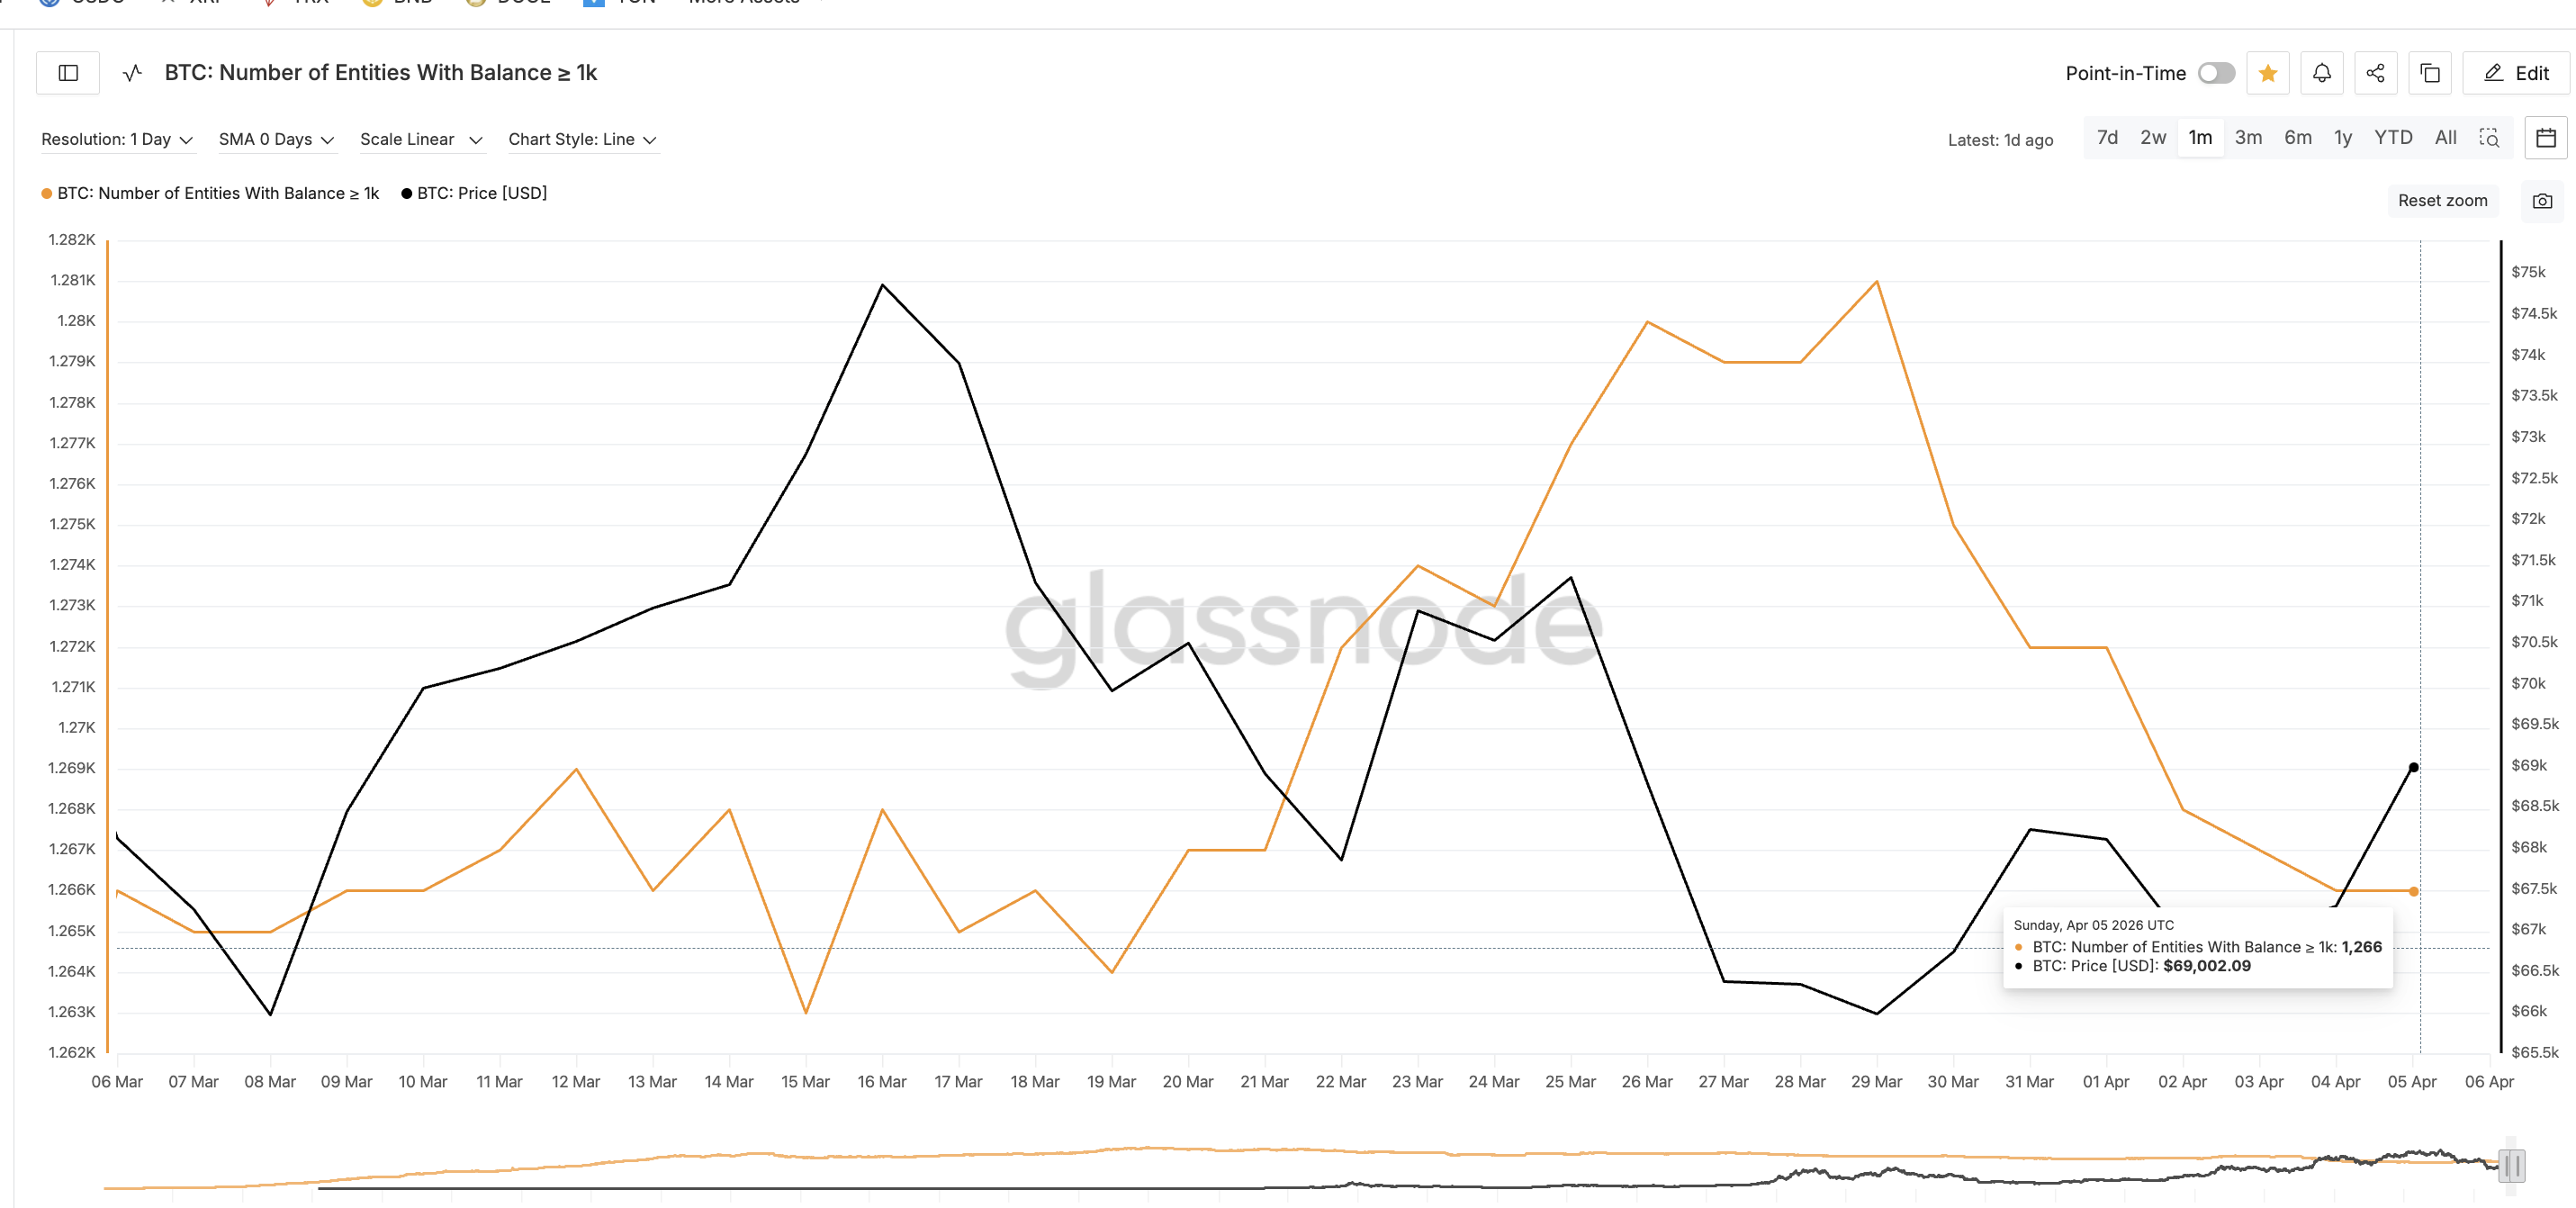
The first is whale concentration. The number of entities holding 1,000 or more BTC, a proxy for the largest holders in the market, peaked near 1,281 around mid-March. Since then, the count has declined steadily to 1,266 as of April 5. That reduction of 15 whale-tier wallets over three weeks means that the concentrated buying power which typically drives breakouts is thinning rather than building.
The decline accelerated after March 29, overlapping precisely with the window when the three divergences were forming.
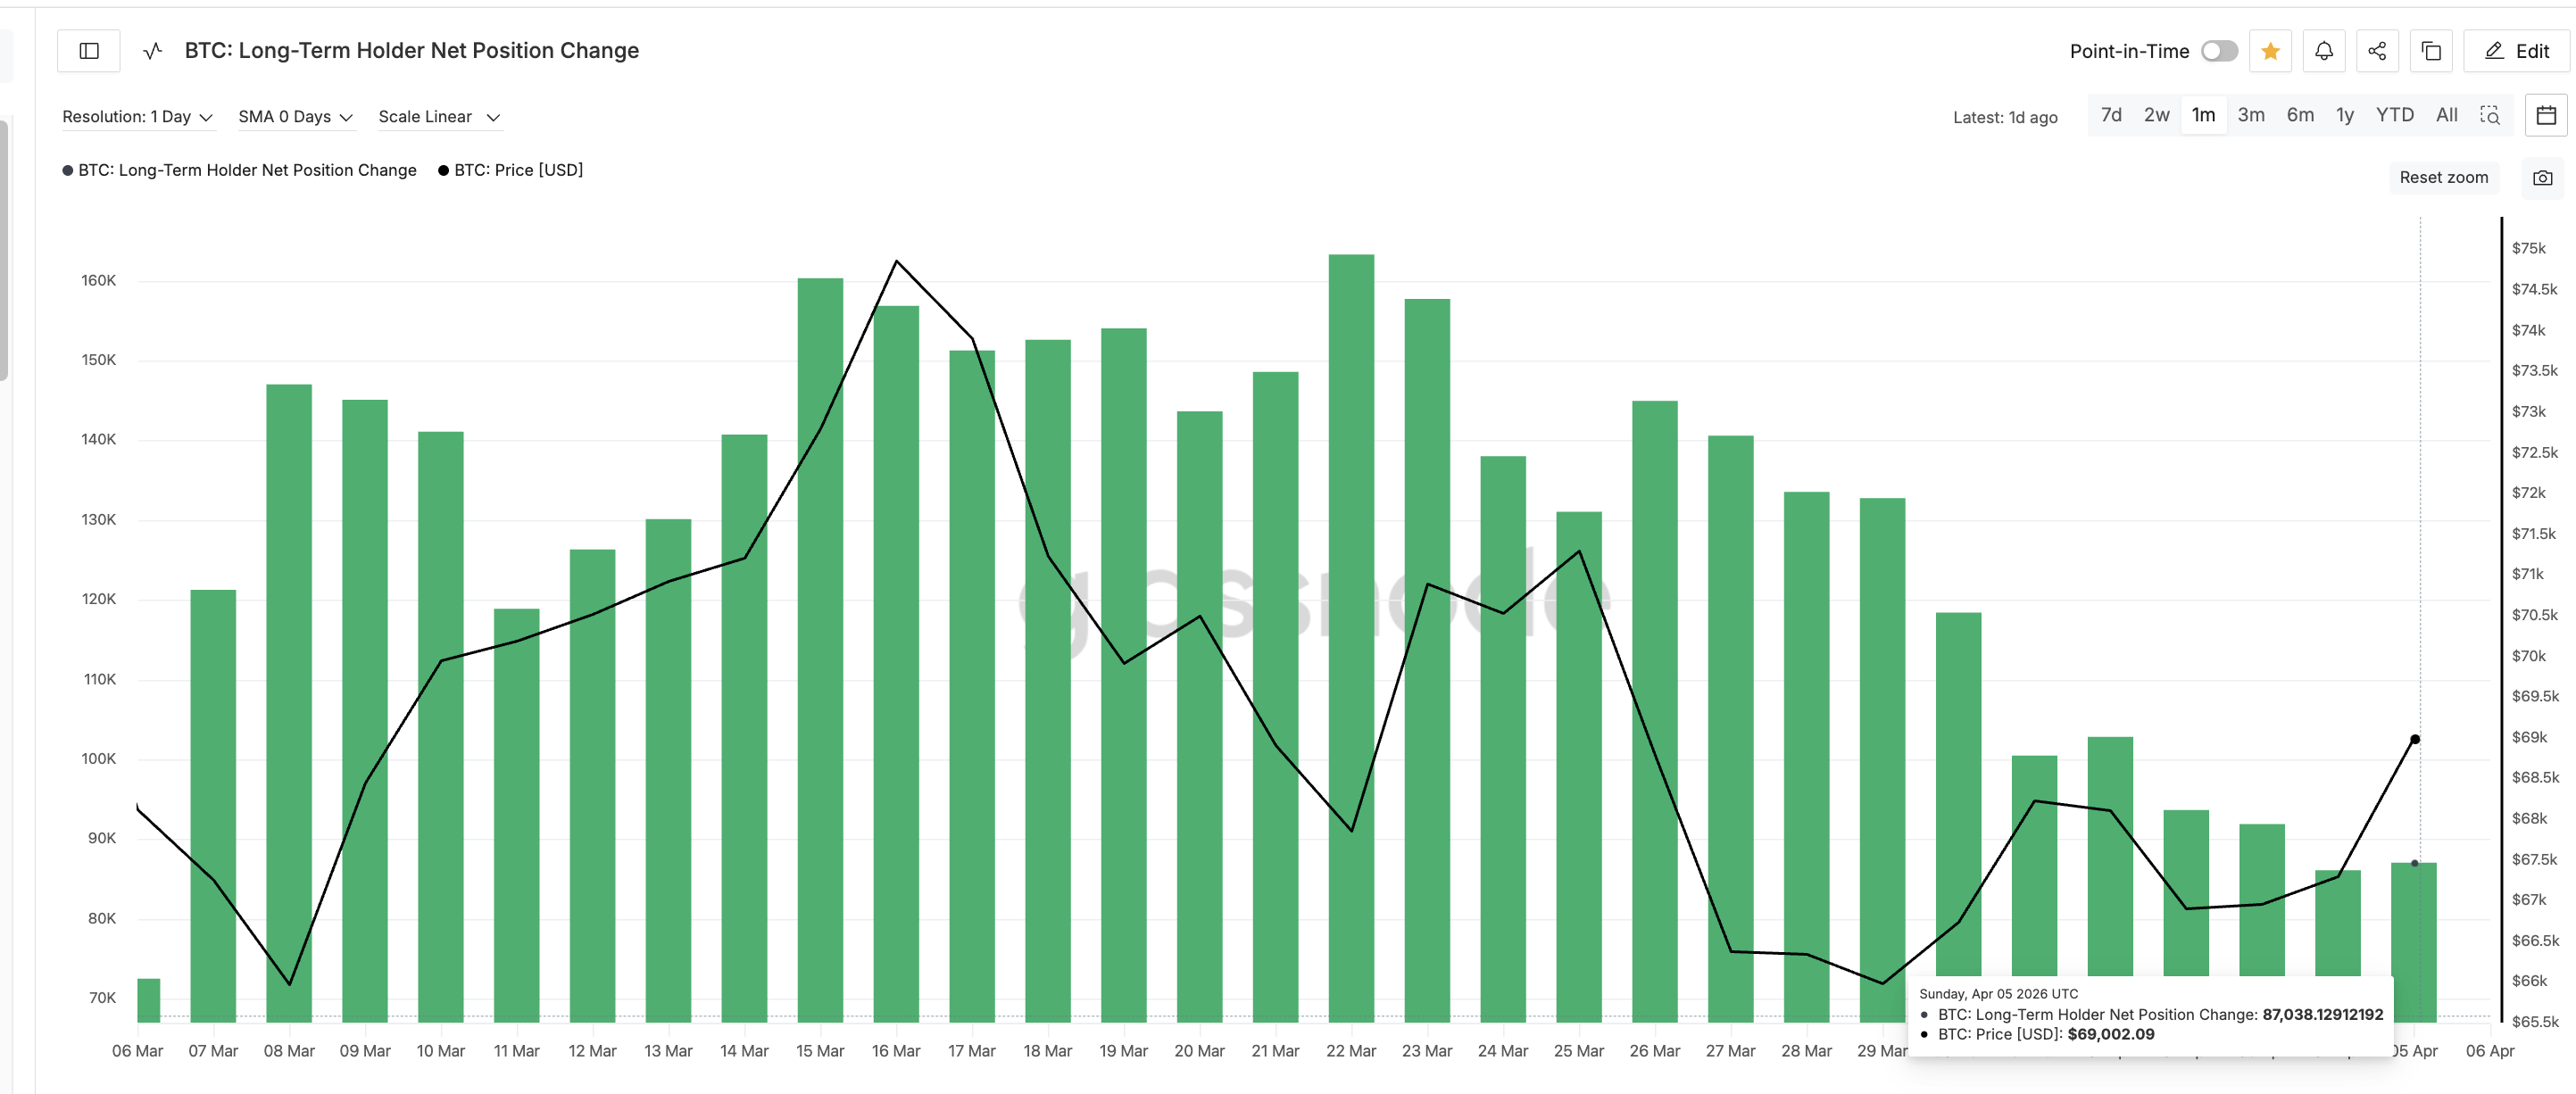
The second is long-term holder behavior. The Long-Term Holder Net Position Change, which tracks whether holders with a history of sustained positions are adding or reducing exposure, peaked at 163,262 BTC around March 22. By April 5, it had dropped to 87,038 BTC, a decline of nearly 47%. Long-term holders are not capitulating, but their conviction has weakened.
The UTXO Realized Price Distribution (URPD), which maps how much supply was last moved at each price level, reveals the structural obstacle sitting directly overhead. A 1.7% supply cluster sits at the current price range near $69,422. This means that 1.7% of all Bitcoin supply has its cost basis at or near the current level, creating a wall of potential sellers who may look to exit at breakeven.
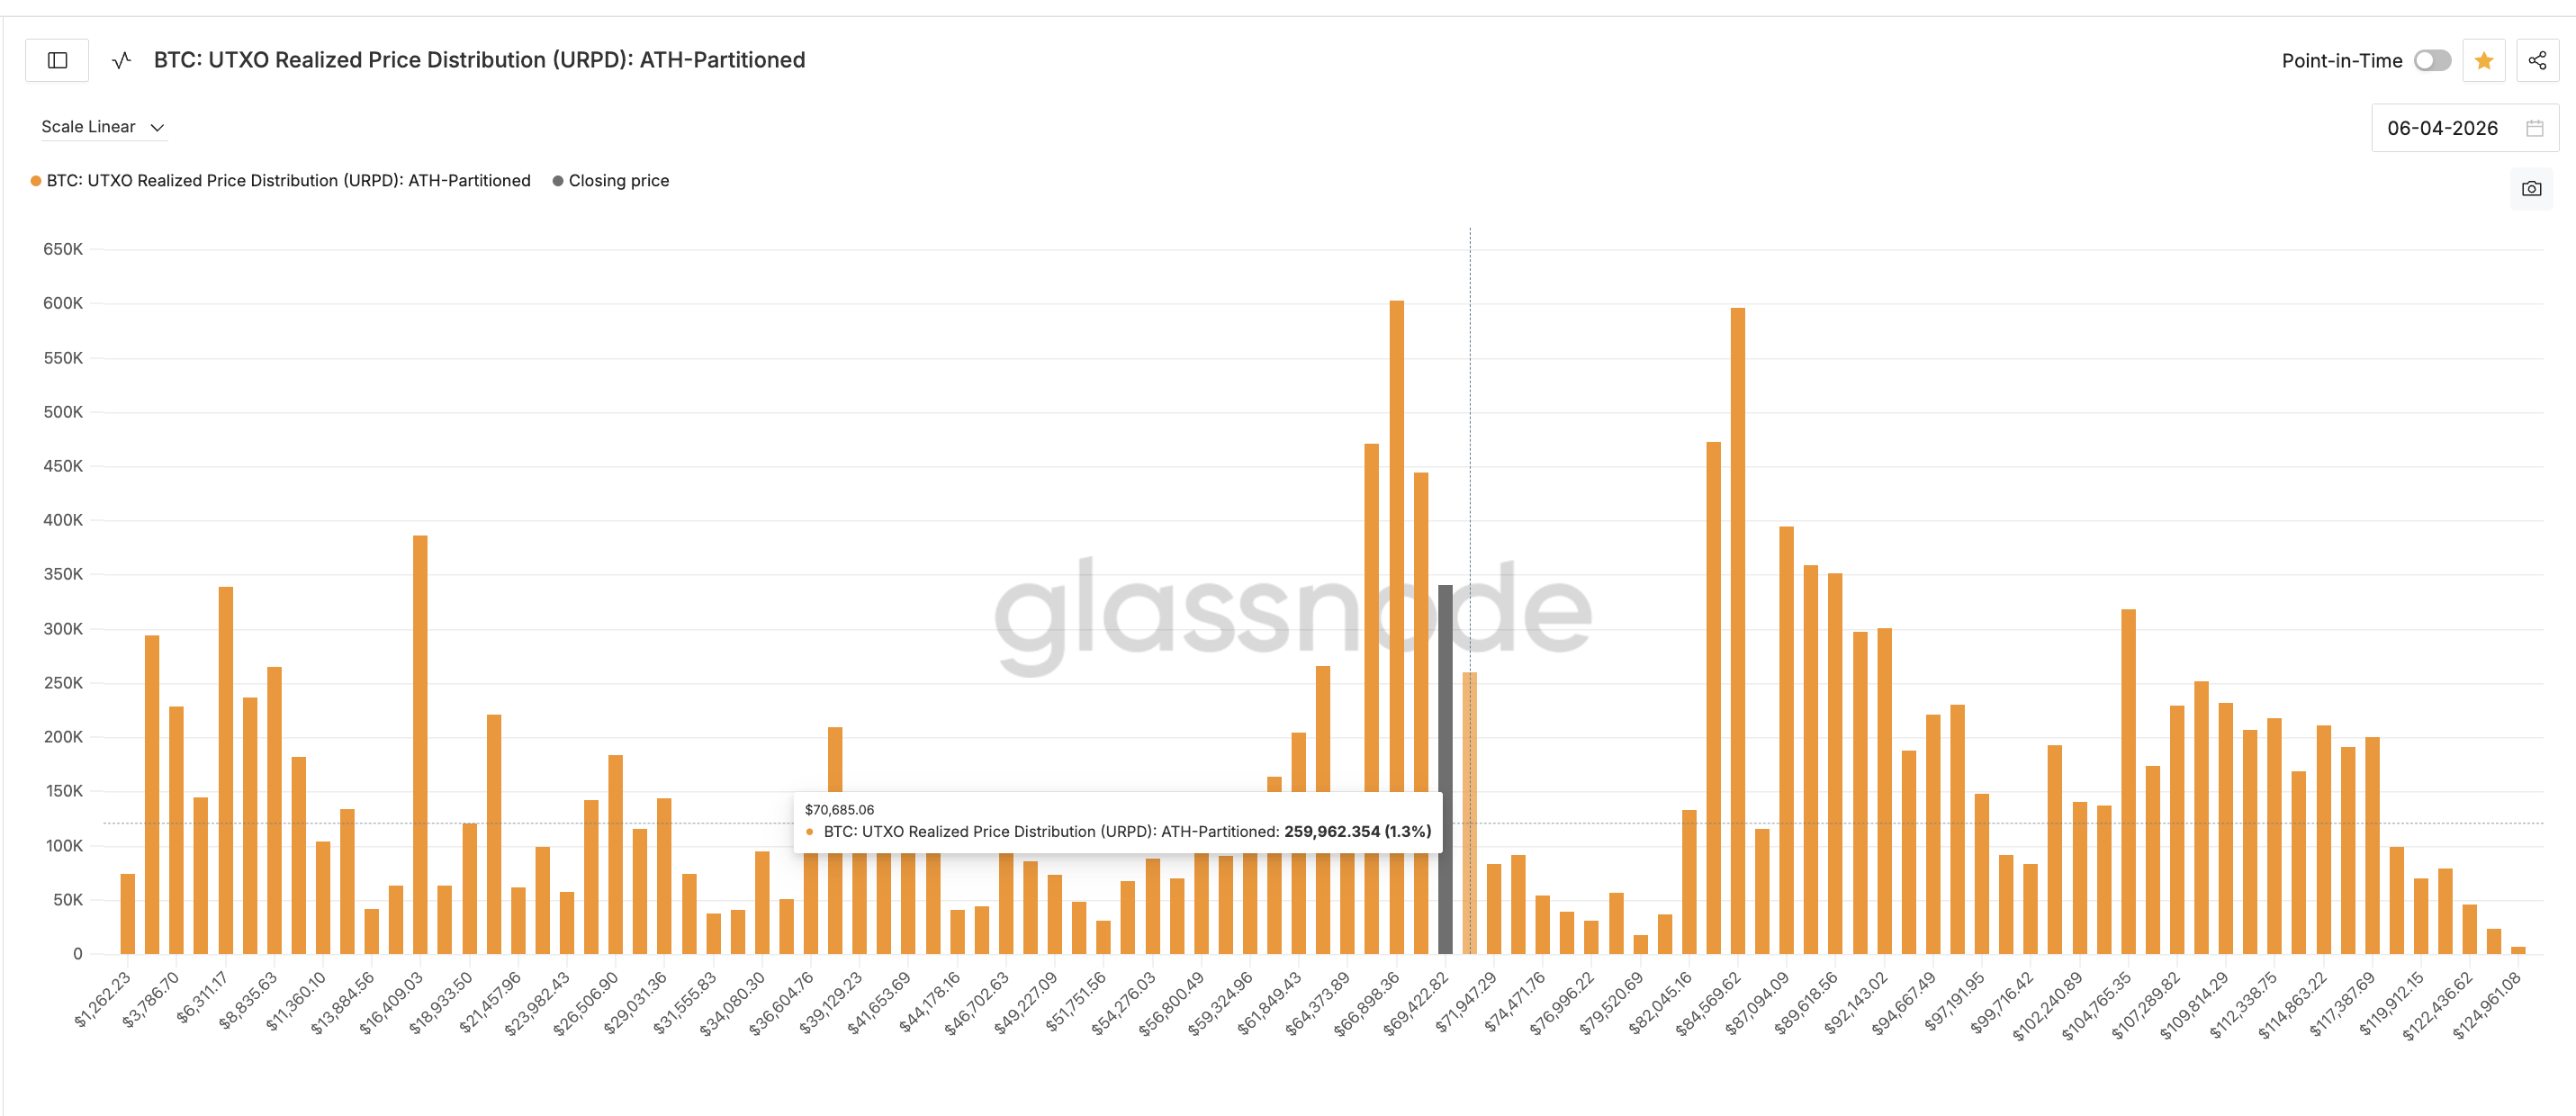
However, the cluster dynamics change quickly above that level. At $70,685, the supply concentration drops to 1.3%. Beyond that, the clusters thin significantly until around $84,000, where another dense zone appears. The difficulty is getting through the first wall without the whale and long-term holder conviction that usually support breakouts.
Bitcoin Price Levels That Separate a Breakout From Another Stall
The 8-hour chart with the completed swing between March 17 and March 25 frames every critical level for this week.
The immediate hurdle is $69,920. An 8-hour close above that level would indicate that the 1.7% supply cluster at the current range did not sell into this rally, which would be the first meaningful departure from the pattern set by the previous two divergences.
Above $69,920, the swing high at $71,956 becomes the next target, and a close above it would confirm that Bitcoin price has broken out of the range that has contained it since late-March.
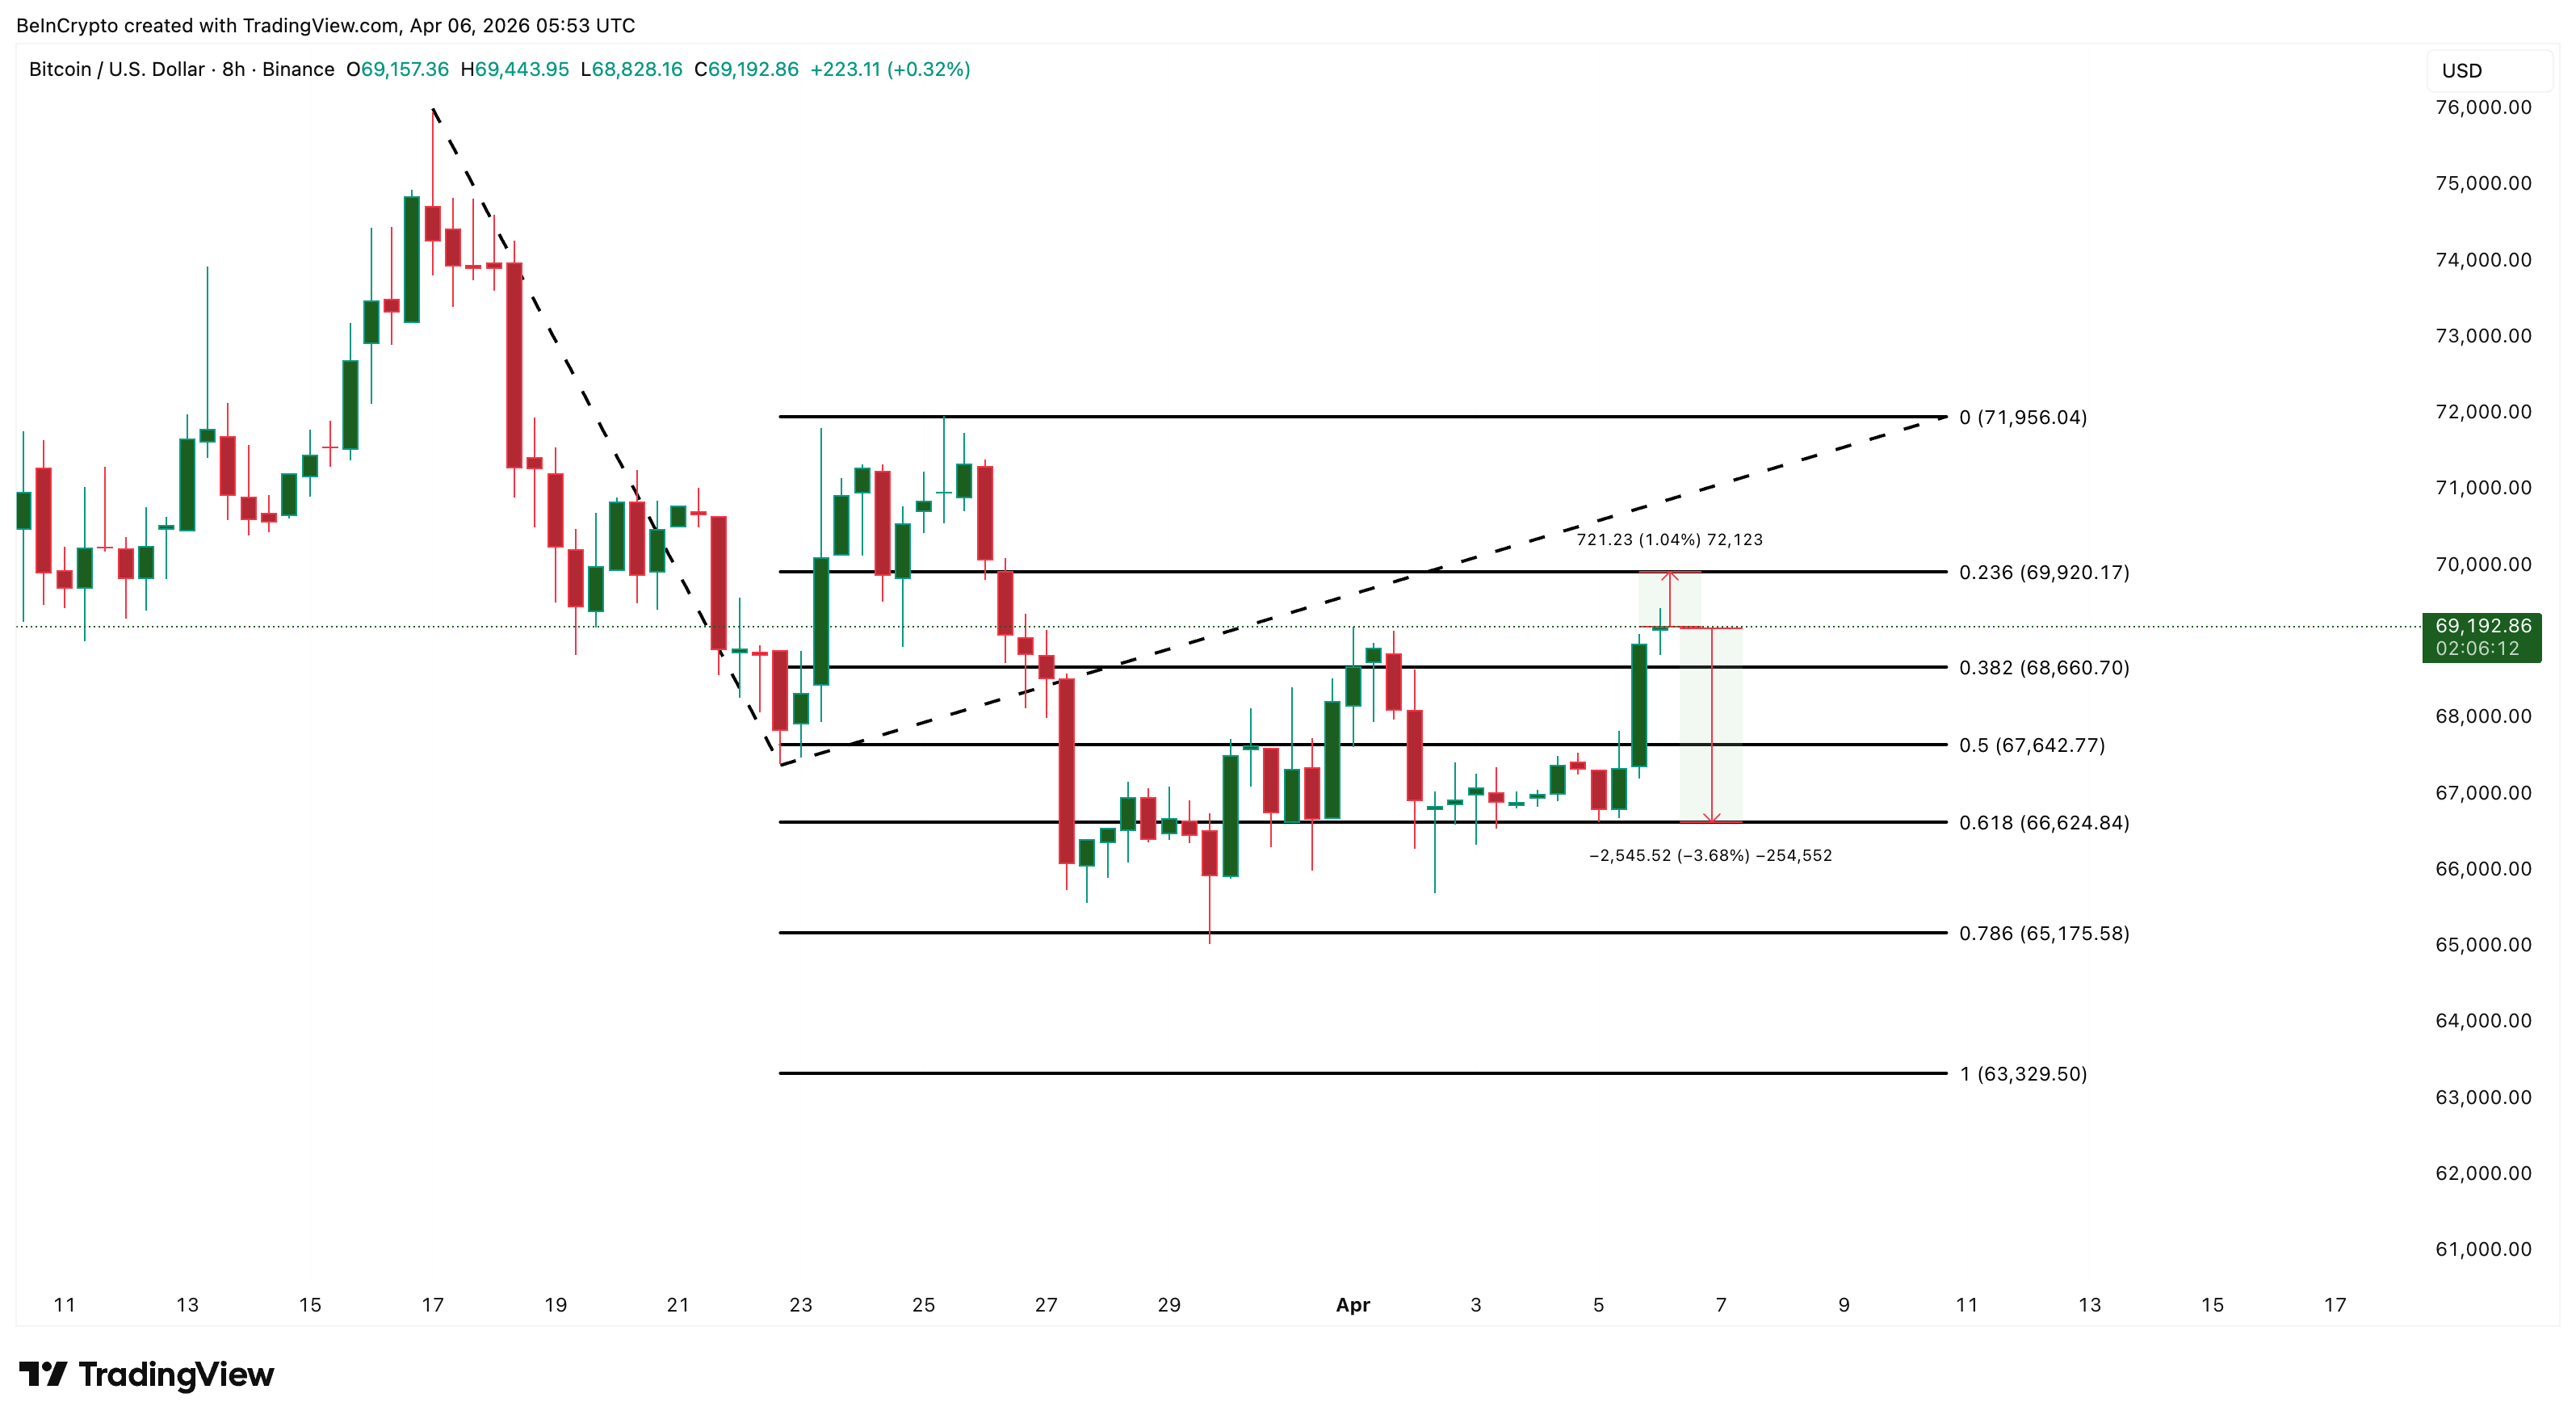
On the downside, $68,660 serves as immediate support for BTC. Below that, $66,624 has acted as a strong floor with multiple touch points since late March. If that level breaks, the structure deteriorates significantly and $63,329 becomes the next reference.
A clean 8-hour close above $69,920 would be the first sign that this divergence is different from the two that came before, while a failure to hold $66,624 would suggest the on-chain weakness has fully overtaken the technical signals and the next leg moves lower.
The post Bitcoin Price Flashed 3 Bullish Hints in a Week and None Delivered a Breakout appeared first on BeInCrypto.
Read moreLatest News