
Bitcoin Is Just One Push Away From Ending Its Correction — Here’s How
Bitcoin price has extended its correction after the FOMC rate cut. The coin is down about 13% over the past 30 days and almost 4% in the past week. The move still fits inside a slow, grinding corrective phase since the October peak.
But two on-chain shifts now show something that did not appear at any point earlier in this downturn. These signals suggest the correction could be close to a turn — if Bitcoin delivers the push it needs.
Two Metrics Now Point Toward a Possible Turn
Short-term capitulation is showing up clearly now. CryptoQuant’s realized profit-and-loss data shows short-term Bitcoin holders are still deep in losses. This usually happens near the end of a correction, not the middle, because panicked selling at a loss often marks late-stage exhaustion.
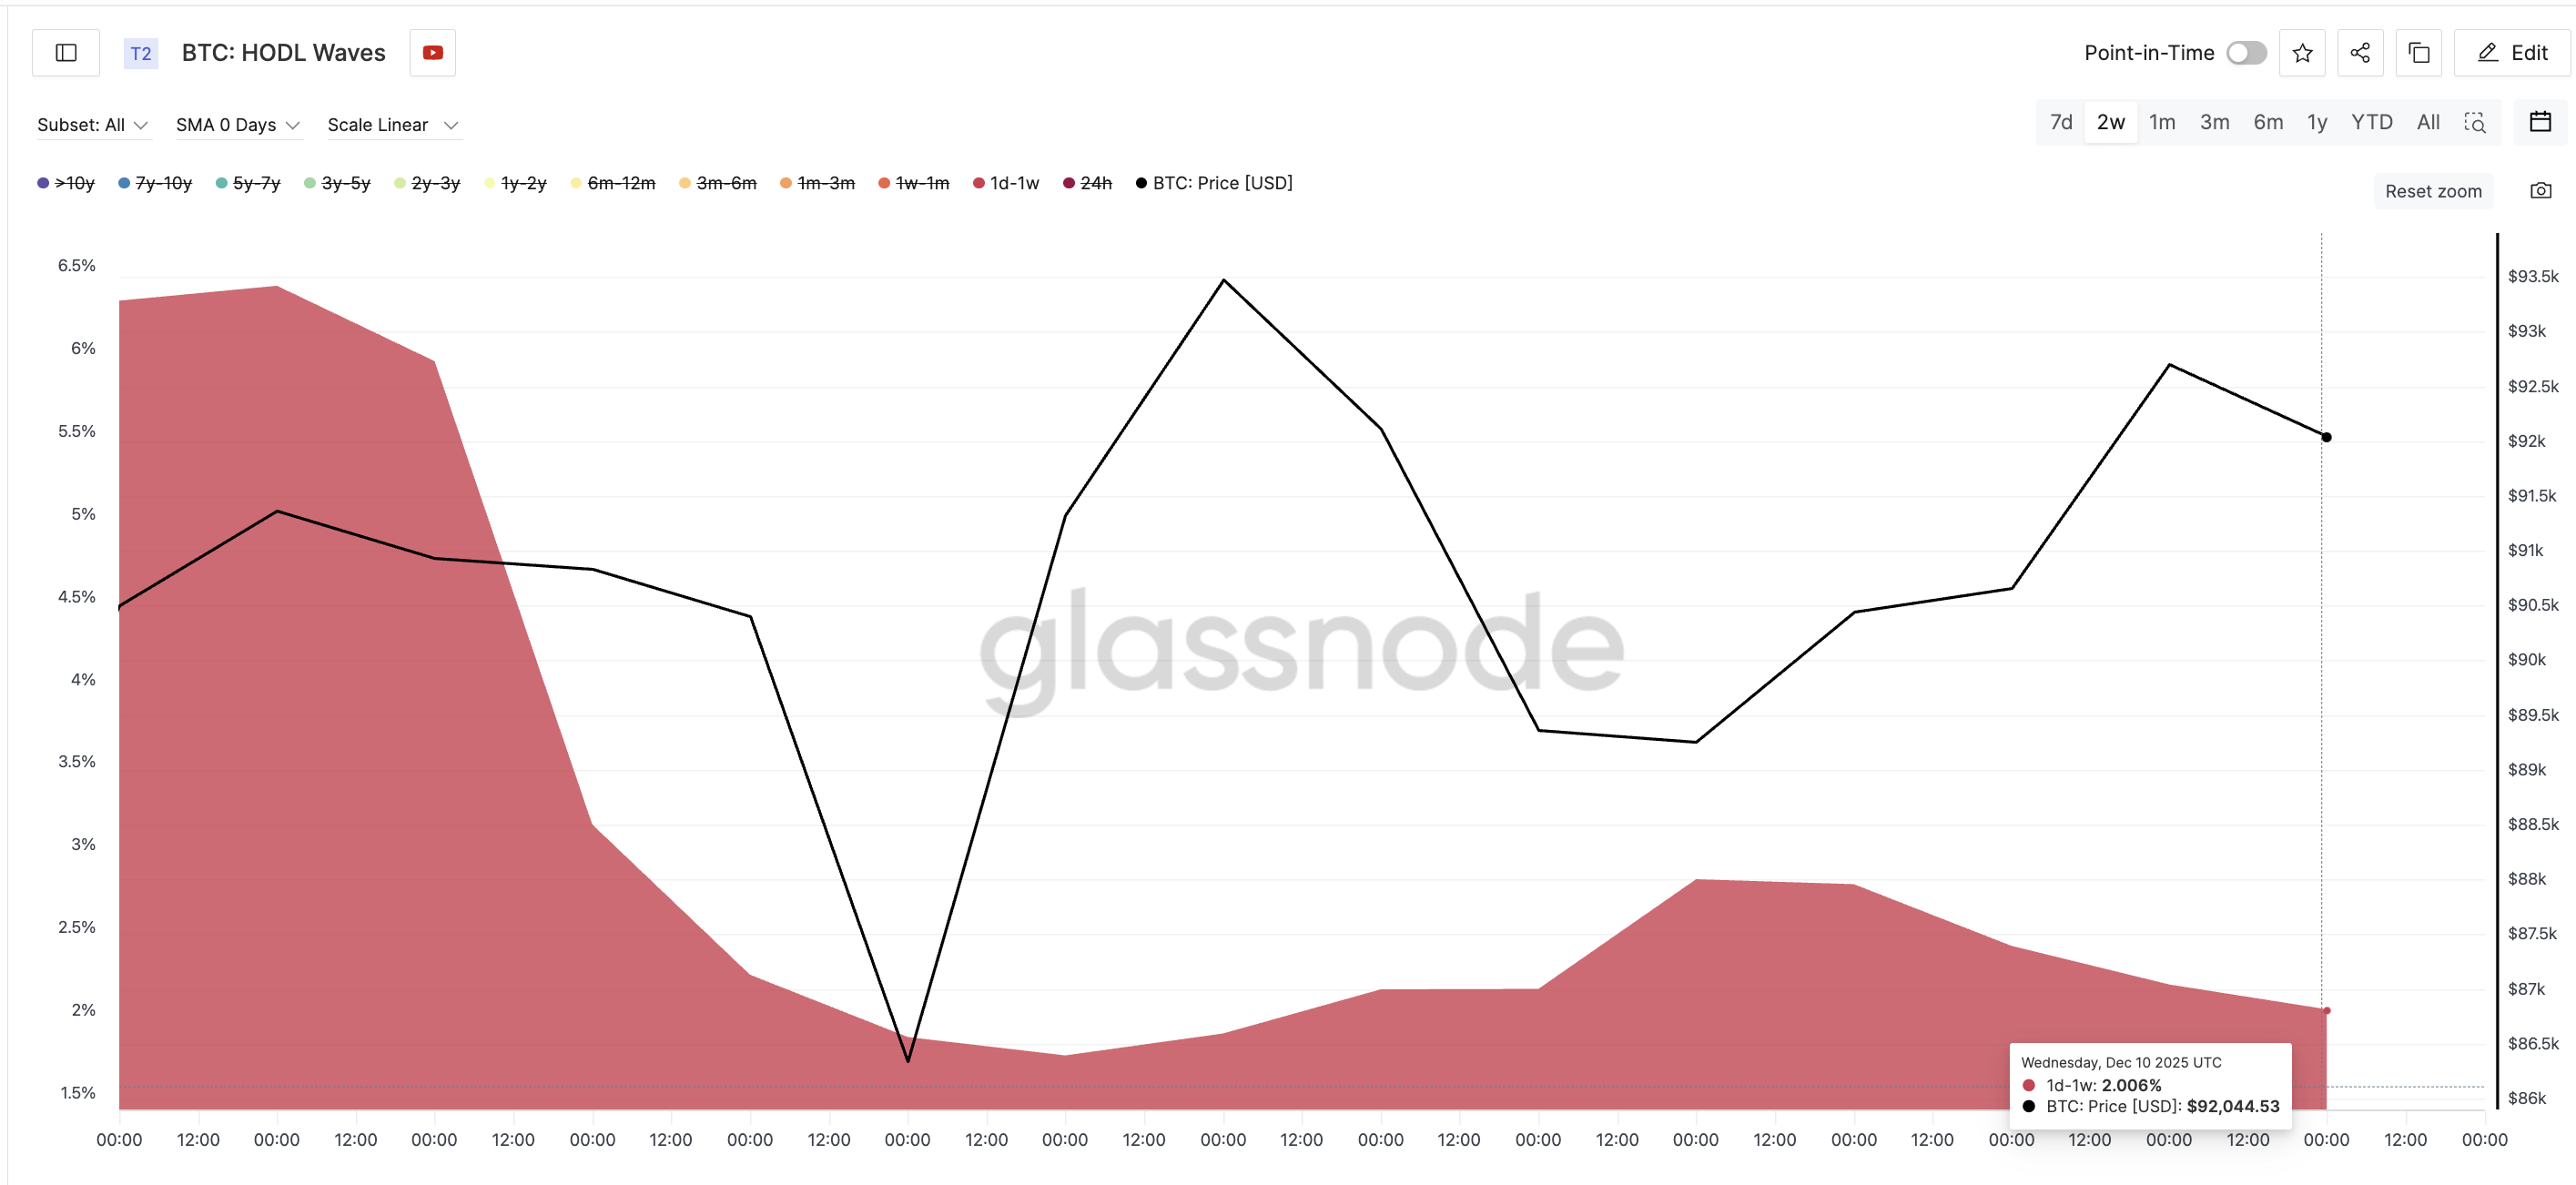
This fits with what shows up on HODL Waves.
HODL Waves measure how much Bitcoin each “age band” holds — from very new coins to very old ones. It shows which groups are accumulating or selling. The one-day to one-week cohort held 6.2% of the supply in late November. By December 10, they held only 2%.
That is a massive 68% drop and signals heavy short-term selling, the kind that often completes a correction rather than starts a new one. Plus, this cohort dumping also pushes speculative money out of the asset.
Want more token insights like this? Sign up for Editor Harsh Notariya’s Daily Crypto Newsletter here.
The next signal comes from Exchange Net Position Change, which tracks how many coins move into or out of exchanges each day.
On November 27, net flows were +5,103 BTC (coins moving in).
By December 10, the flows flipped to –43,292 BTC, a flip of more than 8.4x from inflows to outflows.
A similar shift happened between September 17 and September 25. After that flip, Bitcoin rallied toward its all-time high above $126,000, per CoinGecko.
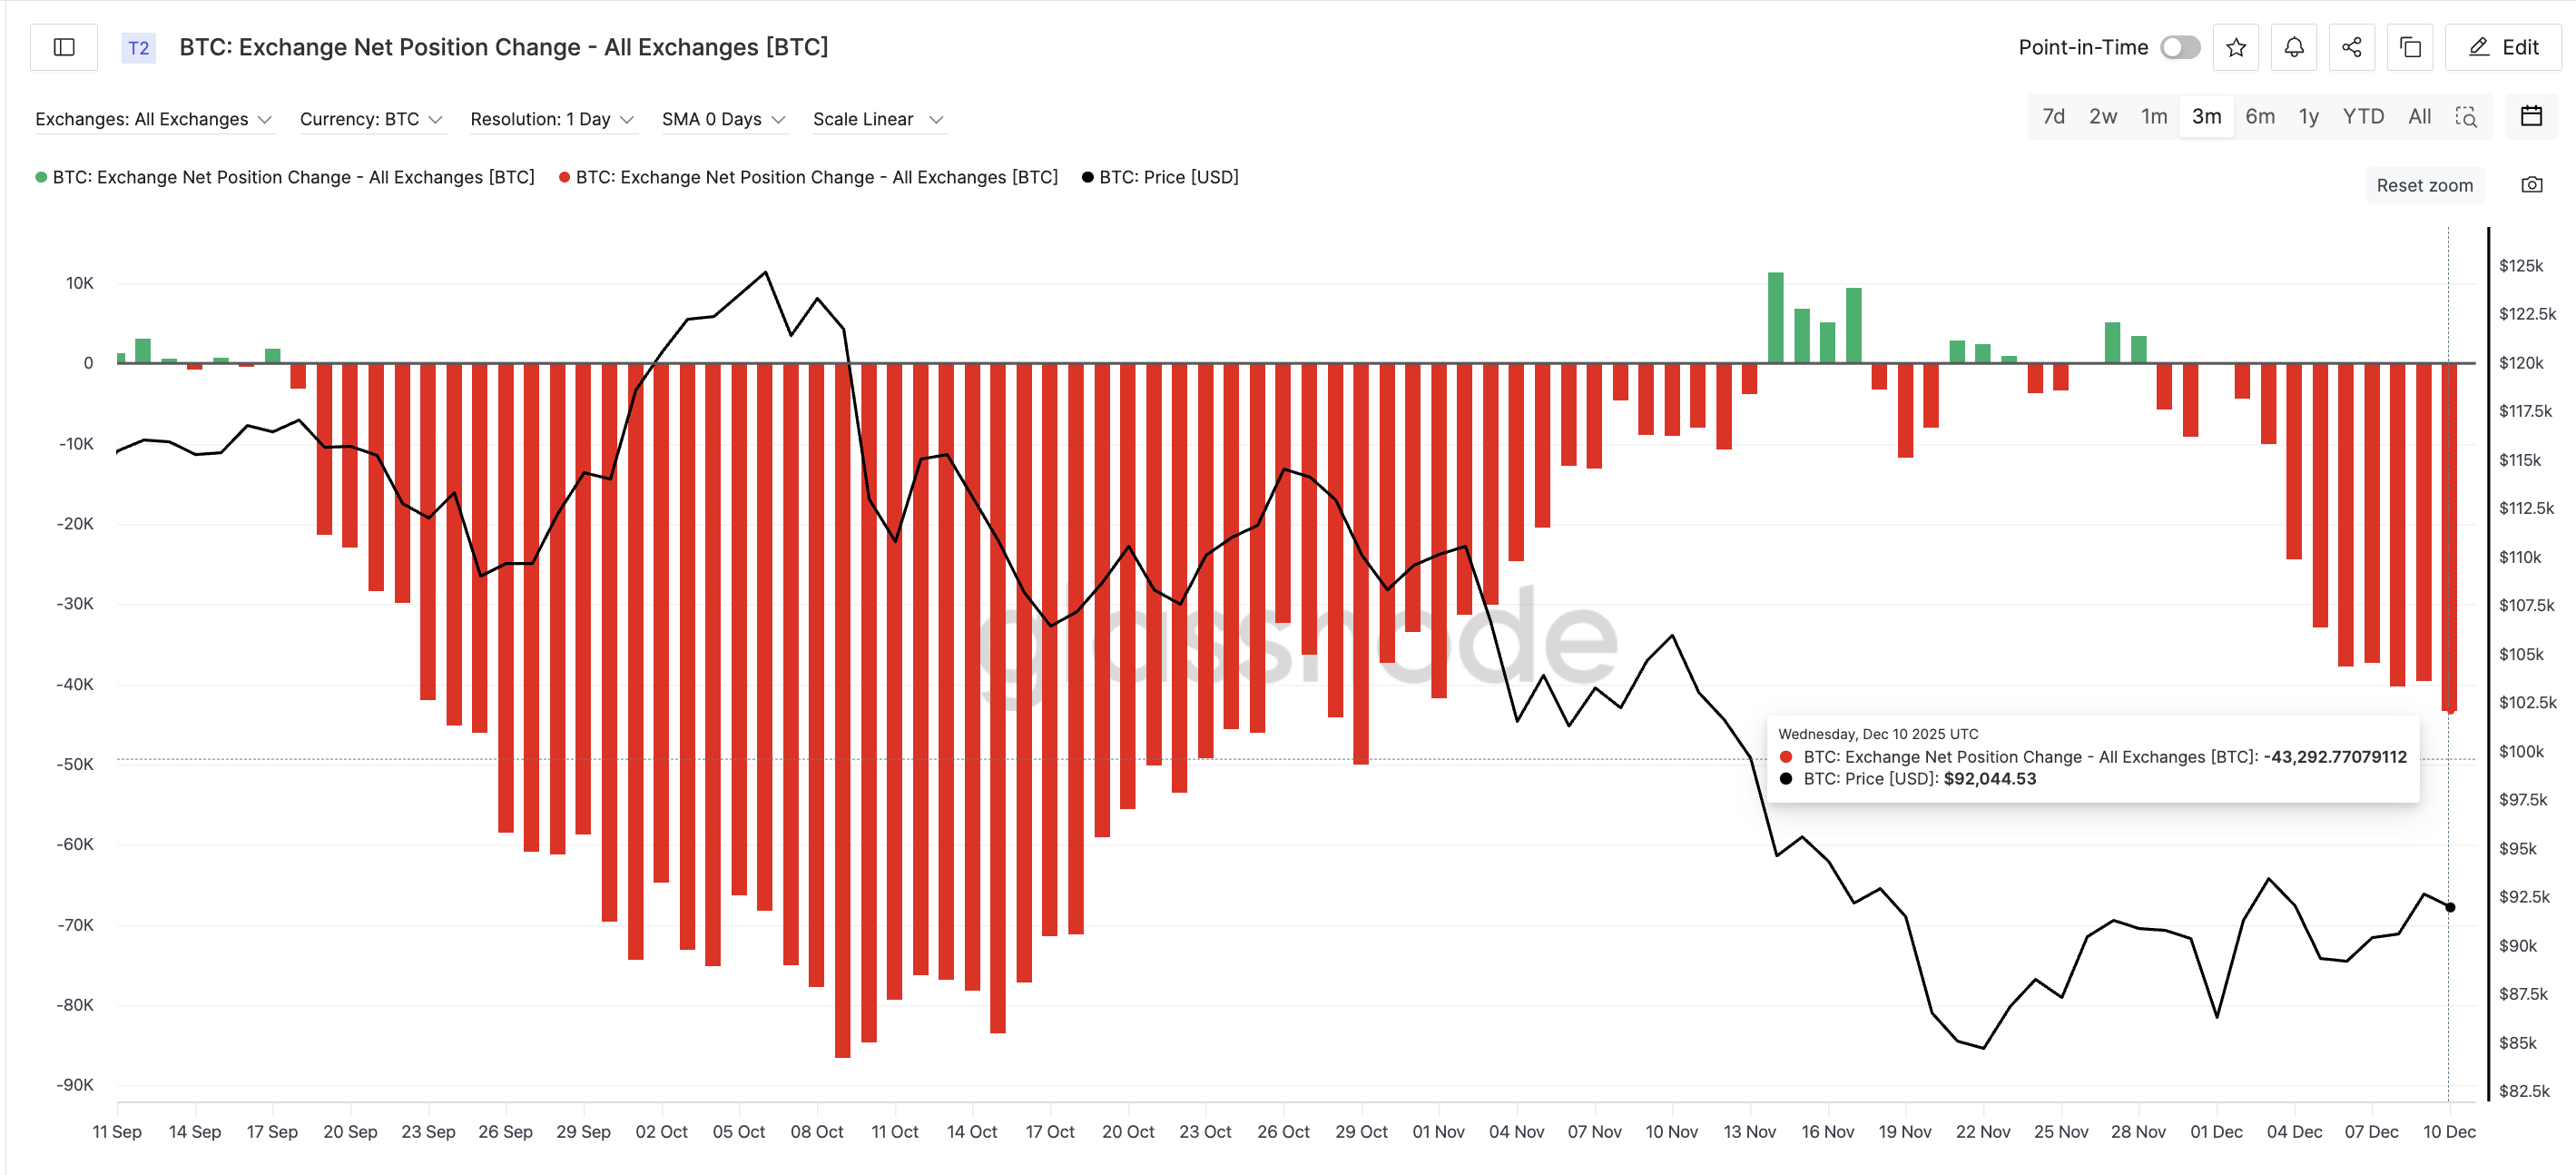
Now the same combination — short-term capitulation plus strong outflows — is forming again. Together, they create the cleanest trend-shift setup of this entire correction.
Bitcoin Price Needs a 4% Push to Break Out?
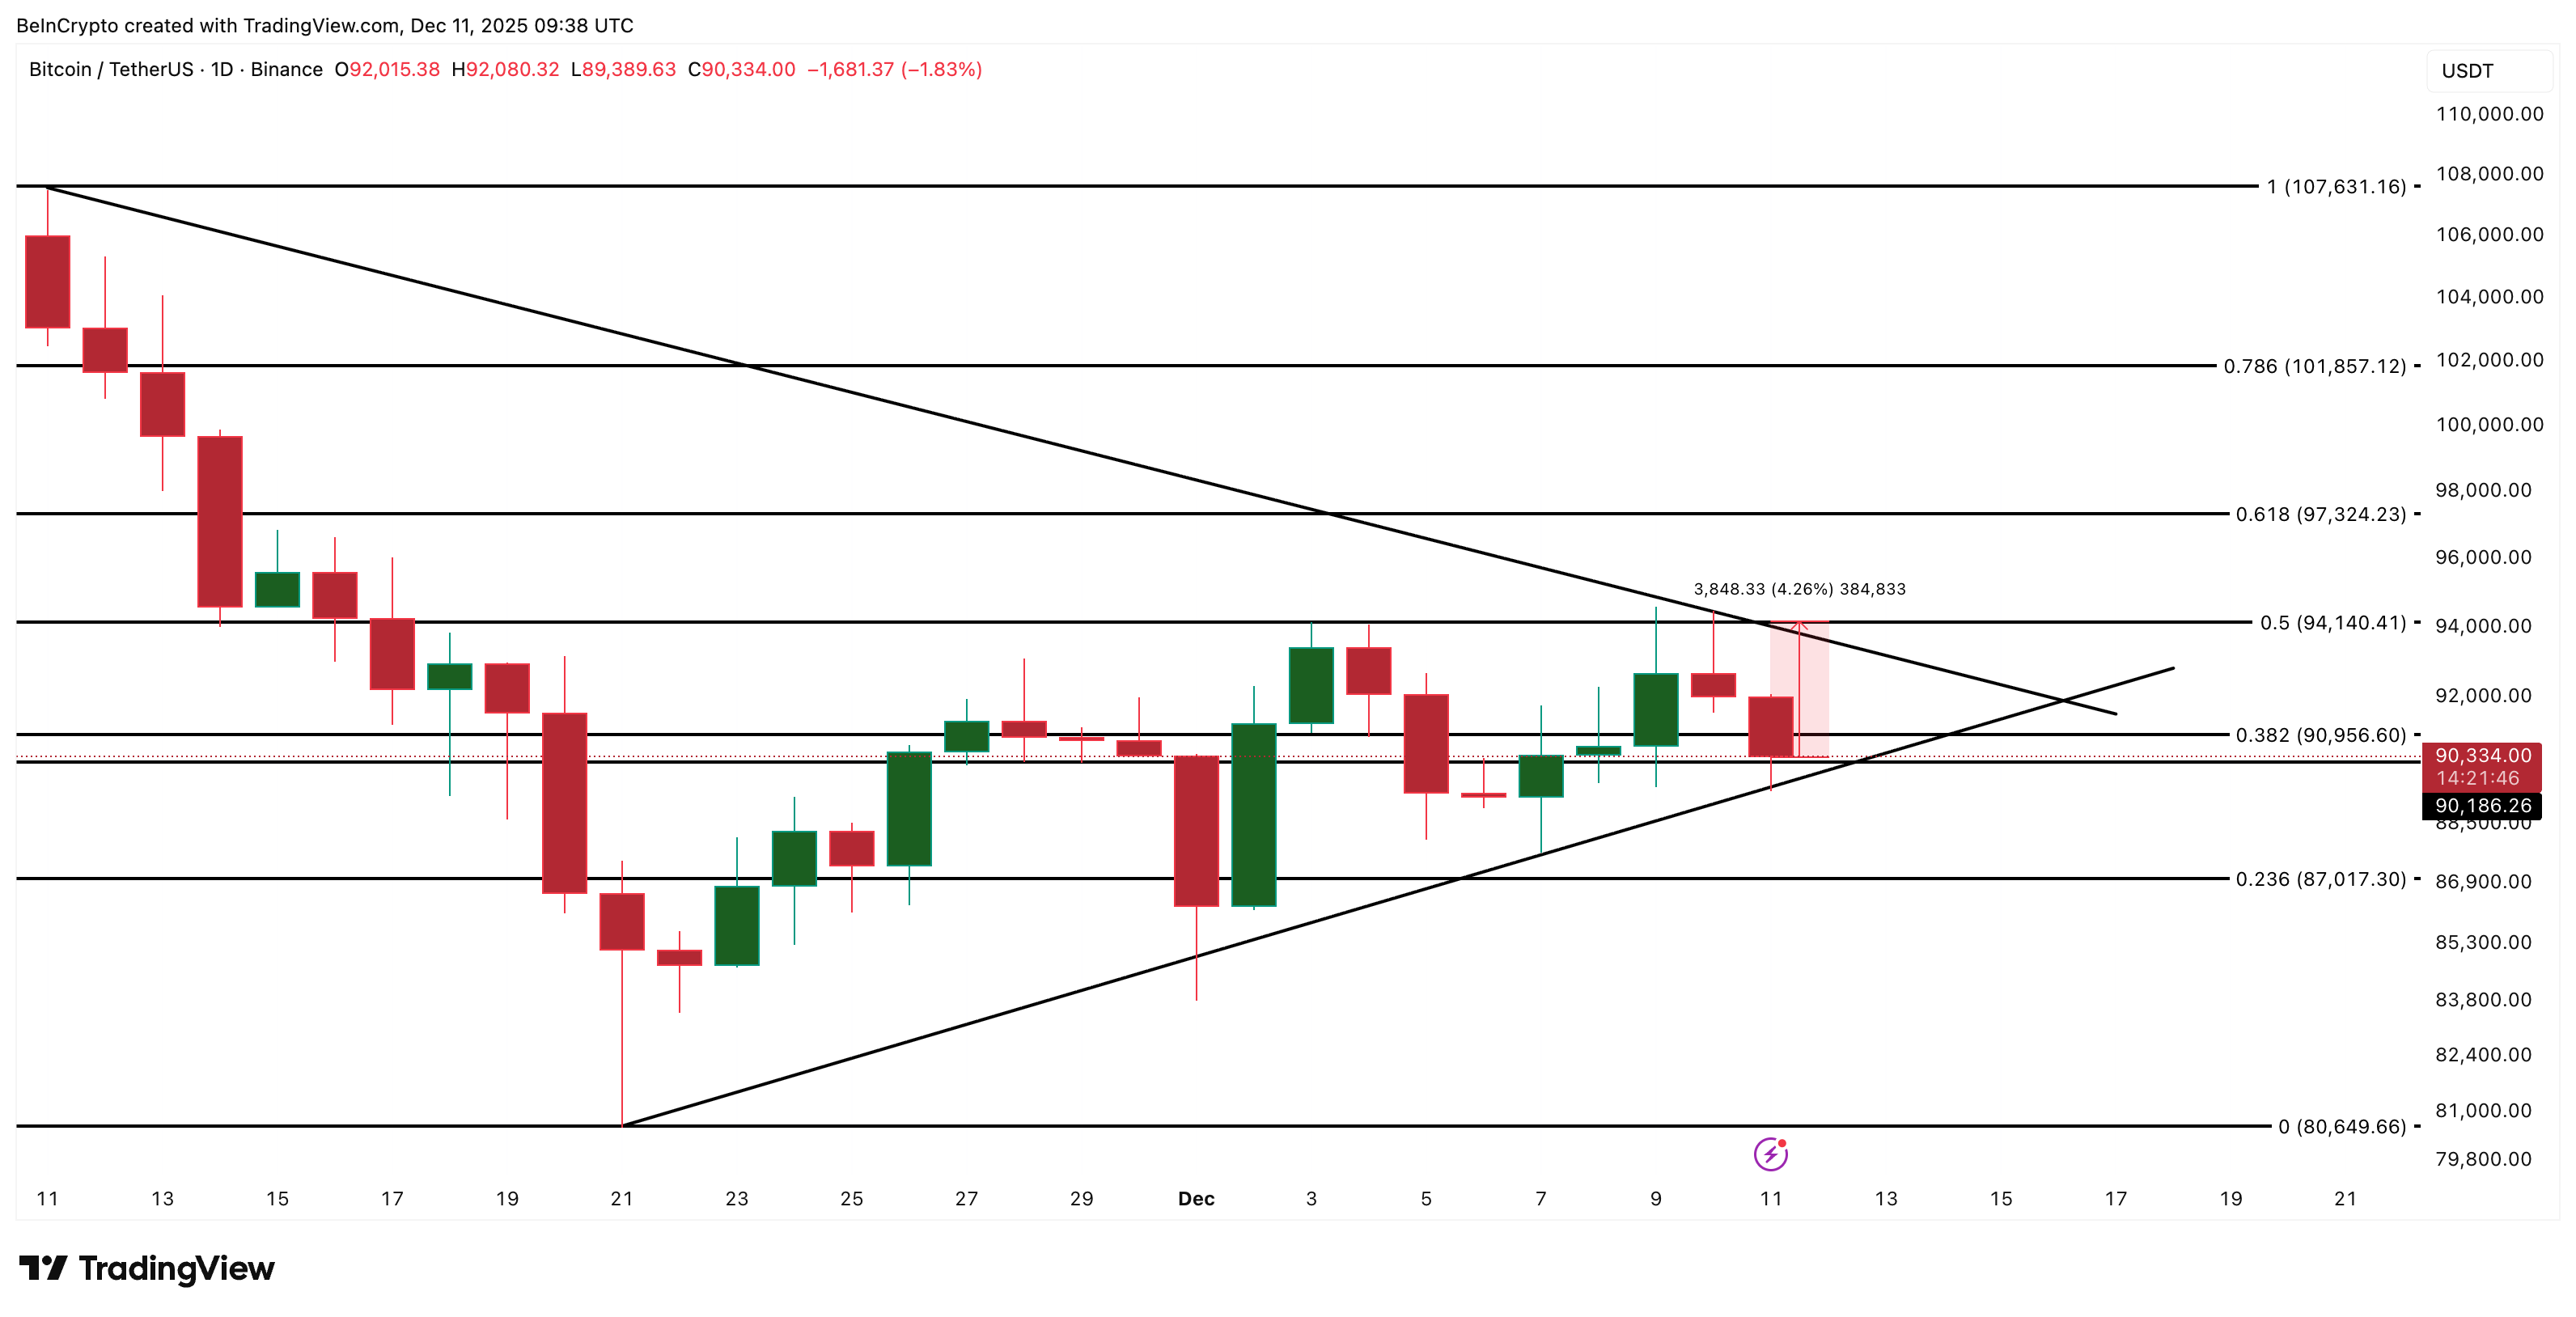
If these signals are pointing to a turn, the Bitcoin price chart needs to confirm it. The Bitcoin price has been moving inside a symmetrical triangle on the daily chart. A symmetrical triangle forms when buyers and sellers slow at the same pace. Each side has only two touch points, which makes both trend lines weak. A small push can break the entire setup on either side.
That push is clear: Bitcoin needs a daily close above $94,140, which is only about a 4% move from current levels. This level overlaps with both the horizontal resistance and the upper edge of the triangle. A clean breakout opens the path toward $97,320 and then $101,850.
On the downside, the nearest risk level is $90,180. A daily close under it weakens the bullish case. If that breaks, $87,010 is the next major support. Losing that exposes $80,640, where the broader bullish idea breaks.
Right now, the setup is neutral but improving. Short-term capitulation and heavy outflows give the Bitcoin price a chance to end its correction — but only if it delivers that 4% breakout.
The post Bitcoin Is Just One Push Away From Ending Its Correction — Here’s How appeared first on BeInCrypto.
Read moreLatest News