
Bitcoin Bear Market Could Get Worse Despite the Latest Relief Rally
Bitcoin price continues to trade under sustained pressure, struggling to reclaim the $70,000 level. BTC remains capped by a persistent downtrend that has limited upside attempts for weeks.
Historical cycle data and current on-chain signals suggest that bearish conditions may not be over. While short-term rallies occur, structural indicators imply that Bitcoin could remain constrained below $70,000.
Bitcoin’s Past Says Pressure Persists
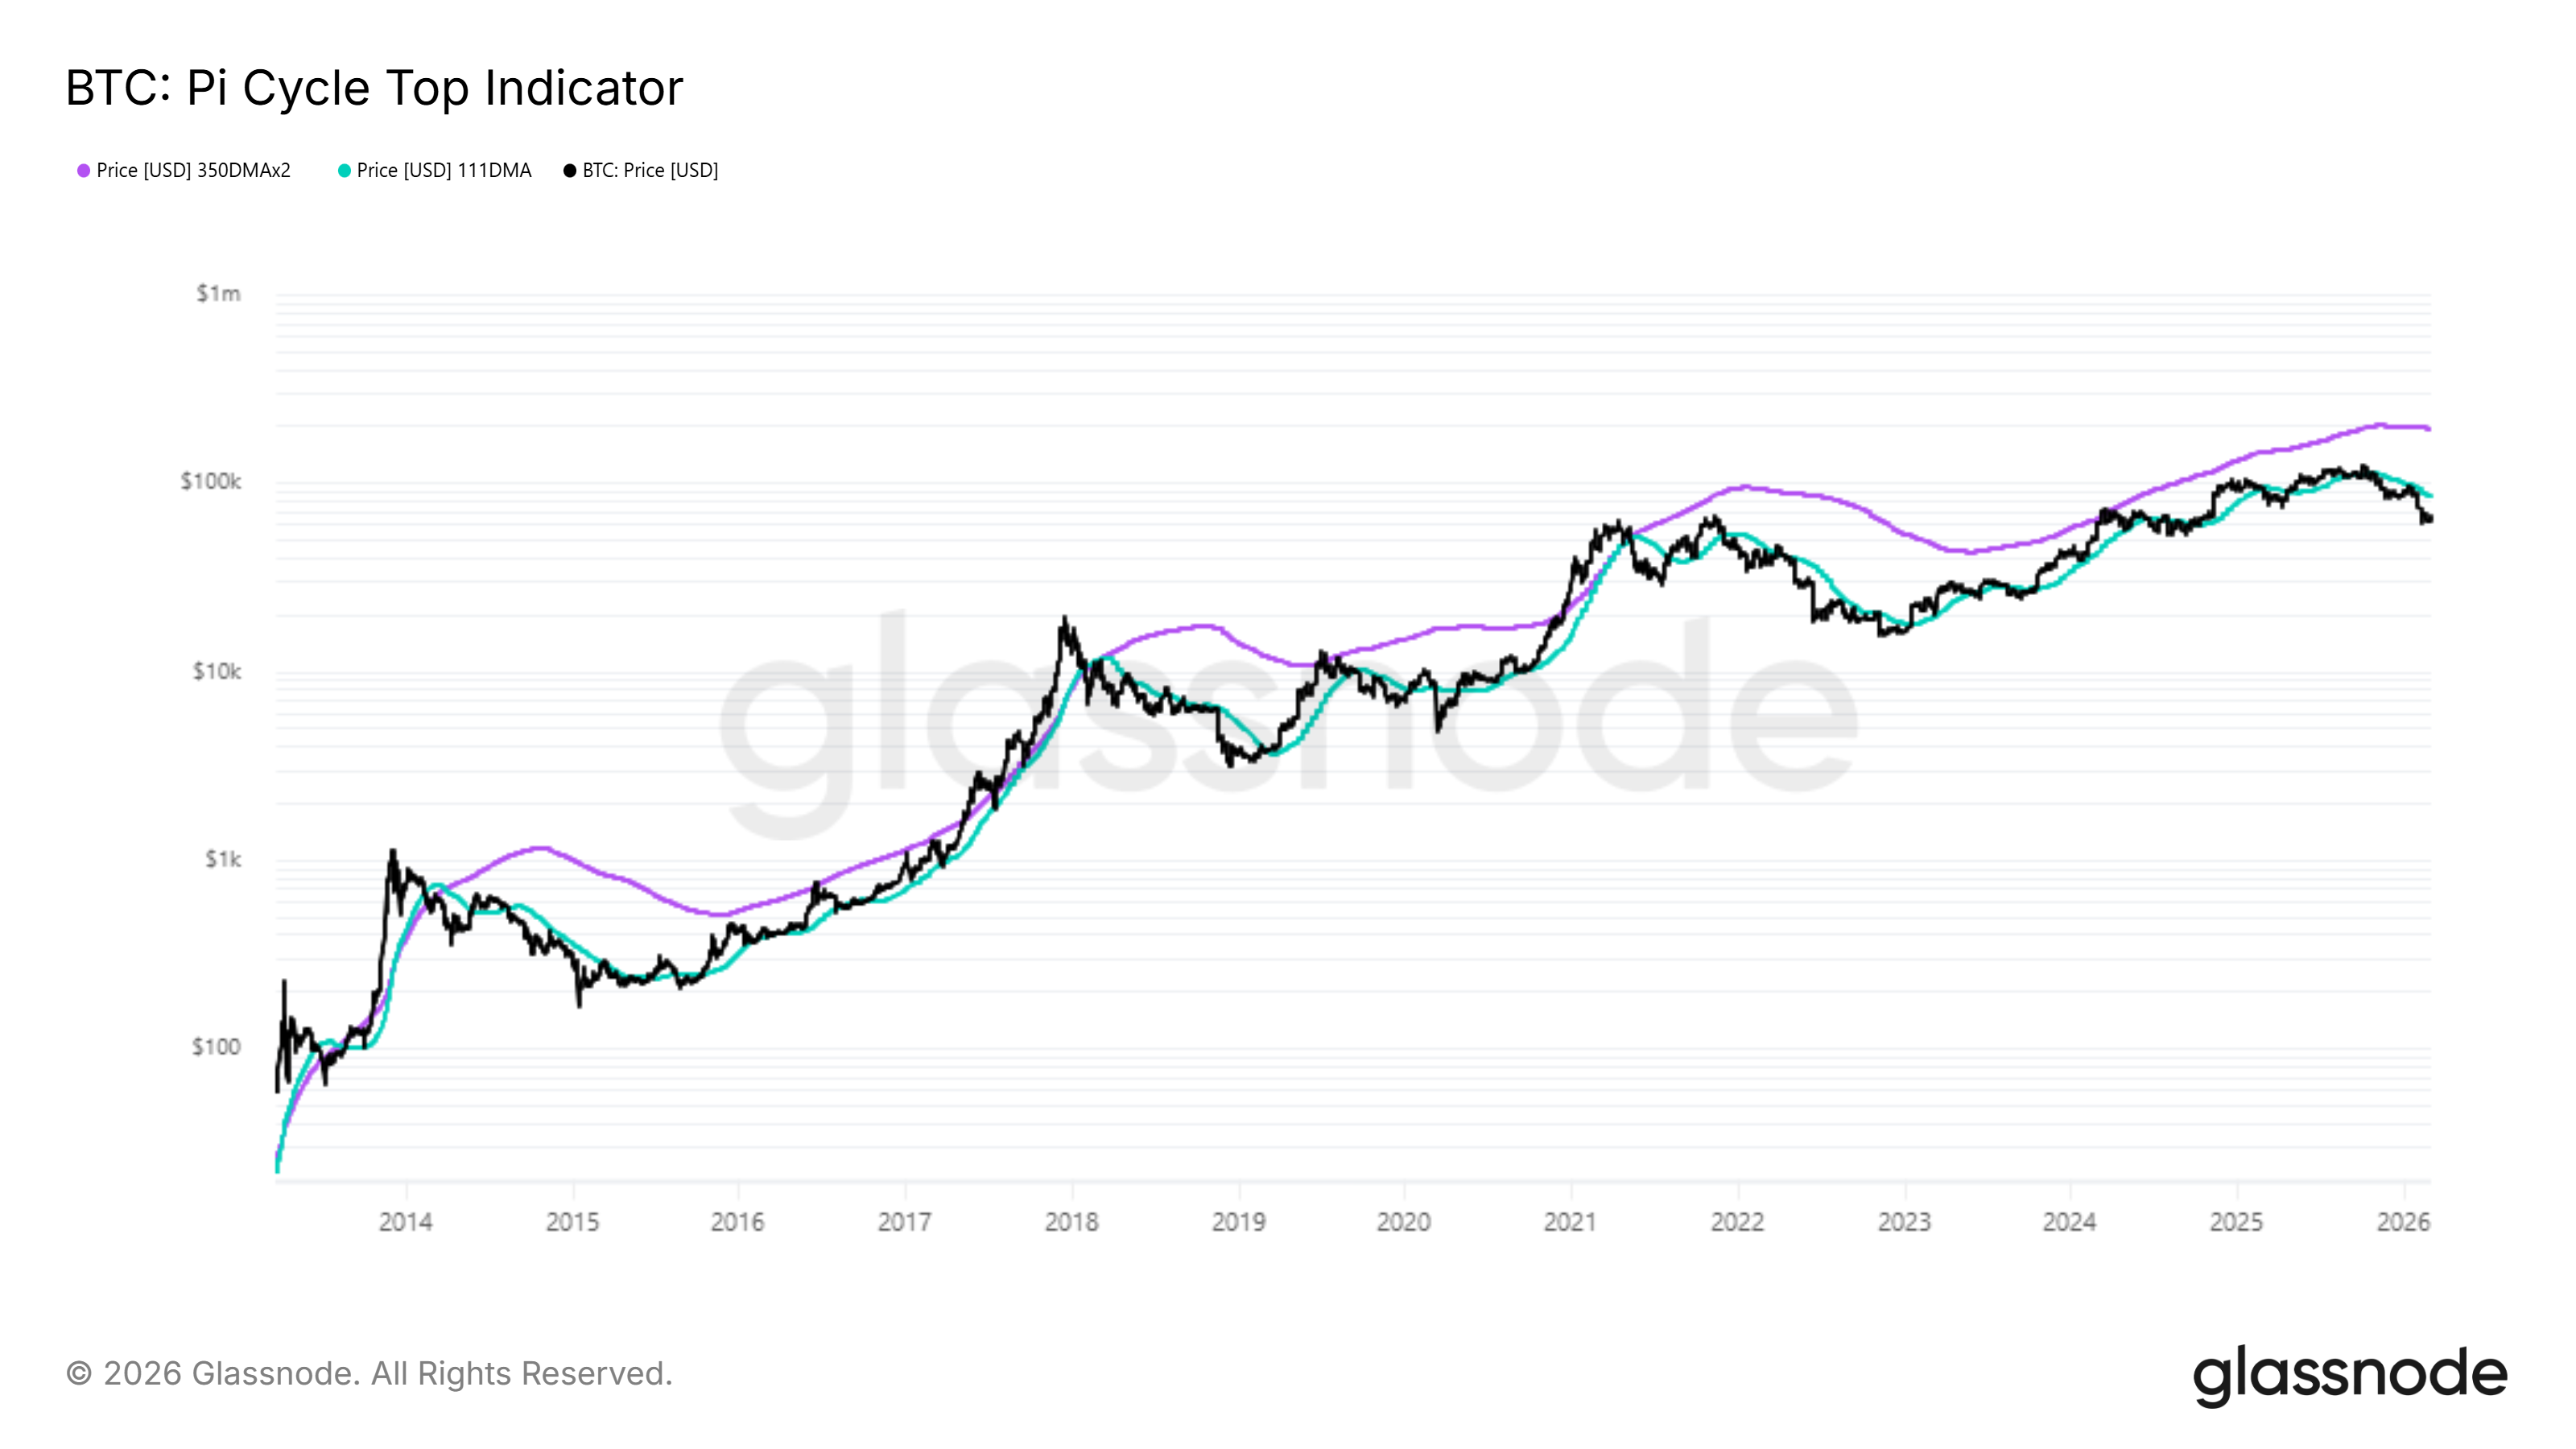
The Pi Cycle Top Indicator provides important context for Bitcoin’s current phase. This metric uses the 111-day moving average and a two-times multiple of the 350-day moving average. When these averages converge, the market is considered overheated.
Conversely, when the moving averages diverge widely, the asset is often viewed as undervalued. In the present cycle, Bitcoin does not exhibit either extreme. Instead, it appears positioned at the midpoint of a broader bearish phase.
Historically, mid-cycle bearish periods within Bitcoin’s four-year cycle have lasted a year or longer. Similar structures in past cycles kept BTC suppressed before the eventual recovery.
Current divergence between the 111 SMA and the 350 SMA x2 suggests continued bearishness rather than recovery.
Want more token insights like this? Sign up for Editor Harsh Notariya’s Daily Crypto Newsletter here.
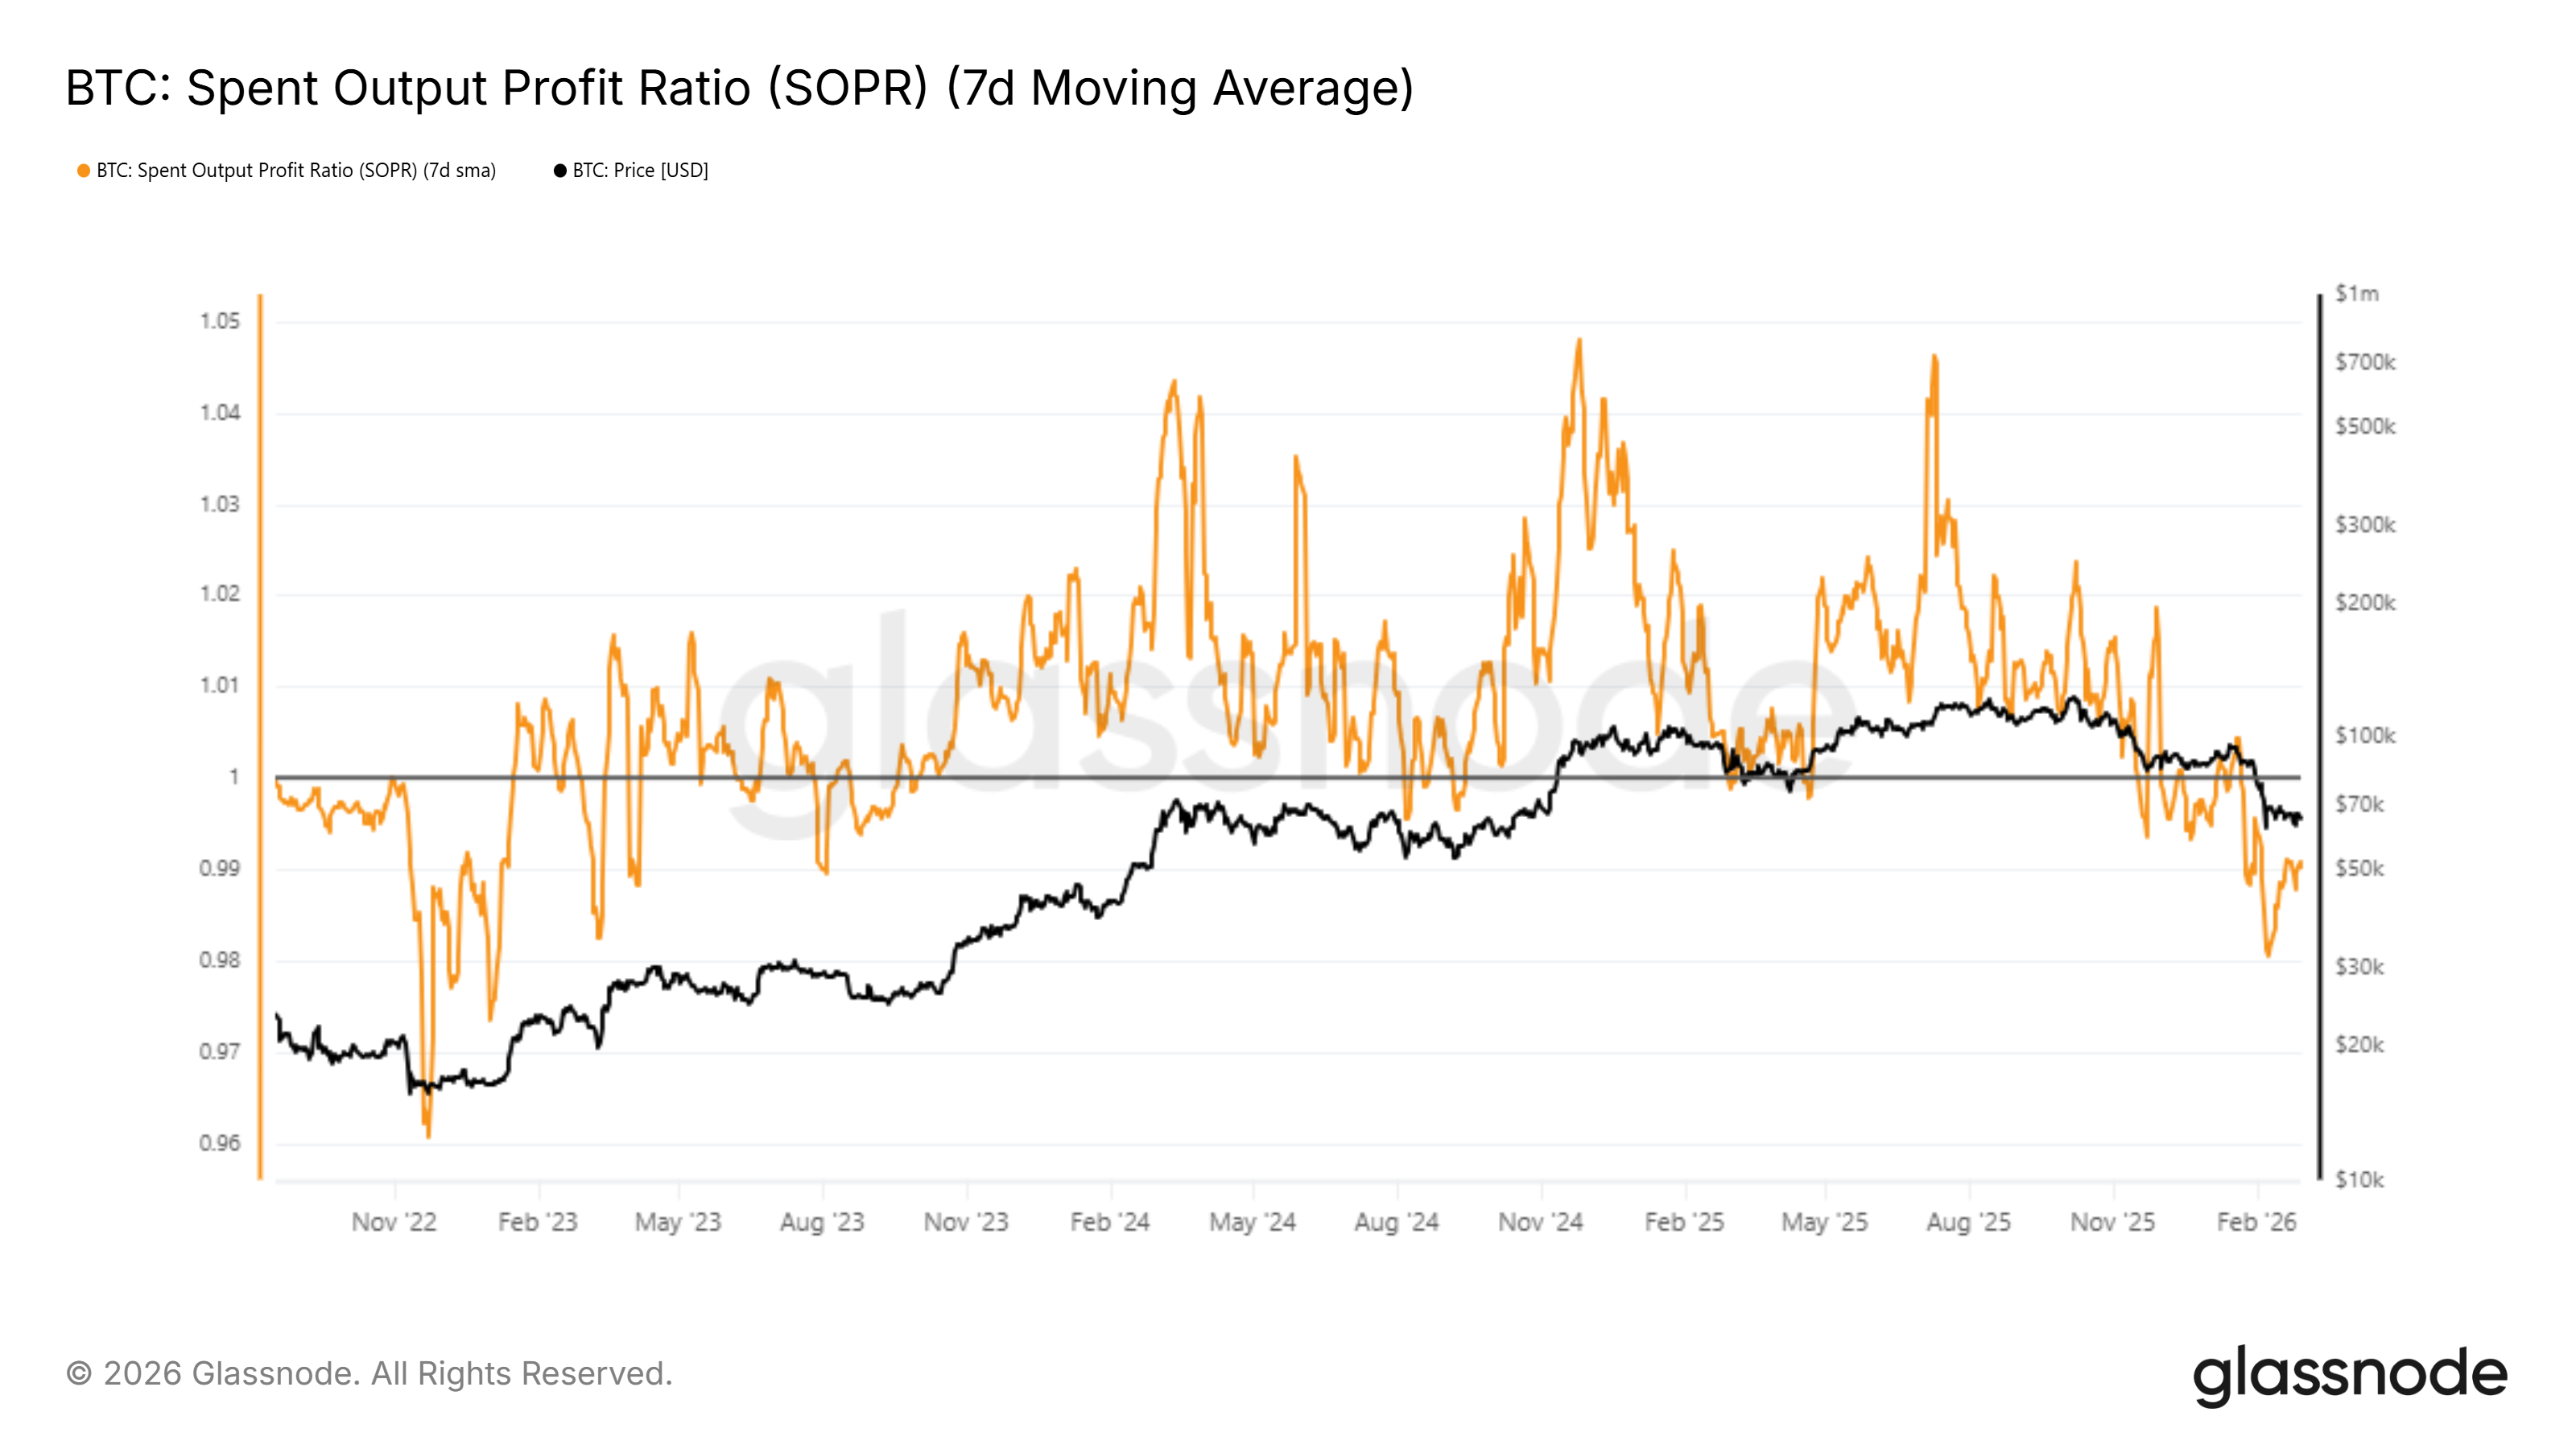
The Spent Output Profit Ratio further reinforces the cautious outlook. SOPR remains below the critical 1 level, signaling that many investors are selling at a loss. Persistent readings under 1 indicate limited profitability across market participants.
This dynamic suppresses recovery attempts. Bitcoin investors selling at a loss often reflect fear-driven behavior. Until SOPR consistently moves above 1, the Bitcoin price may struggle to build sustainable upside momentum.
BTC Price Downtrend Continues
Bitcoin is trading at $66,443 at the time of writing, still confined under a descending resistance line active for nearly a month. Repeated failures to break above this barrier highlight ongoing weakness. Without stronger buying pressure, BTC may remain trapped beneath this trendline.
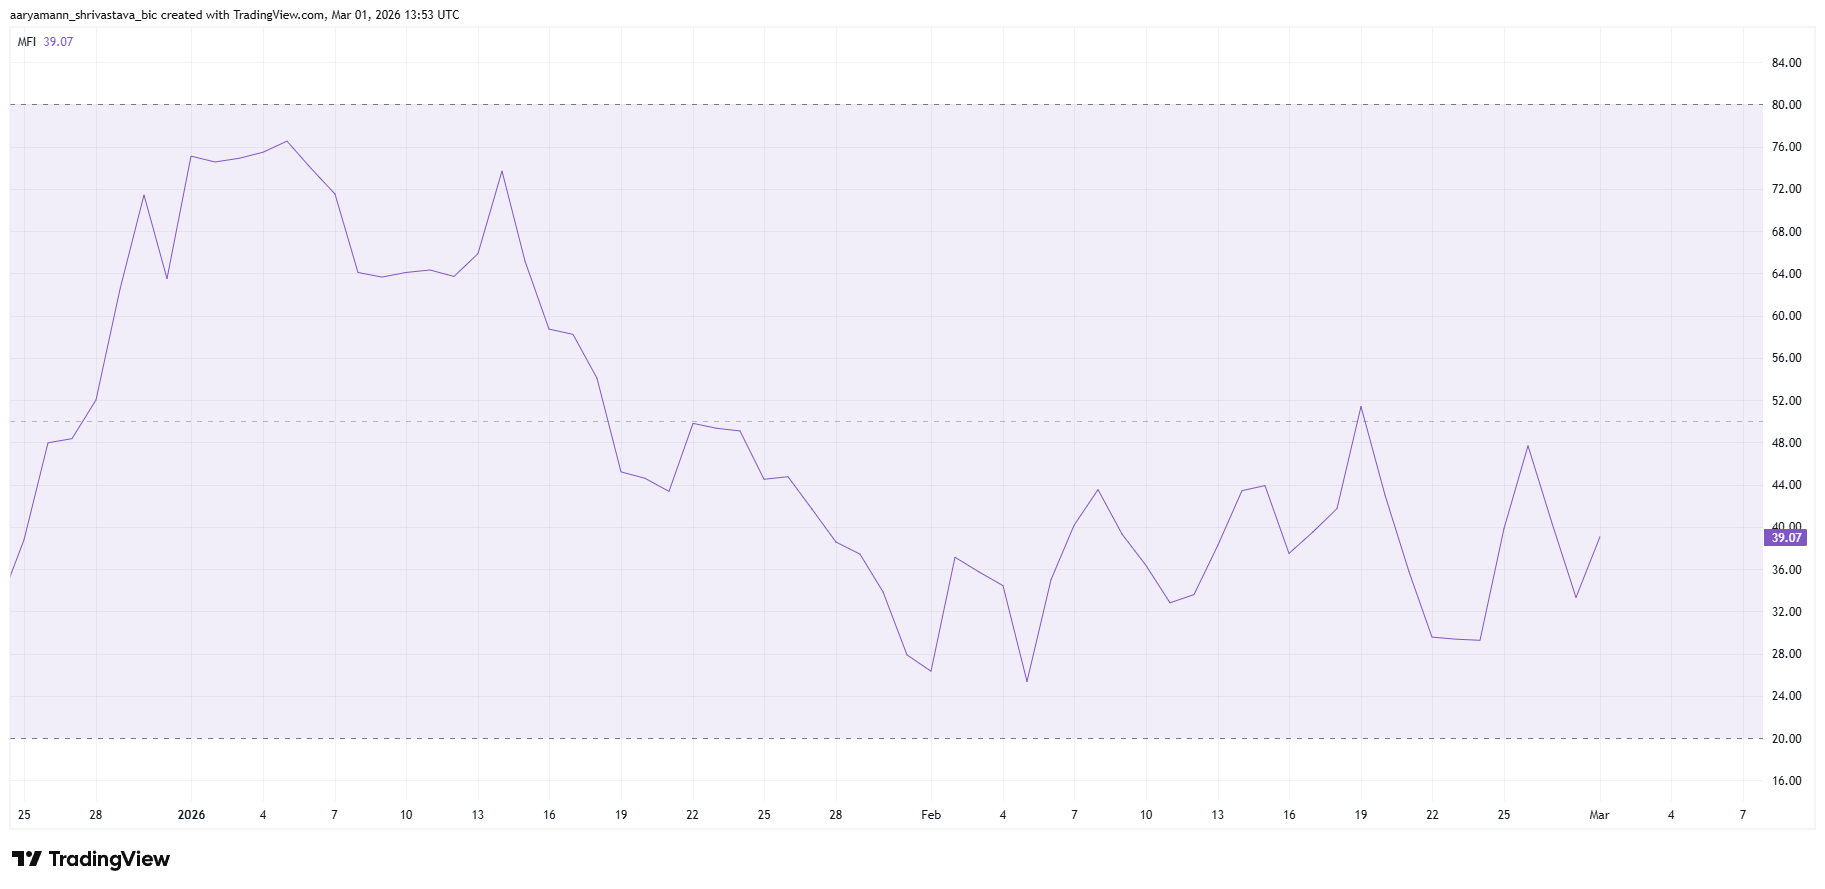
The Money Flow Index shows active selling pressure. MFI readings indicate capital outflows continue to dominate inflows. Global macro uncertainty and geopolitical tensions are amplifying risk aversion. This environment encourages cautious positioning and limits aggressive accumulation.
Given these conditions, the Bitcoin price could continue oscillating within a constrained range. A break below $65,000 would likely expose the $62,893 support. That level has already been tested twice this week, increasing vulnerability if selling intensifies.
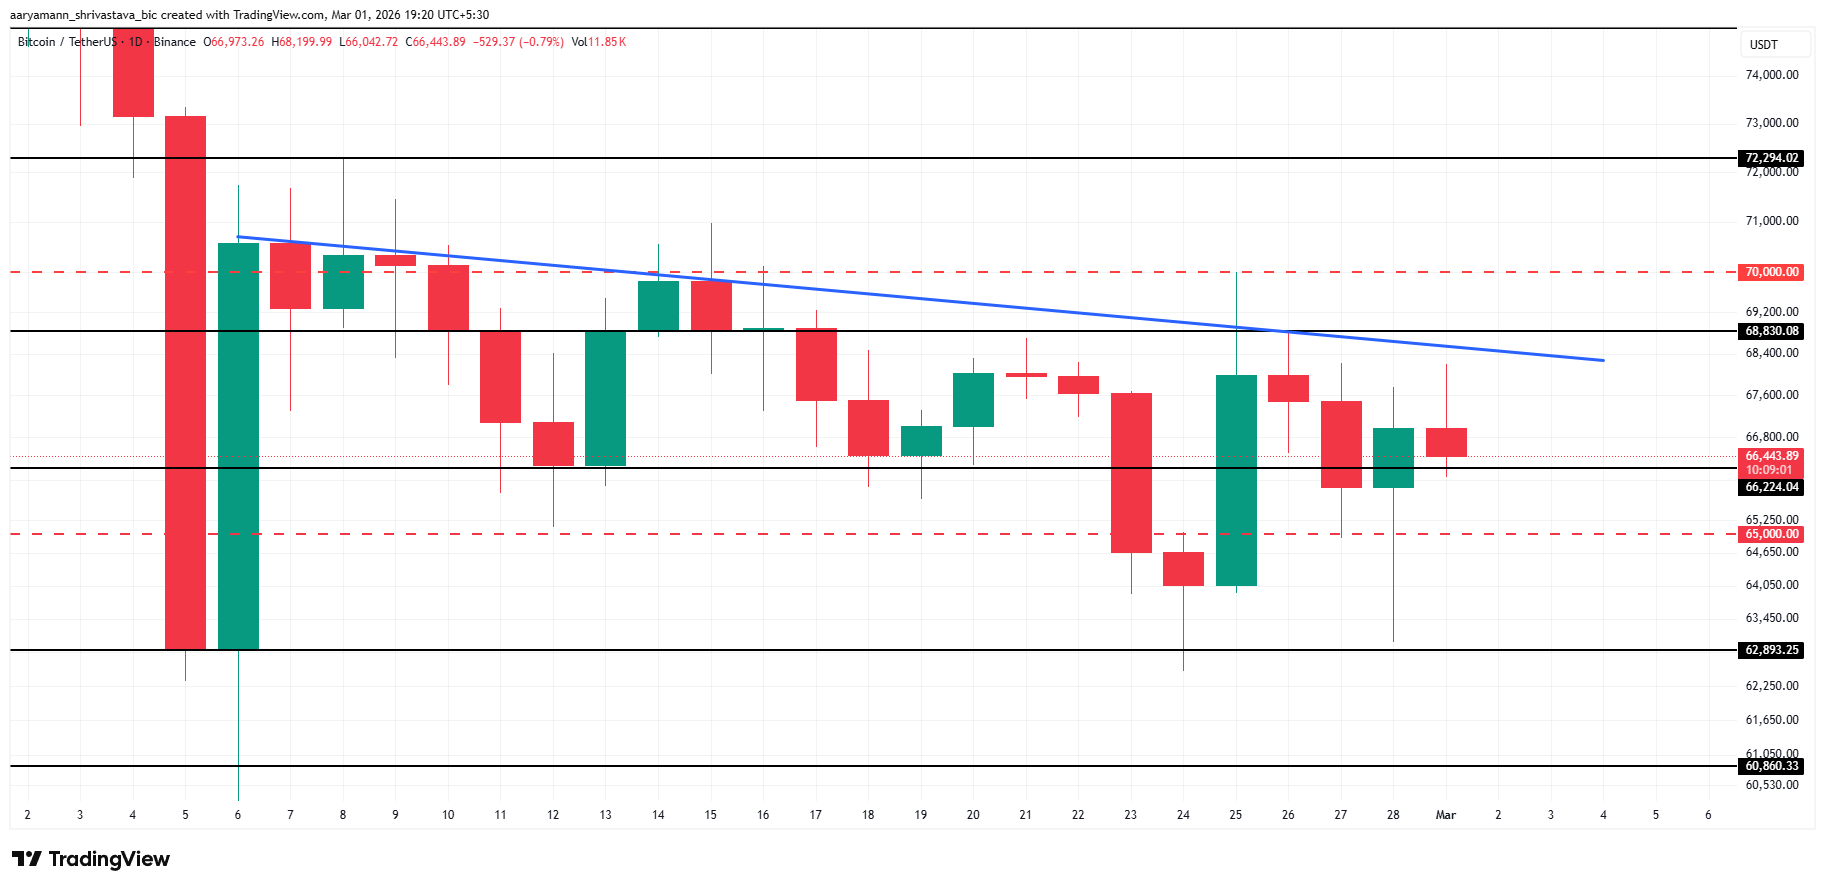
However, a shift in macro sentiment could alter the trajectory. If Bitcoin holds the $66,224 support and attracts fresh inflows, it may challenge $68,830 resistance.
A decisive move above $70,000 would invalidate the current bearish thesis and signal renewed structural strength.
The post Bitcoin Bear Market Could Get Worse Despite the Latest Relief Rally appeared first on BeInCrypto.
Read moreLatest News