Is Bitcoin Price Headed for a Relief Rally? Charts Have the Answer
The Bitcoin price has decreased by almost 2% over the last 24 hours and is down nearly 3% from yesterday’s peak. At first glance, nothing about the price appears exciting.
However, something beneath the chart, especially on-chain, has changed for the first time in almost three months, and something else changed this week. These two shifts do not confirm a rally as 2026 approaches, but they might be the first building blocks of one.
A Momentum Shift Begins, but Needs Proof
Two signals have appeared simultaneously. They are separate, but the timing matters.
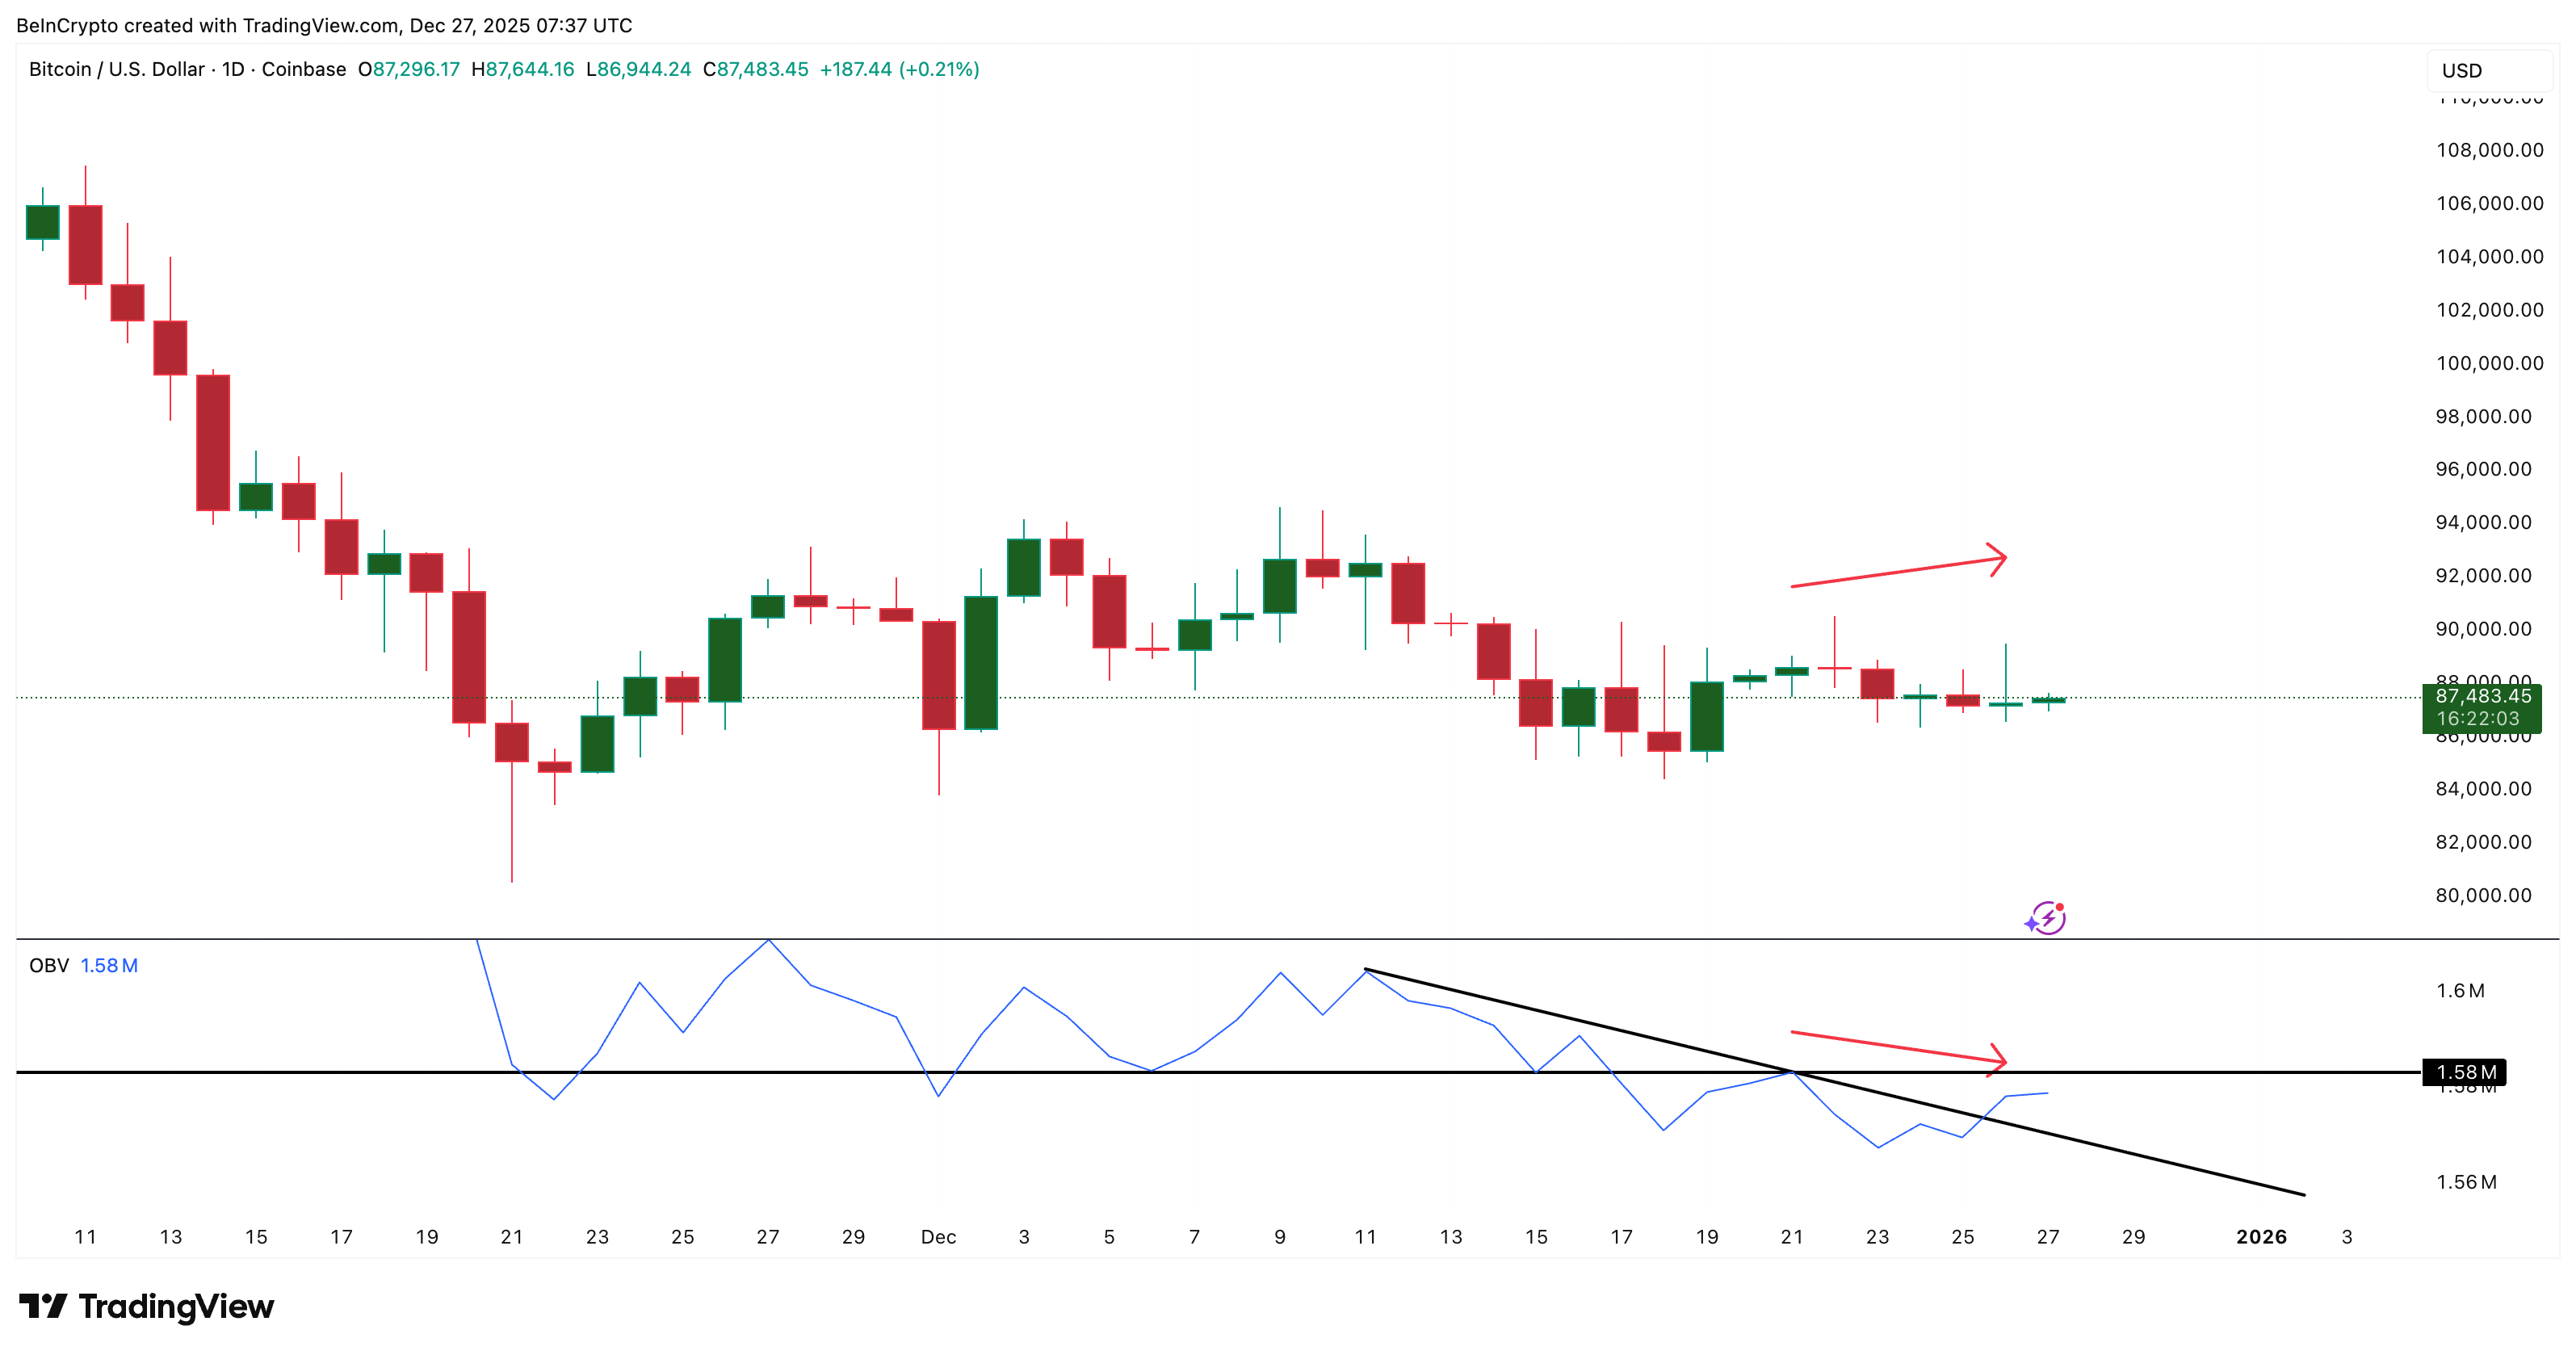
The first is the On-Balance Volume (OBV). OBV measures buying and selling pressure through volume. Between December 21 and December 26, Bitcoin’s price trended higher. OBV did not follow. It made lower highs. That is a bearish OBV divergence. It explains why the price failed to break through (long wick on December 26), as volume didn’t accompany the minor price rise.
Want more token insights like this? Sign up for Editor Harsh Notariya’s Daily Crypto Newsletter here.
This week, OBV broke above the trend line that connected those lower highs. That breakout suggests stronger buying pressure is forming. The signal is not confirmed until OBV makes a higher high above 1.58 million. If that happens, the Bitcoin price could finally react. That has not happened yet.
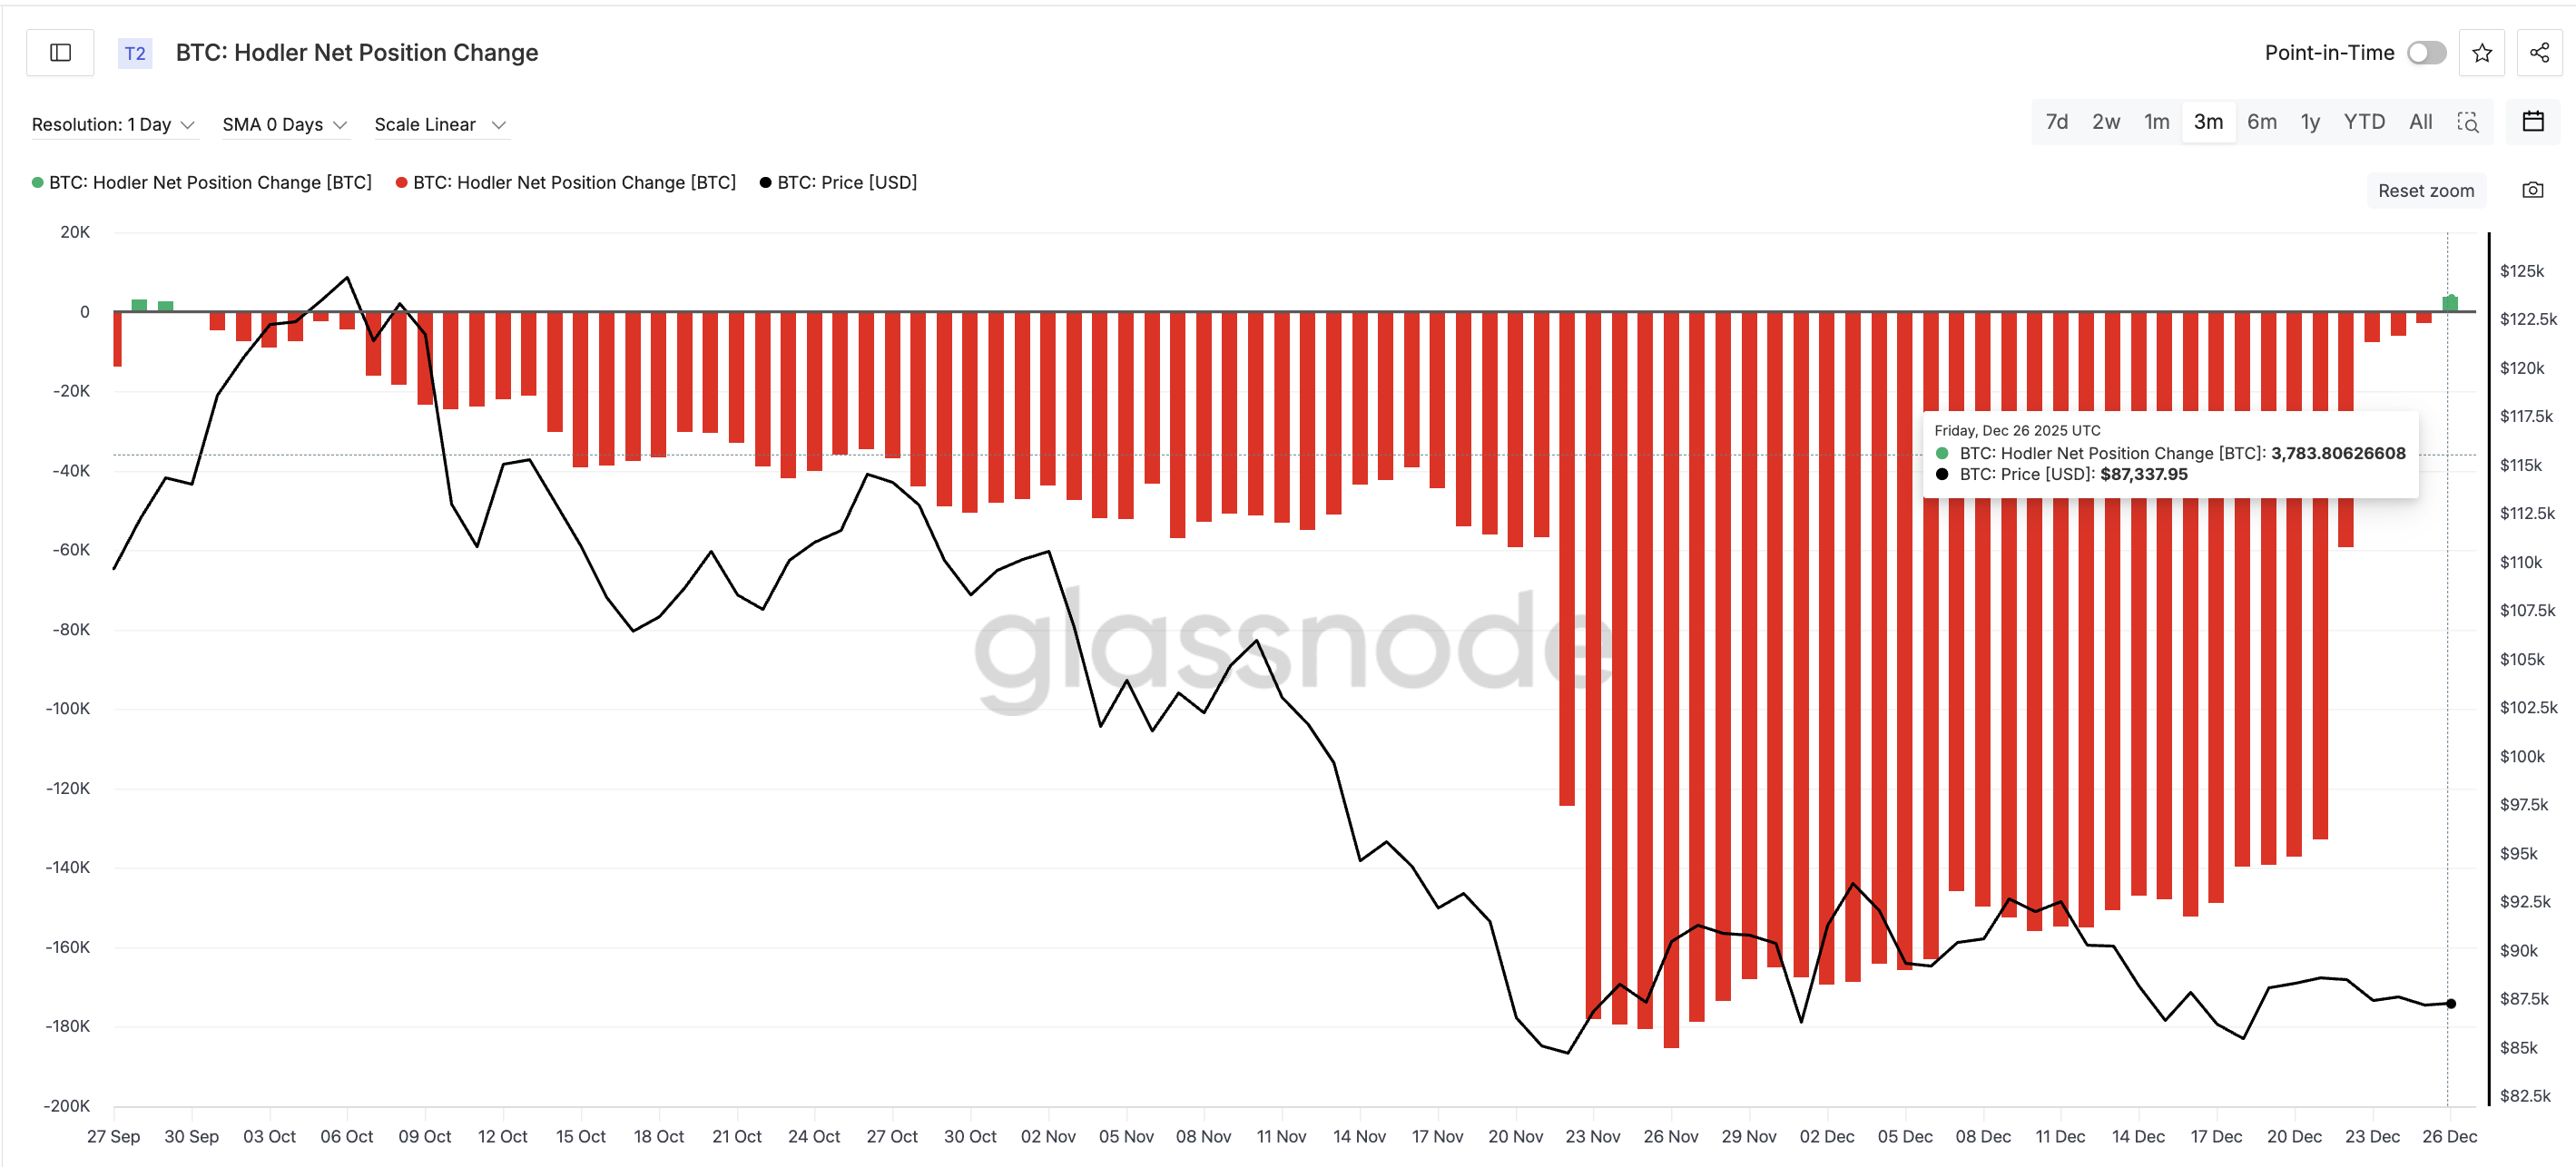
The second signal comes from the Hodler net position change metric. This tracks wallets that hold for longer than 155 days. They are the slowest movers in the market.
On December 26, this metric flipped positive for the first time since late September. Long-term holders added 3,783.8 BTC. They do not buy for short-term moves. They buy for conviction. And this is the first time in almost three months that conviction has shown up.
A relief rally needs both sides. OBV must follow through. Hodlers must continue adding. One without the other is not enough.
The Bitcoin Price Map That Decides Year-End Or Early 2026
The Bitcoin price still has work to do. Price levels tell the real story.
Bitcoin has failed to reclaim $90,840 for almost two weeks. That level rejected the price on December 12 and has blocked every attempt since. Until price clears that level, every bounce feels temporary.
Above $90,840, the first real relief rally checkpoint sits near $97,190. The BTC price fell below that level on November 14.
If the rally extends, $101,710 and $107,470 are the next zones.
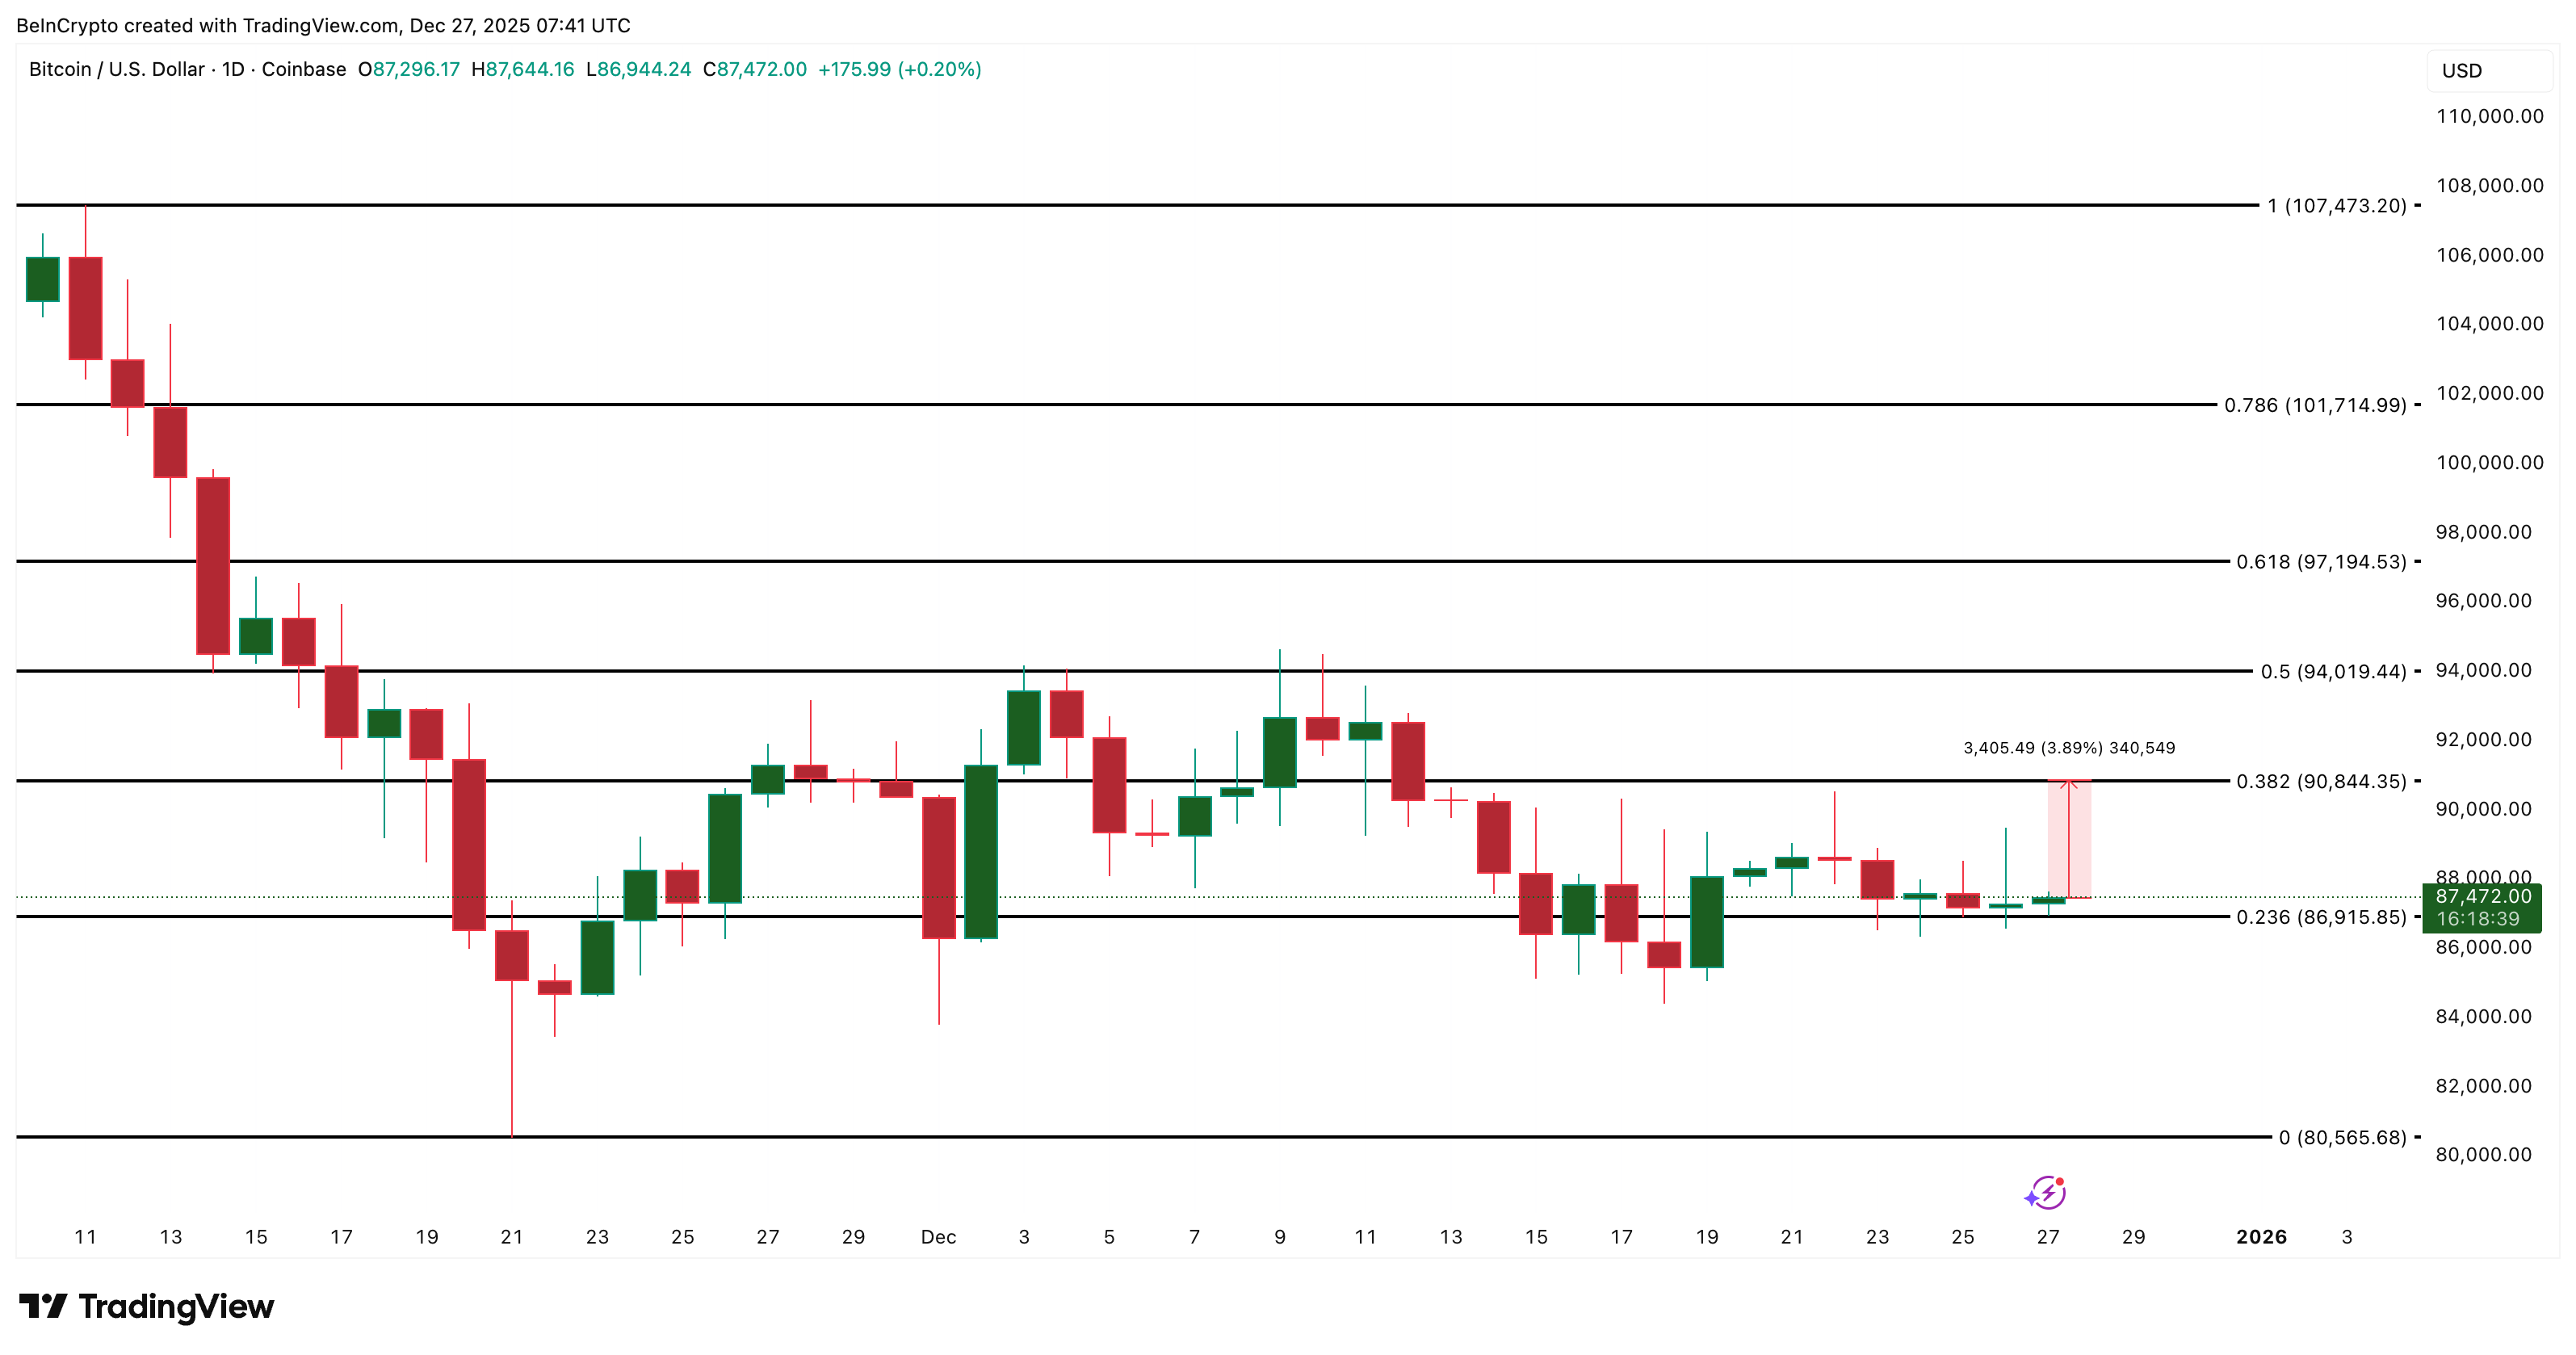
On the downside, support sits at $86,915. It has held since December 19. Losing it opens room to $80,560. Low year-end liquidity increases that risk. For now, based on how long-term investors are positioning, the Bitcoin price can attempt a relief rally toward $90,840 and even beyond if the support at $86,910 holds.
The post Is Bitcoin Price Headed for a Relief Rally? Charts Have the Answer appeared first on BeInCrypto.
Read moreLatest News