
XLM Price Struggles Despite Steller’s On-Chain Growth – What’s Next?
Stellar (XLM) price has shown small signs of recovery (up 2.8% in seven days). But the broader trend still leans bearish. Over the past three months, XLM has dropped nearly 29%, struggling to build momentum despite brief bounces.
Now, traders are watching one crucial level. That level could decide whether this rebound evolves into a full recovery or fades into another leg down.
Bearish Divergence Returns as Social Buzz Peaks
Even as the project posts strong on-chain growth and rising chatter across social platforms, its chart continues to show signs of weakness.
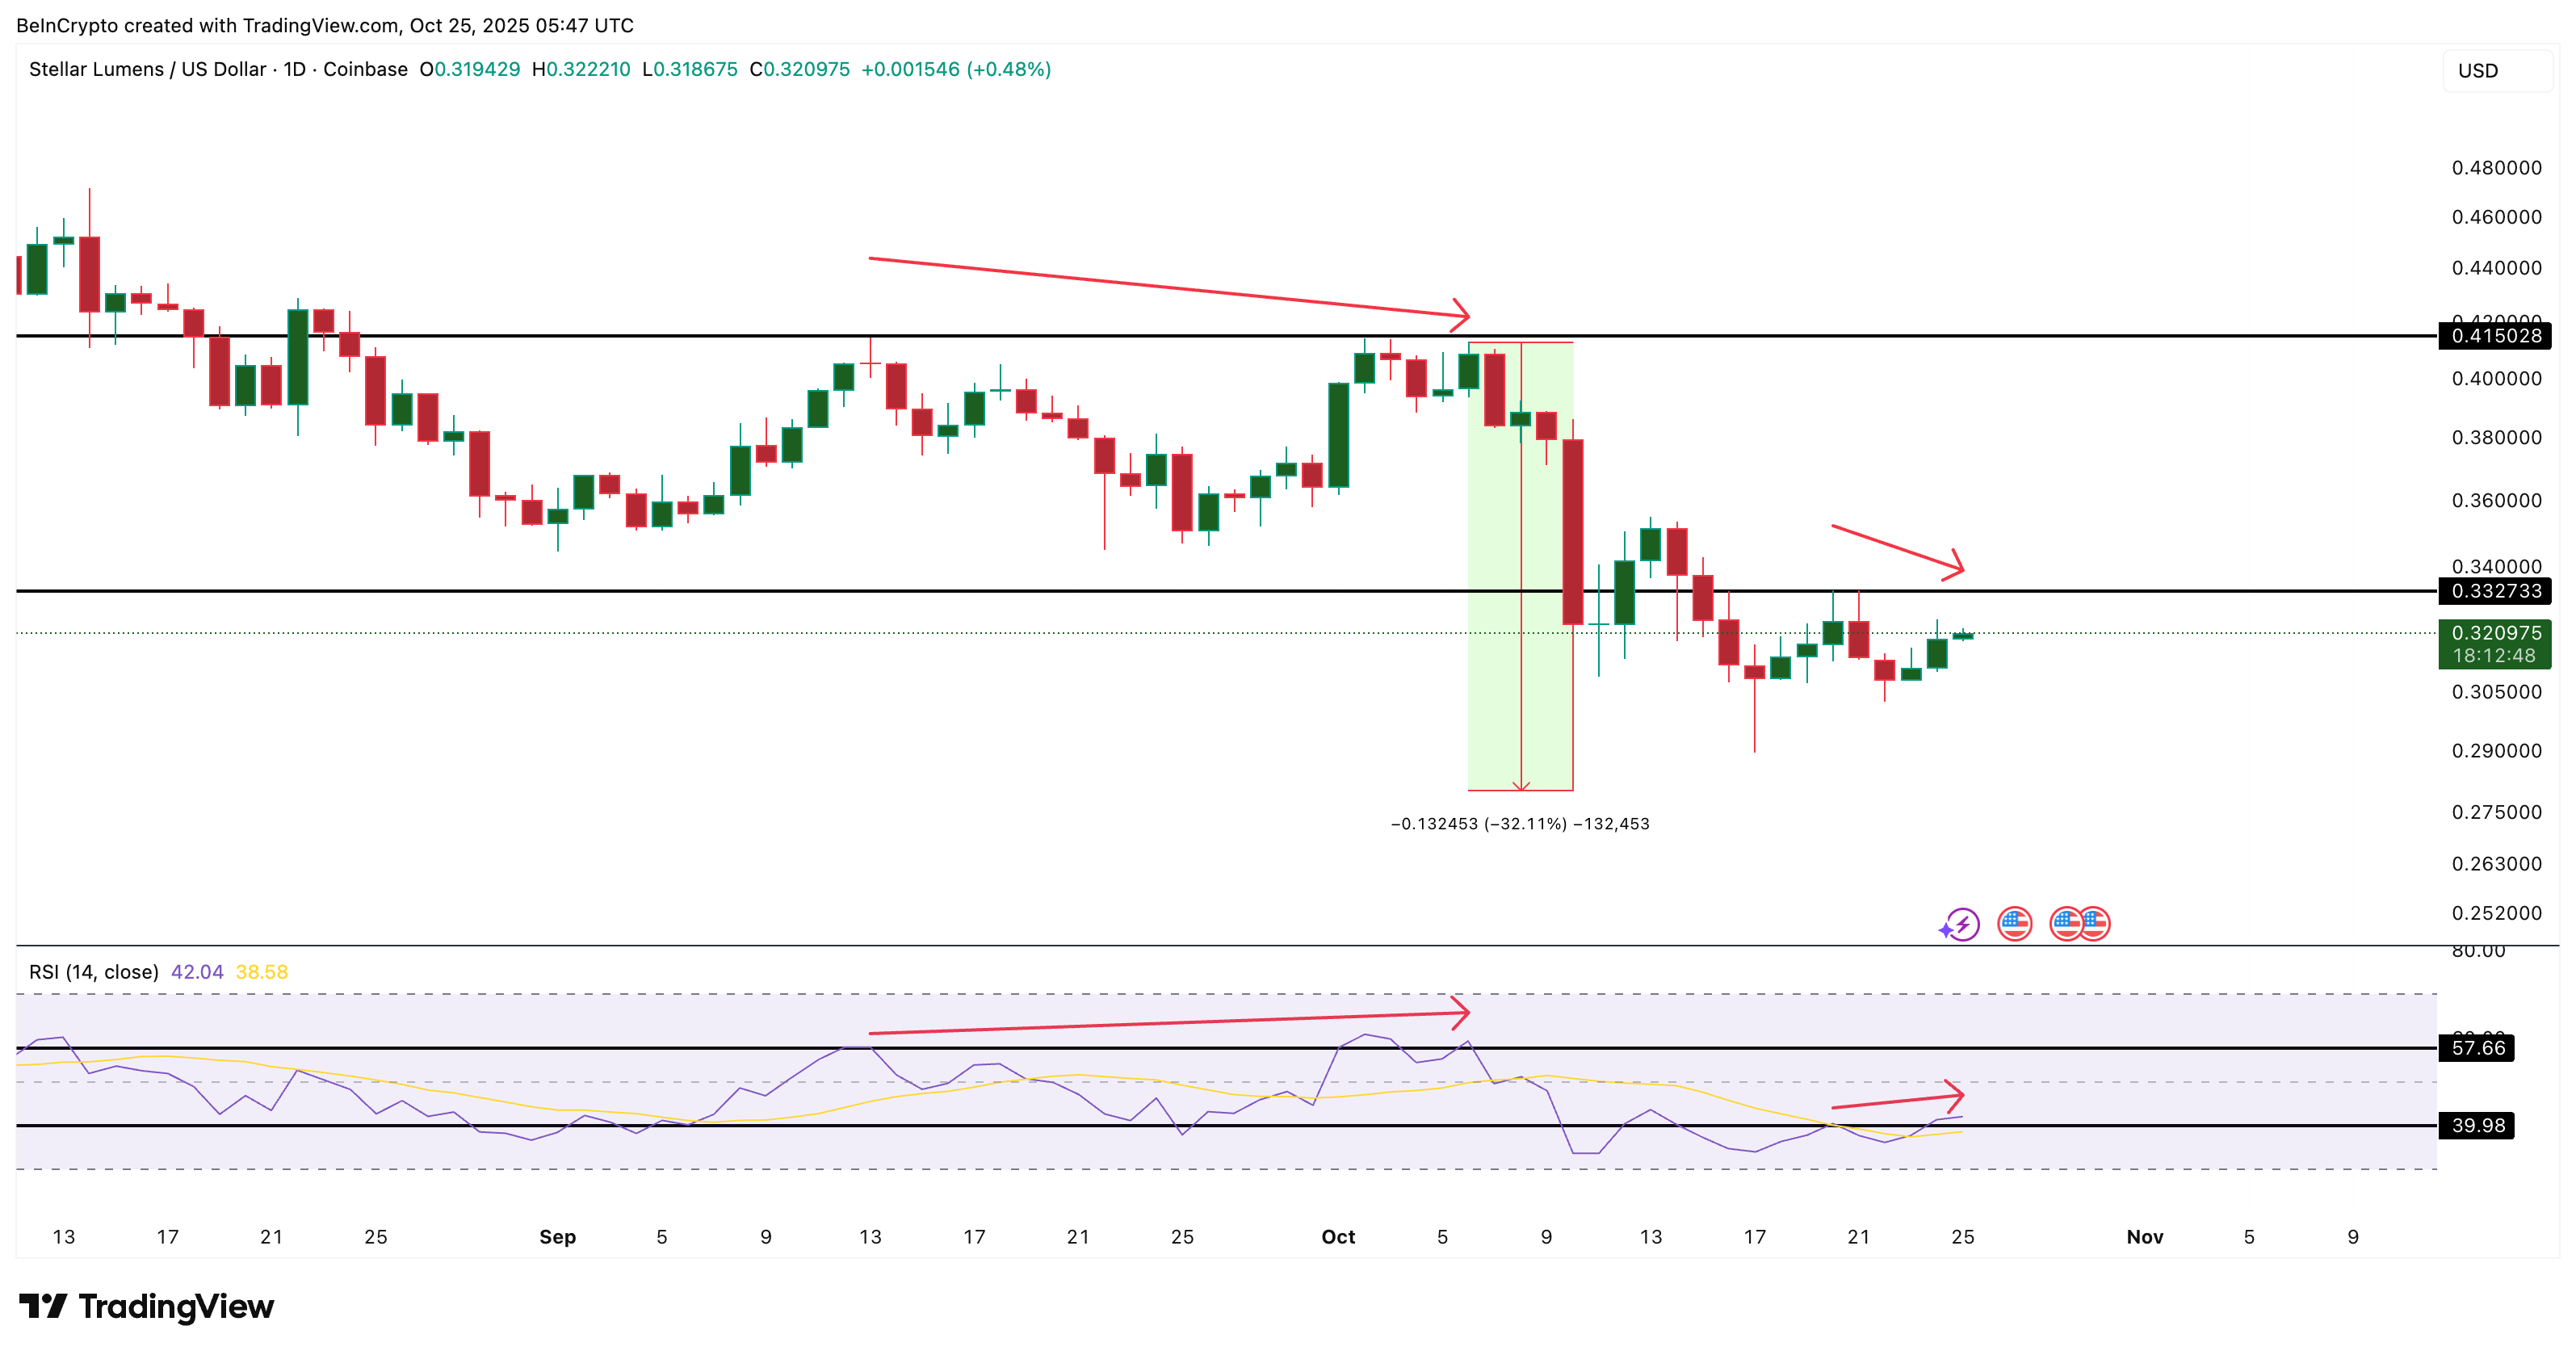
The Relative Strength Index (RSI), which measures buying versus selling strength, is flashing a hidden bearish divergence — a setup that often appears when momentum weakens during a short-term bounce.
Between October 20 and 25, XLM made a lower high, while RSI made a higher high, showing that the upward push is losing energy even as price edges higher.
This could be due to broader selling pressure continuing to weigh on buyers. A similar setup appeared between September 13 and October 6, followed by a sharp 32% correction. With the same divergence forming again, traders are watching closely for another dip.
Want more token insights like this? Sign up for Editor Harsh Notariya’s Daily Crypto Newsletter here.
Interestingly, the market narrative looks very different outside the chart. Stellar’s tokenized real-world asset (RWA) value — or the total worth of real-world assets on its network — has jumped 26.51% in 30 days to $638.8 million.
The growth has fueled a sharp increase in social dominance in October. The metric even climbed from 0.648% to 0.794% over the past 24 hours.
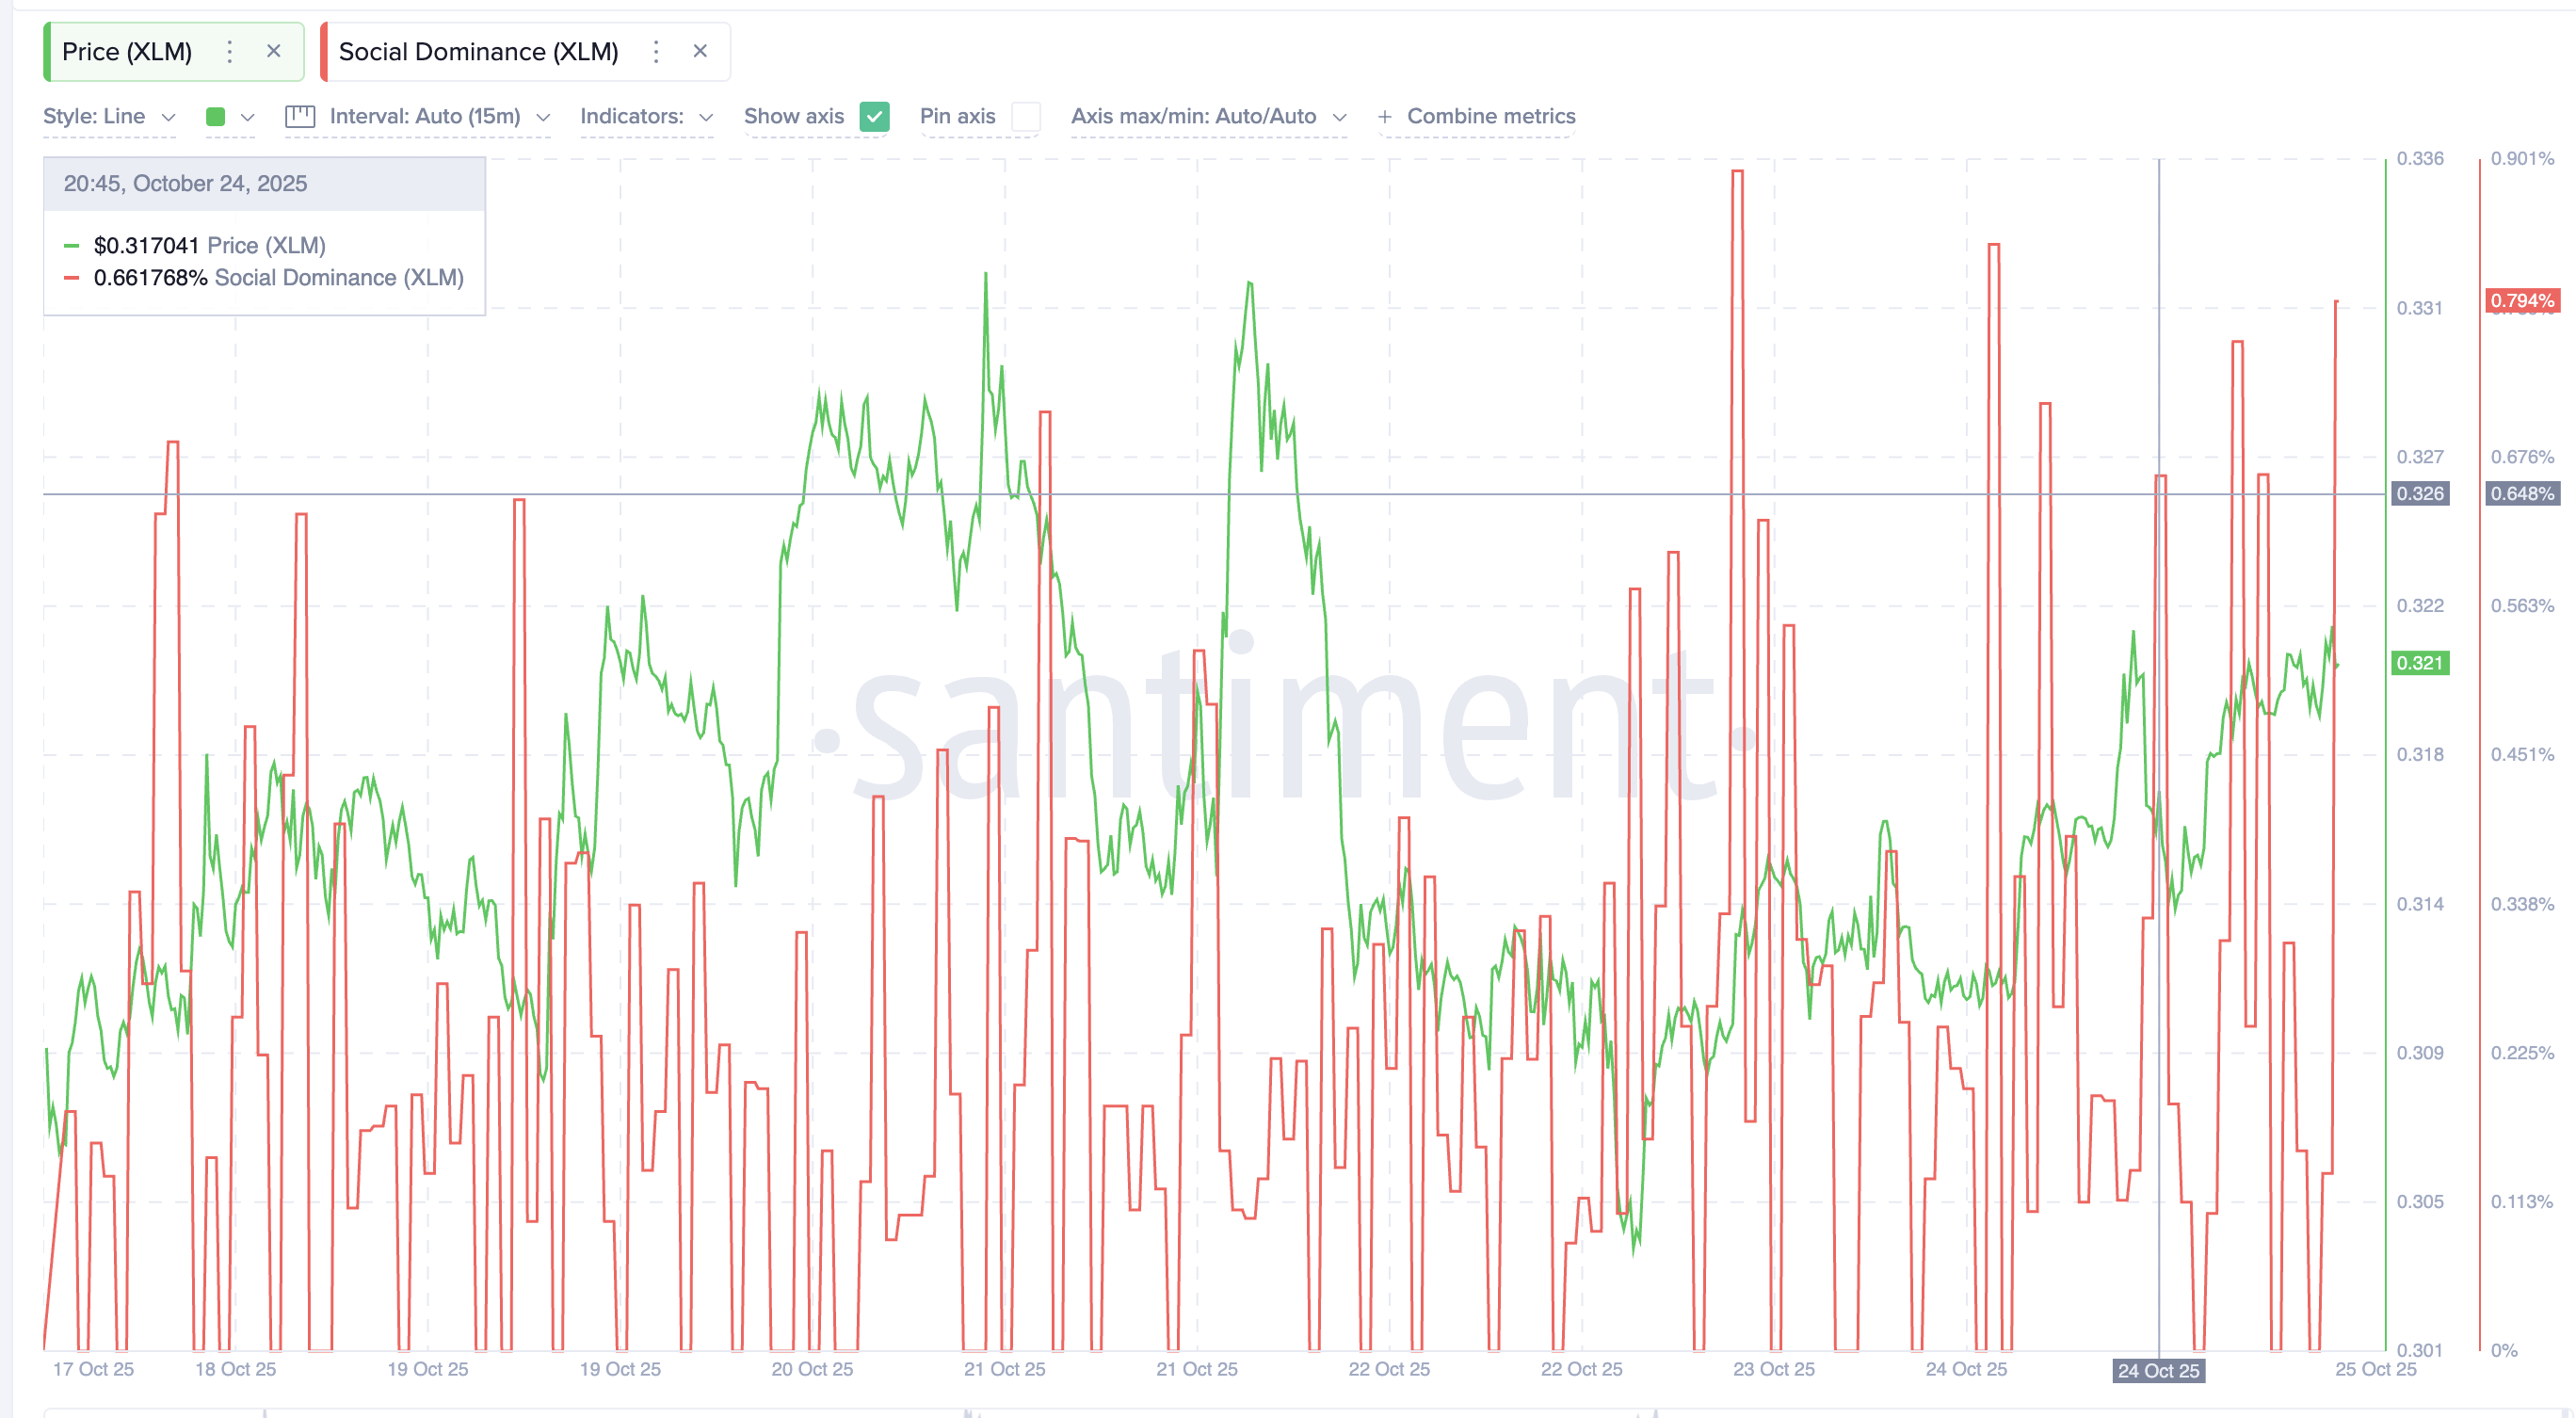
This means more people are talking about Stellar, but the data shows they’re not buying aggressively yet. The divergence between attention and action reflects the gap between fundamentals and XLM price performance.
Bearish Pattern Holds XLM Price Back Below $0.38
On the daily chart, XLM remains trapped inside a descending channel, where every move higher gets met with renewed selling. The bearish structure confirms that bears still dominate, and short-lived rallies are yet to shift the broader trend.
For the XLM price to show strength, it needs a clean breakout above $0.38, the upper boundary of the channel. That would mark at least a 20% rise from current levels and could flip short-term sentiment neutral to bullish, from bearish.
A further move above $0.41 — a key zone that’s blocked several Stellar rally attempts since September — would confirm a possible trend reversal.
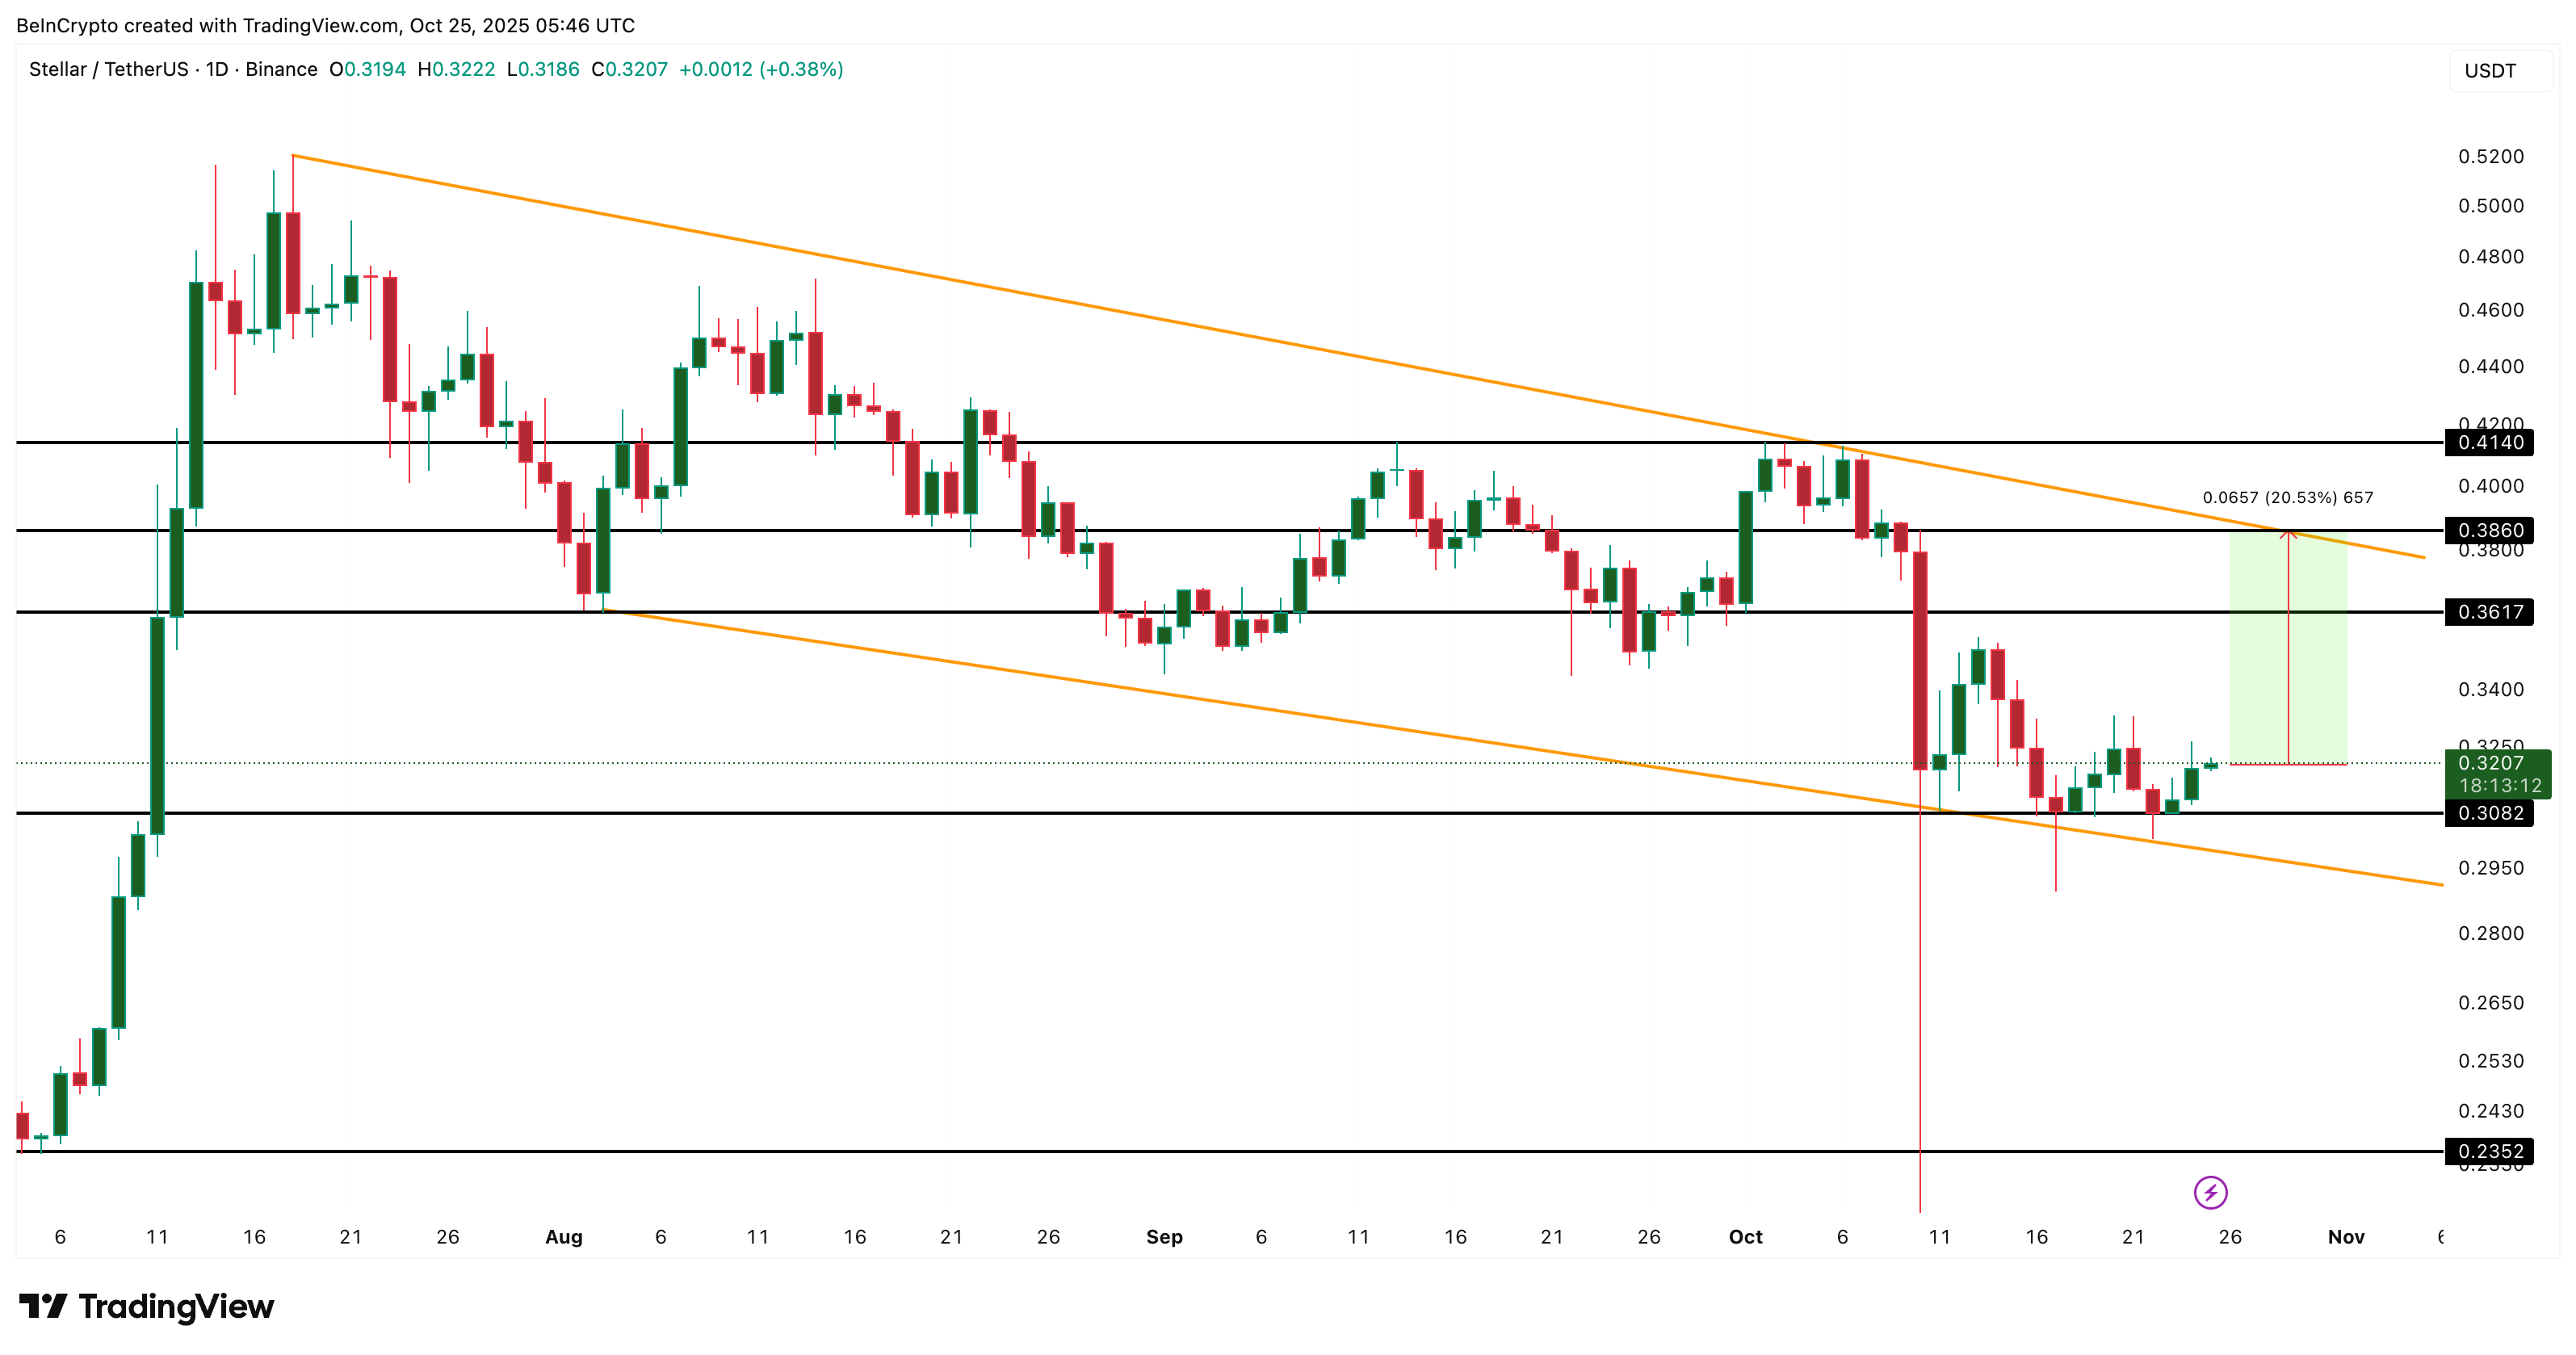
On the downside, support lies near $0.30. Failure to hold it could drag the token toward $0.23, the next strong demand zone.
The post XLM Price Struggles Despite Steller’s On-Chain Growth – What’s Next? appeared first on BeInCrypto.
Read moreLatest News