
Cardano (ADA) Bulls Gain Ground as Selling Pressure Weakens
Cardano (ADA) is down nearly 8% over the past 30 days but has gained almost 3% in the last 24 hours as short-term momentum picks up.
The token’s market cap stands at $26 billion, while its trading volume has surged 30% in the past day, reaching $903 million. Technical indicators are starting to show early signs of a potential trend reversal after a period of bearish pressure. Here’s a closer look at the key signals and price levels shaping ADA’s outlook this week.
ADA BBTrend Is Now Positive After 6 Days
Cardano’s BBTrend has just turned positive, ending a six-day streak in negative territory, which included a low of -26.13 on March 12. The indicator is now sitting at 0.83, signaling a shift in momentum after the recent downtrend.
While this is still a relatively low reading, the move back into positive territory could be an early sign of strengthening buying pressure.
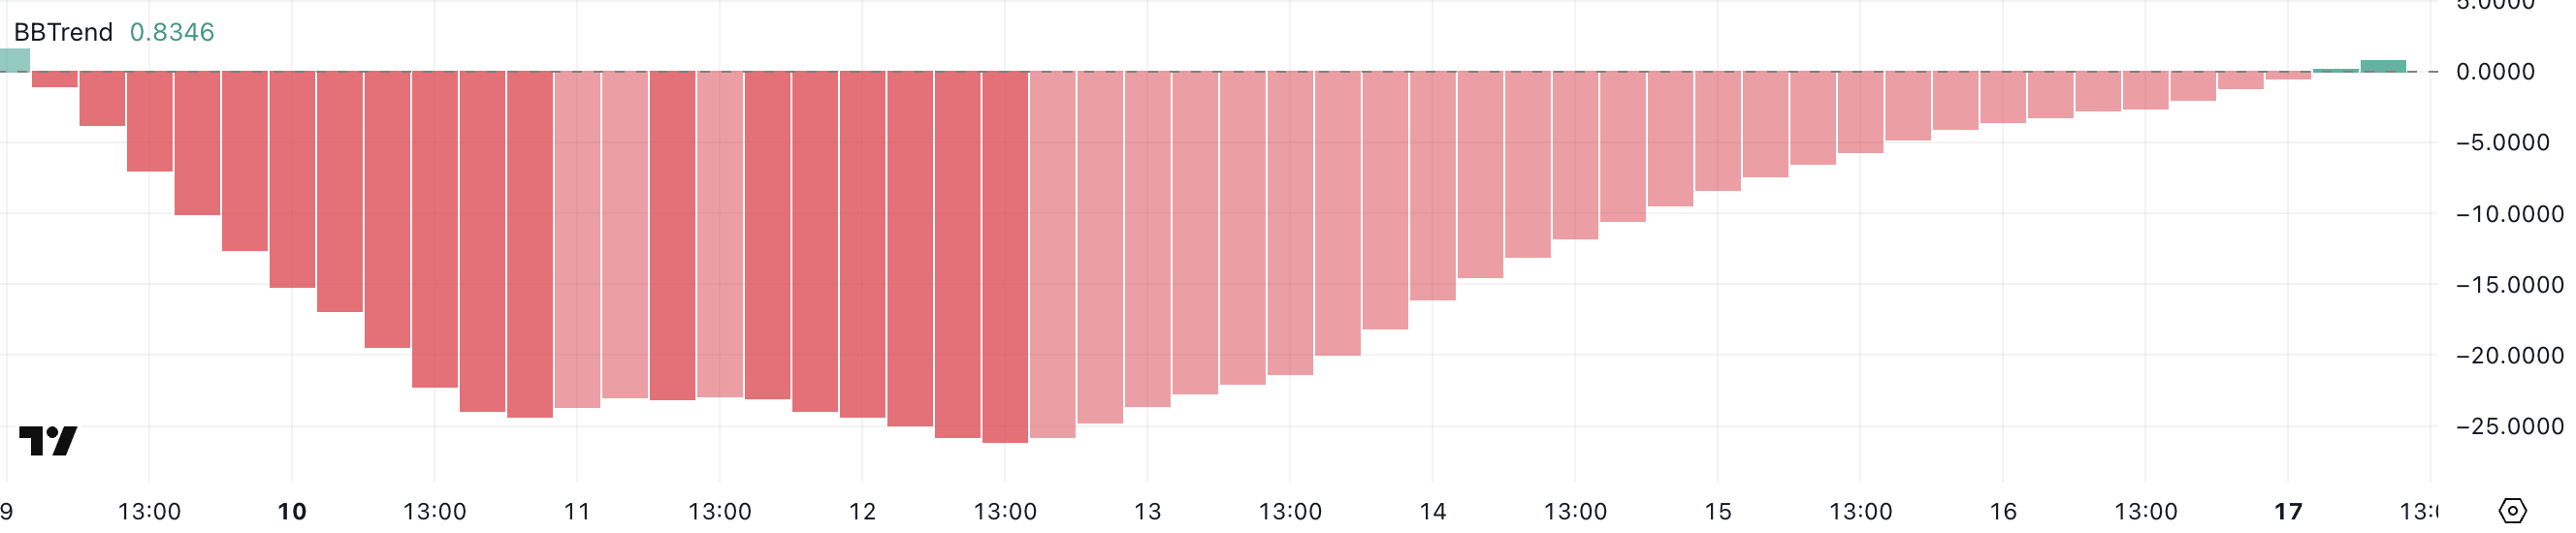
The BBTrend (Bollinger Band Trend) measures the strength and direction of price movement relative to the Bollinger Bands. Positive values indicate an uptrend, while negative values point to a downtrend.
Since ADA’s BBTrend hasn’t risen above 10 since March 8, the current reading of 0.83 suggests that, although the bearish pressure has eased, momentum remains weak. For a stronger bullish signal, traders would typically look for the BBTrend to push above 10, confirming a more decisive upward move.
Cardano DMI Shows Sellers Are Losing Control
Cardano’s DMI chart shows that its ADX has dropped to 13.7 from 17.5 in the past 24 hours, suggesting a weakening trend strength. While the ADX is still signaling a trend, the lower reading points to reduced momentum compared to the previous day.
The Average Directional Index (ADX) measures the strength of a trend, regardless of its direction.
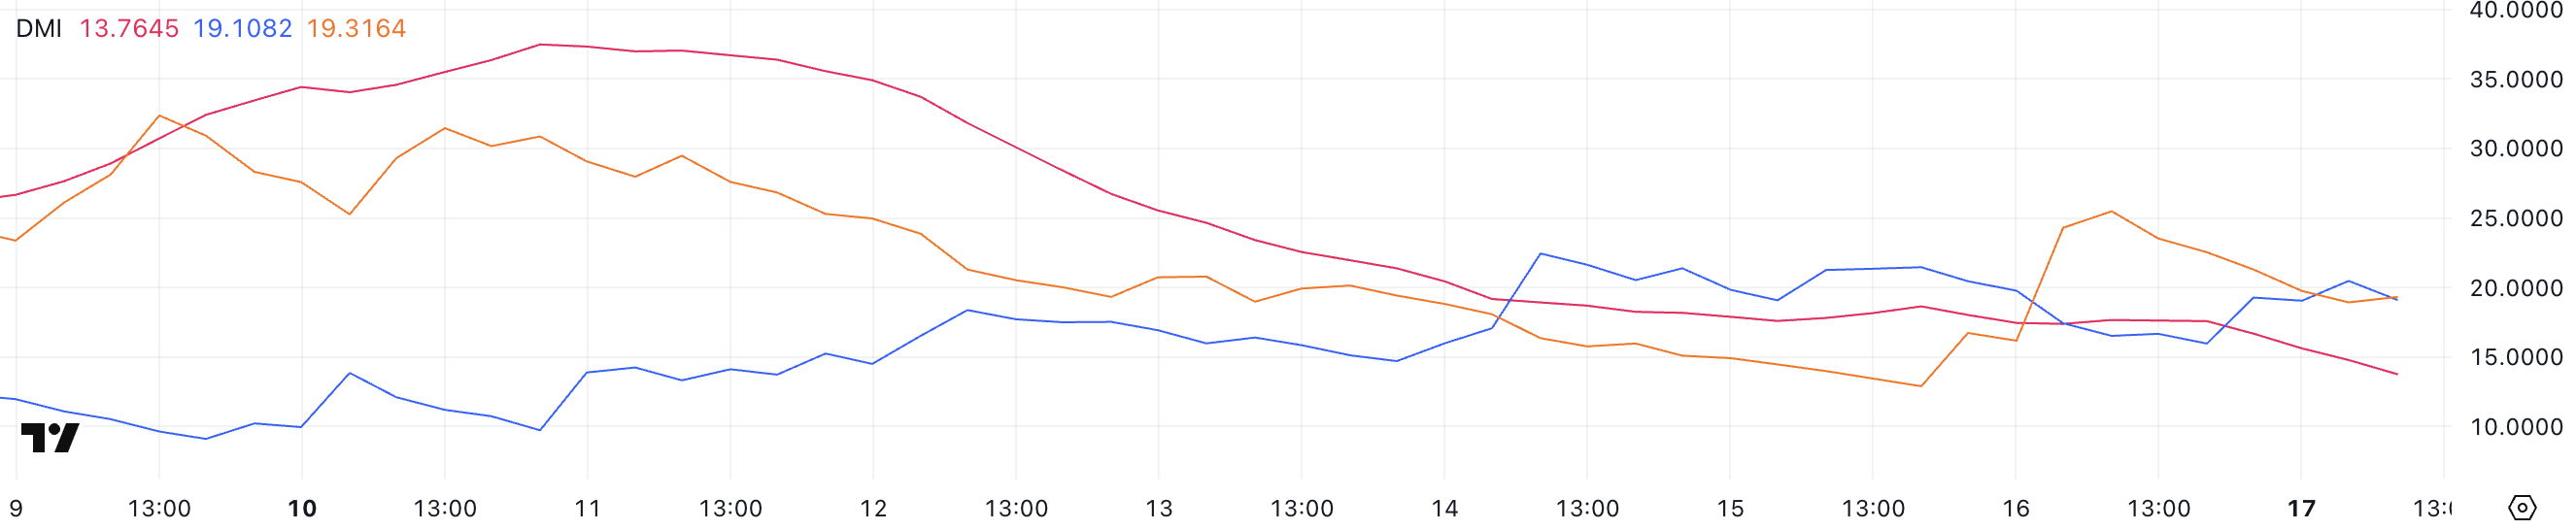
Readings above 25 indicate a strong trend, while readings below 20 often signal a weak or range-bound market. Currently, ADA’s +DI has risen to 19.1 from 15.96, while the -DI has dropped to 19.31 from 25.48, showing that bearish momentum is fading as bullish pressure slowly builds.
With the +DI and -DI lines close to crossing, ADA appears to be in the early stages of attempting to reverse from a downtrend to a potential uptrend, though a stronger ADX would be needed to confirm a solid trend shift.
Will Cardano Rise Above $1.10 Soon?
ADA’s EMA lines have shown signs of consolidation over the past few days, though the overall structure remains bearish. Short-term EMAs are still positioned below the long-term ones.
However, recent signals from both the BBTrend and DMI indicators suggest that this trend could be shifting, with early signs of bullish momentum building.
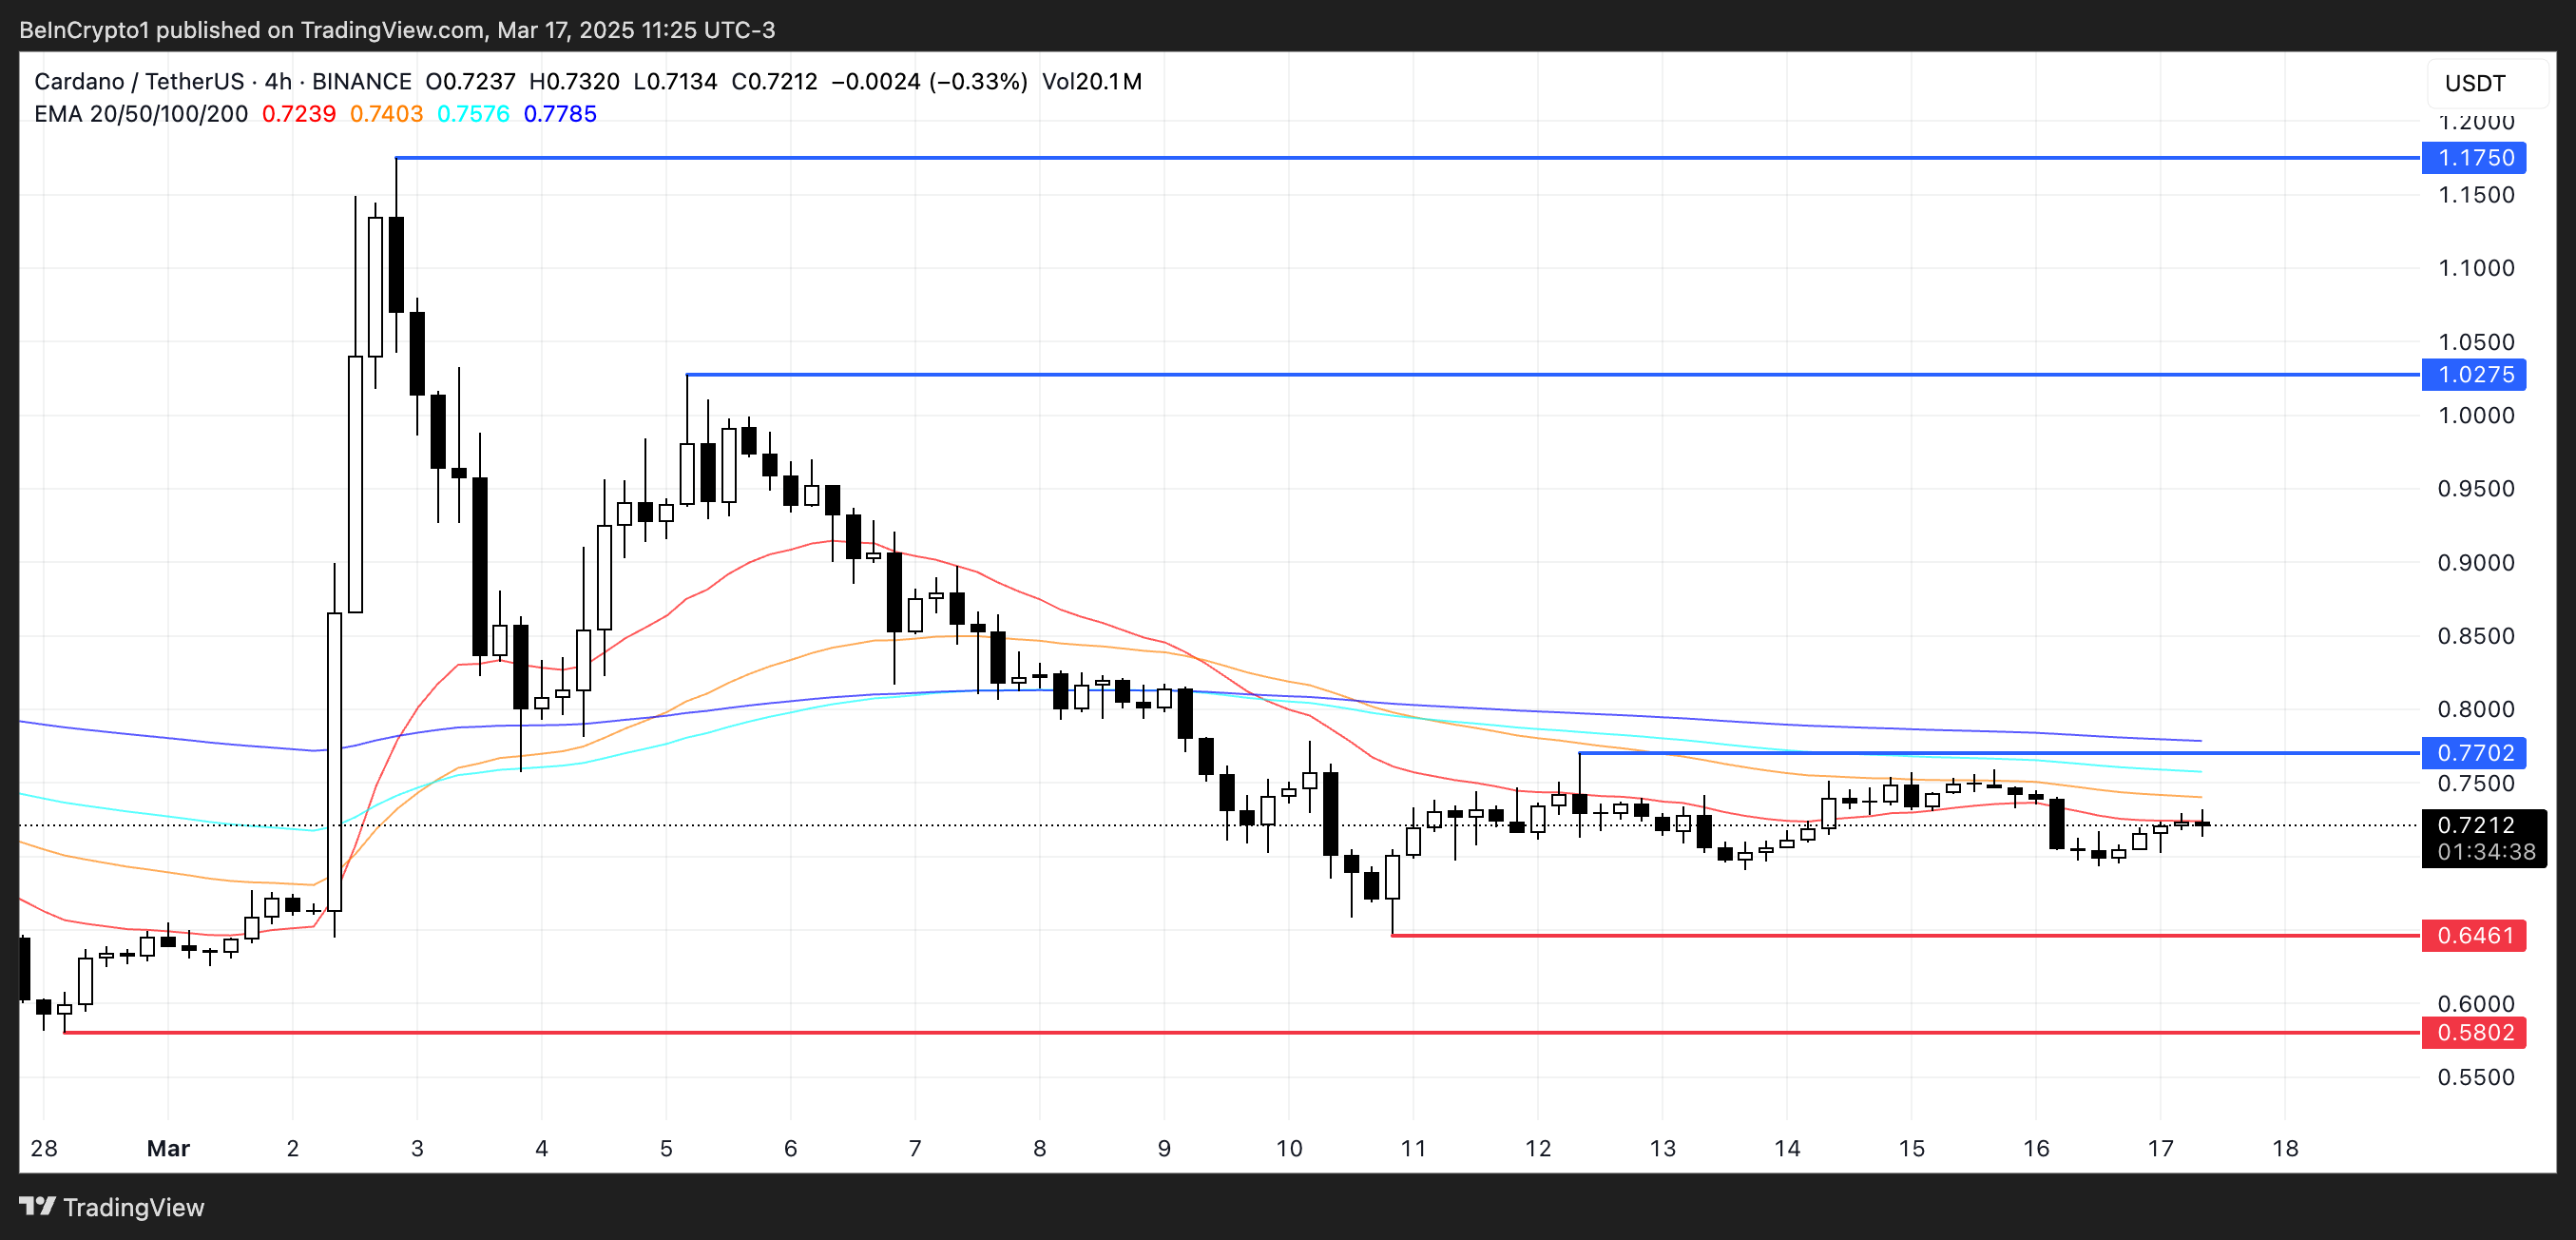
If Cardano’s price manages to confirm an uptrend, it could first challenge the resistance at $0.77. A breakout above this level may open the path toward $1.02 and even $1.17, marking the first time ADA trades above $1 since March 3.
On the downside, if bearish pressure returns, ADA could retest support at $0.64, and a breakdown below this could push prices as low as $0.58, revisiting levels not seen since February 28.
The post Cardano (ADA) Bulls Gain Ground as Selling Pressure Weakens appeared first on BeInCrypto.
Read moreLatest News