
Onyxcoin (XCN) Price Consolidation Could Lead to a Major Breakout
Onyxcoin (XCN) has fallen 16% over the past seven days, although it’s up by 52% in the last 30 days. The XCN Relative Strength Index (RSI) is currently at 40.1, indicating mild bearish momentum but not strong enough to signal overselling.
Meanwhile, the Average Directional Index (ADX) has declined to 15.1, suggesting that the downtrend is losing strength and could lead to a period of low momentum. Despite the ongoing bearish trend, the Exponential Moving Average (EMA) lines show a possibility for XCN to challenge key resistance levels and potentially surge by up to 30% before March if bullish momentum picks up.
XCN RSI Has Been Neutral Since February 12
XCN’s Relative Strength Index (RSI) is currently at 40.1 and has remained below 50 for the past 5 days without dropping to the oversold level of 30.
This indicates that XCN has been experiencing mild bearish momentum as it stays under the neutral 50 mark.
However, the fact that it hasn’t touched the 30 levels suggests that selling pressure is not overwhelming, potentially signaling a consolidation phase or a weakening of the bearish trend.
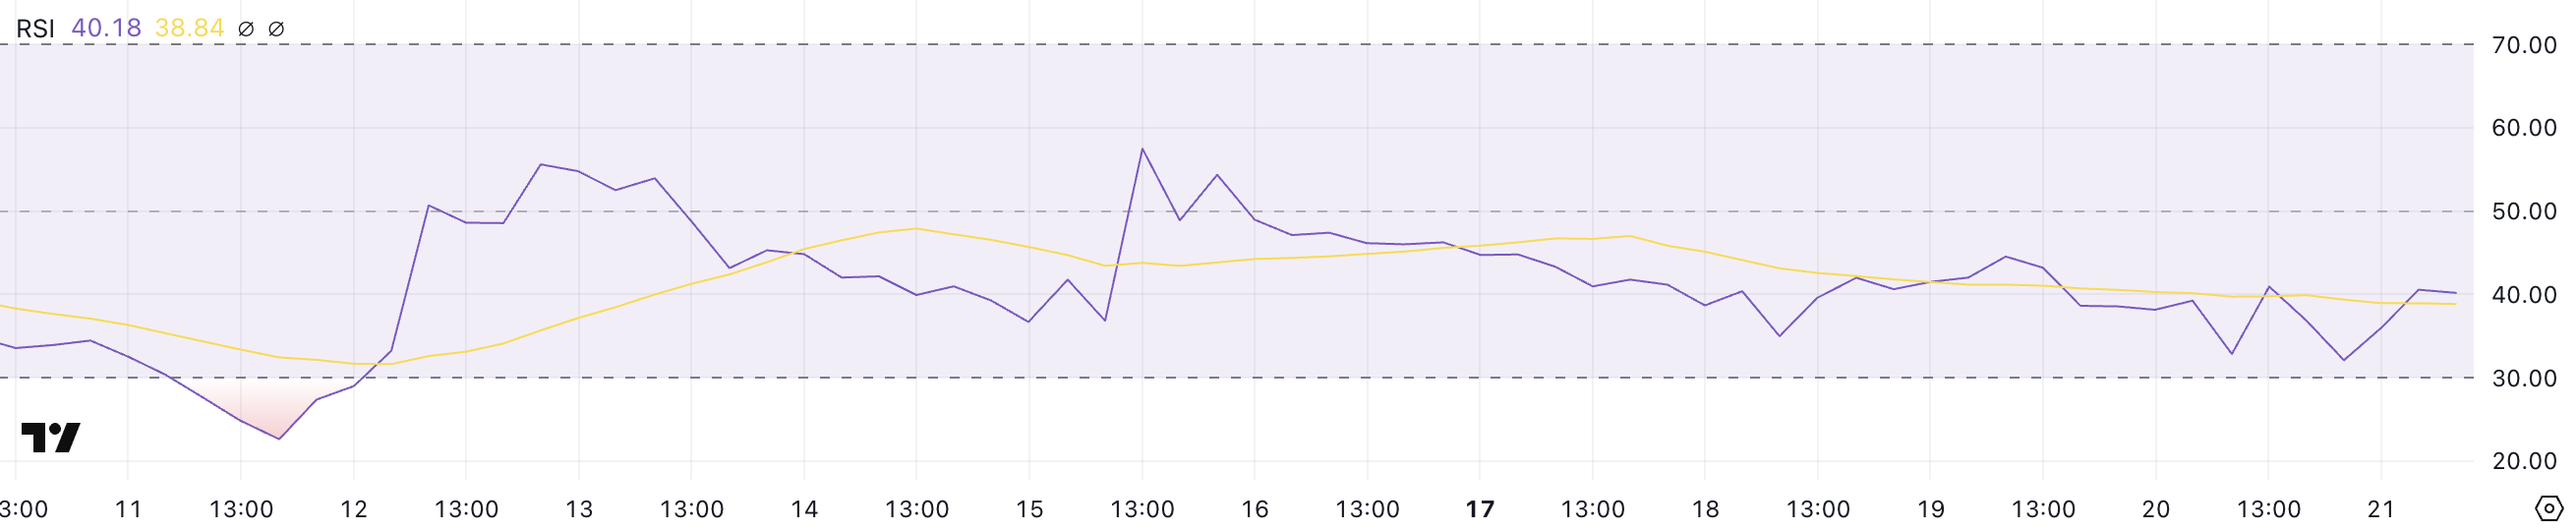
RSI is a momentum oscillator that measures the speed and change of price movements, ranging from 0 to 100. Typically, an RSI above 70 is considered overbought, indicating that an asset may be due for a correction or pullback.
At the same time, an RSI below 30 is seen as oversold, suggesting a potential buying opportunity as the asset could be undervalued.
With XCN’s RSI at 40.1, it is in a cautious zone where the bearish sentiment exists but isn’t particularly strong. This could mean the price is in a consolidation phase, waiting for a catalyst to determine the next direction.
If buying interest picks up, XCN could move towards the 50 mark, signaling a potential reversal to bullish momentum. Conversely, if it continues to weaken, a drop below 30 would indicate increased selling pressure and a possible continuation of the downtrend.
Onyxcoin ADX Shows the Downtrend Is Easing
Onyxcoin, which is built on Arbitrum, currently has an Average Directional Index (ADX) of 15.1 after reaching a peak of 29.4 just four days ago. Since then, the ADX has been declining steadily, indicating a weakening trend.
The drop below 20 suggests that the downtrend, which has been present over the last few days, is losing momentum.
While Onyxcoin price is still in a downtrend, the declining ADX indicates that the strength of this bearish movement is diminishing, potentially leading to a period of consolidation or a slowdown in selling pressure.
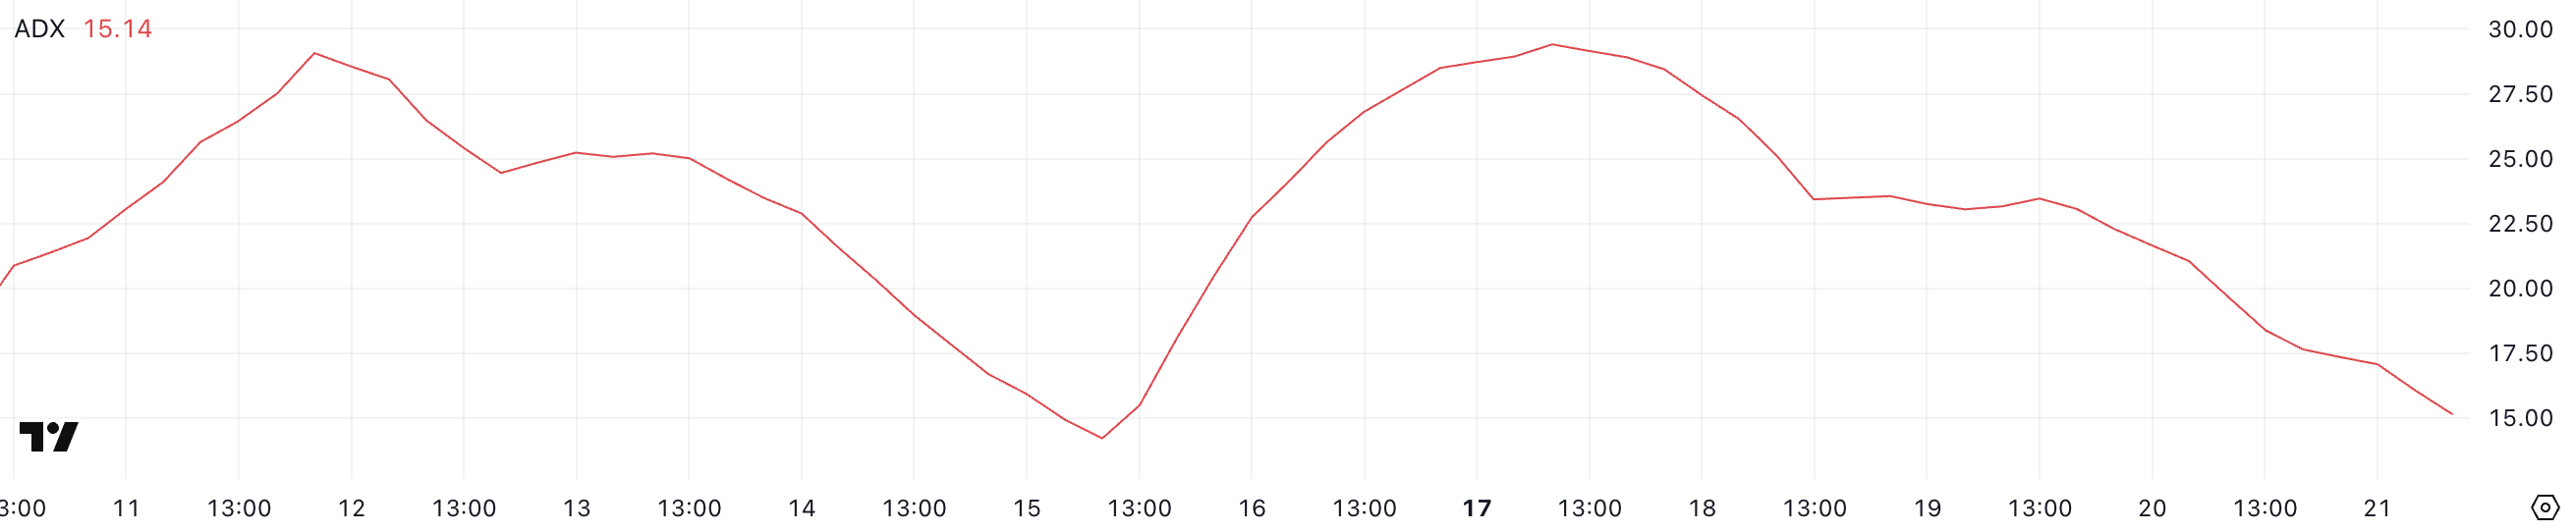
ADX is an indicator used to measure the strength of a trend, regardless of its direction. It ranges from 0 to 100, with values below 20 indicating a weak or non-existent trend and values above 25 suggesting a strong trend, either bullish or bearish.
When ADX is rising, it signals strengthening momentum, whereas a declining ADX suggests weakening trend strength. Onyxcoin’s ADX at 15.1 suggests that the current downtrend is losing power and the market is entering a phase of low momentum.
This could lead to a period of price consolidation or even a potential reversal if buying interest returns. However, as long as the ADX remains below 20, any price movements are likely to be weak and lack significant directional strength.
Can Onyxcoin Surge 30% Before March?
Between January 15 and January 26, the XCN price surged more than 1,300%, making it one of the best-performing altcoins of January. However, its price started to decline after that.
Onyxcoin’s Exponential Moving Average (EMA) lines indicate that the bearish trend is still present, but the downward momentum is not as strong as it was some days ago.
This suggests that selling pressure has eased slightly, though the bears still hold control. If selling pressure persists, XCN could test the support level at $0.017.
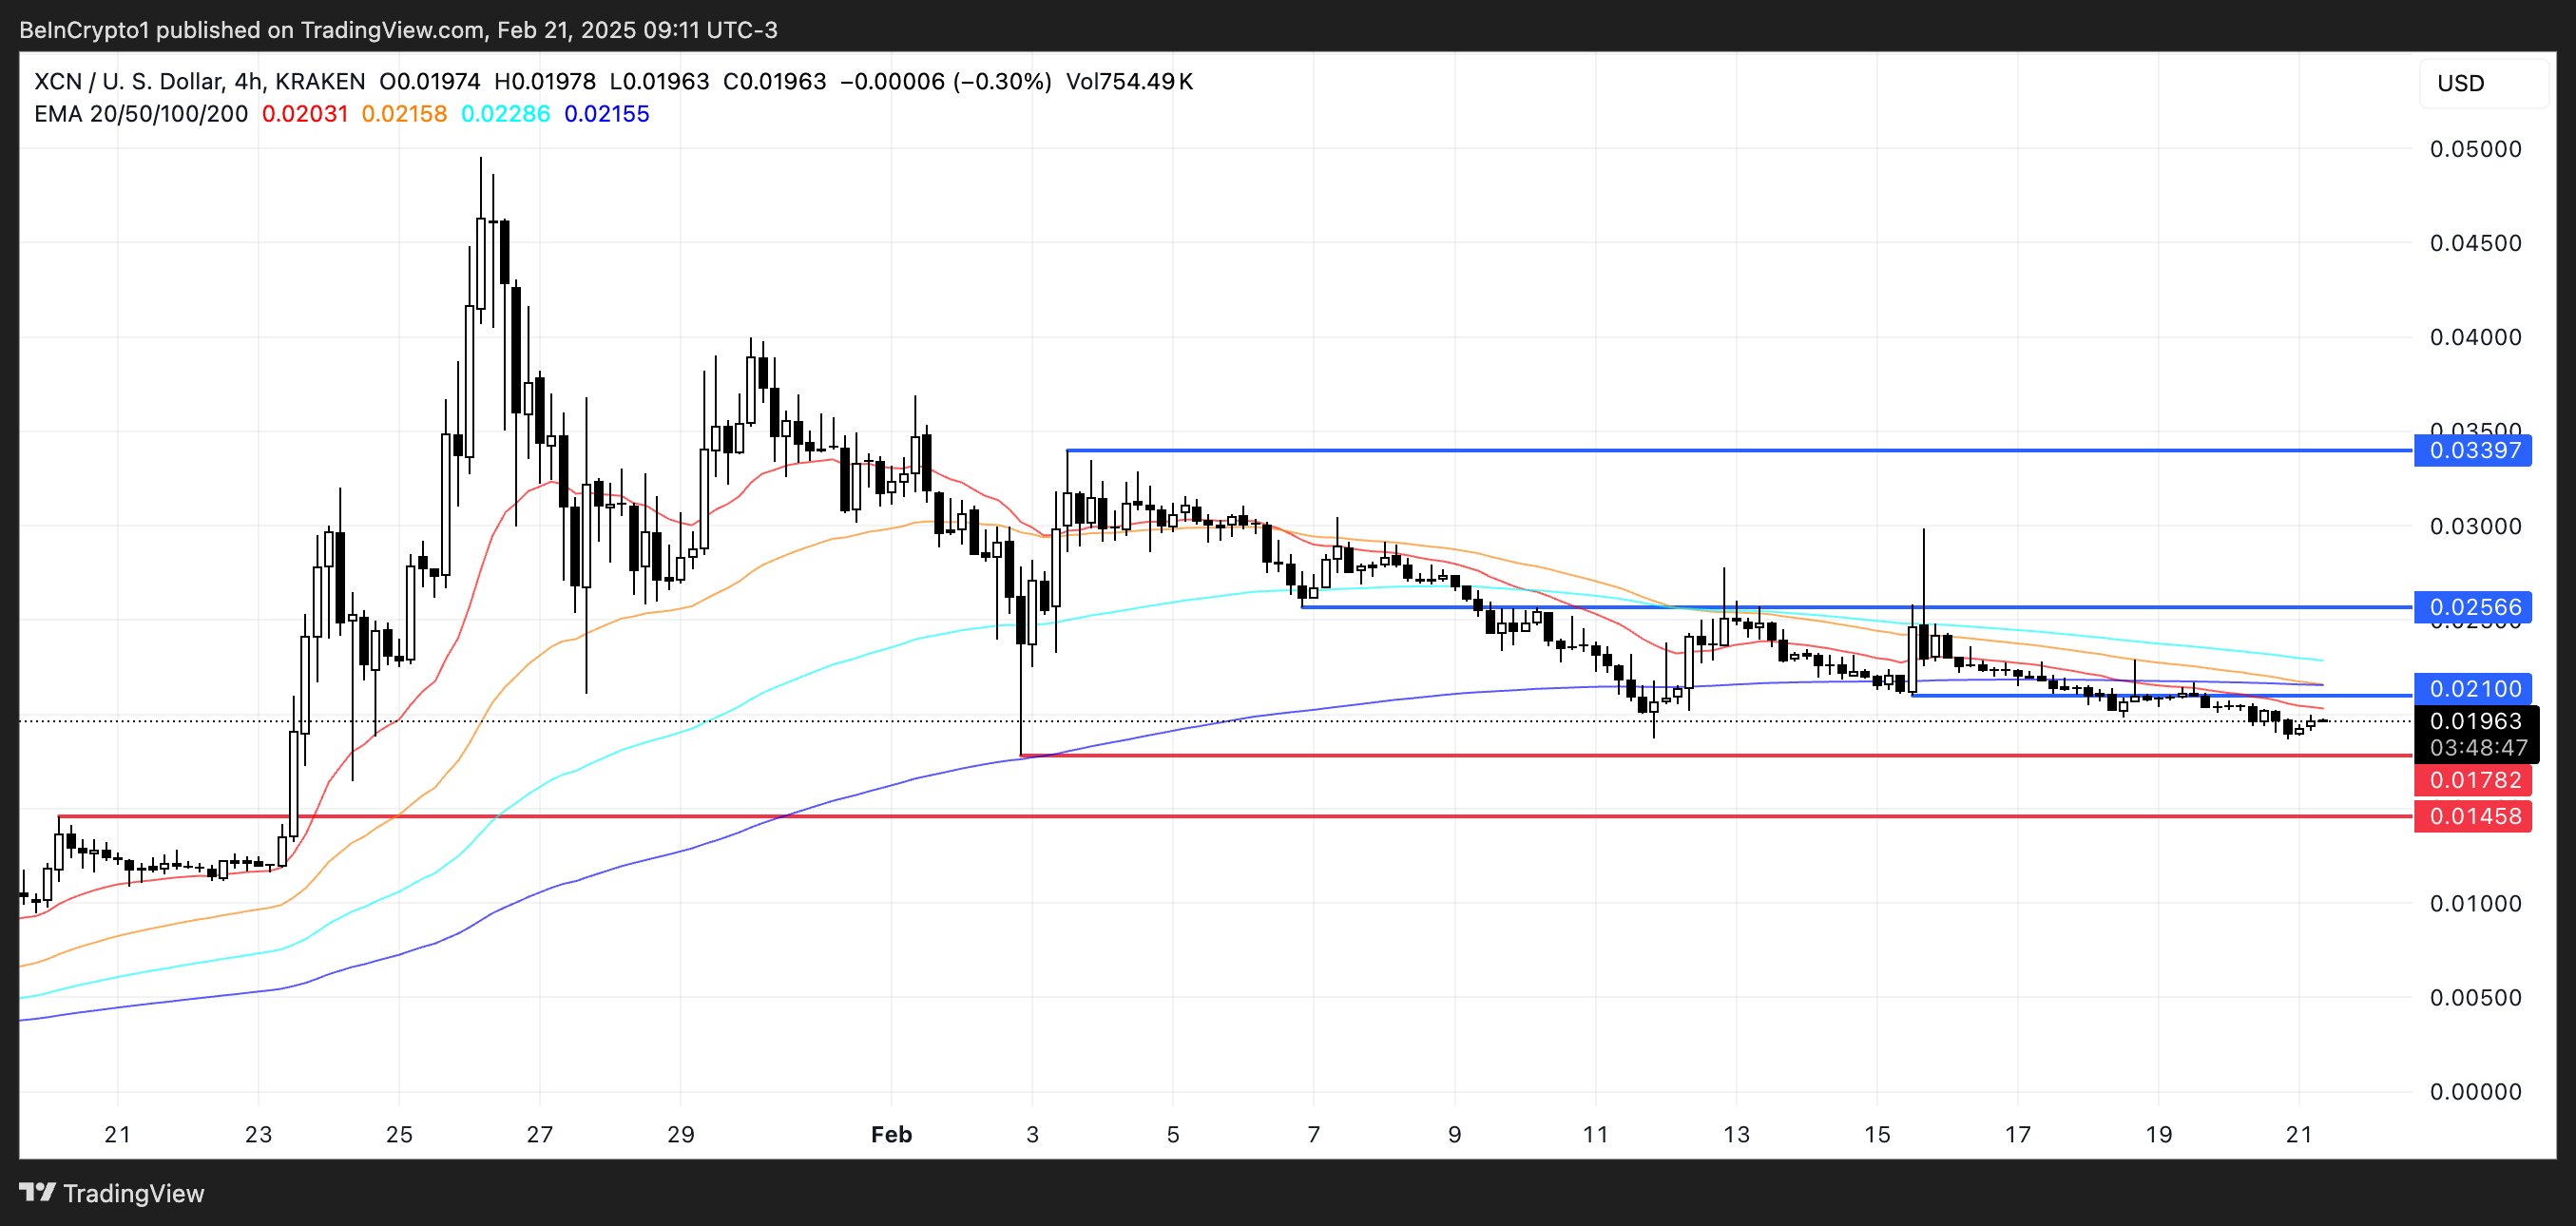
A break below this support could open the path for a deeper correction towards the next key support at $0.014.
Conversely, if the bearish momentum fades and a trend reversal occurs, XCN could challenge the close resistance at $0.021. A break above this level would signal a potential shift in market sentiment, leading to a rally towards the next resistance at $0.025.
Should bullish momentum build further, XCN could target $0.0339, representing an upside of nearly 30% from current levels.
The post Onyxcoin (XCN) Price Consolidation Could Lead to a Major Breakout appeared first on BeInCrypto.
Read moreLatest News