Will Oil Price Drop Again or Has the Supply Shock Rewritten the Playbook?
Oil prices are sitting in the same chart setup that triggered a 13% drop two weeks ago, but the options market and a deepening supply shock have rewritten the variables that determine whether the drop happens again or fails.
Brent crude trades at $101.39 on April 27, up 2.28% on the day and just below the $107.46 high it rejected on April 23. The pattern that triggered April’s drop is back. But the conditions around it are different.
Bearish Divergence Mirrors the Setup That Crashed Brent Crude 13% in April
Since March 9, Brent crude has traded inside a falling channel, a bearish pattern. Within that channel, the pattern flashing now is the same one that preceded April’s drop.
Between January 29 and April 23, Brent printed a higher swing high in price while the Relative Strength Index (RSI) printed a lower swing high. That is a textbook bearish divergence, where price strength outpaces underlying momentum and often signals a trend reversal.
The precedent is uncomfortable. The same divergence formed between January 29 and April 16. Brent then rolled over and dropped over 13% to a local low of $86.09.
Want more insights like this? Sign up for Editor Harsh Notariya’s Daily Newsletter here.
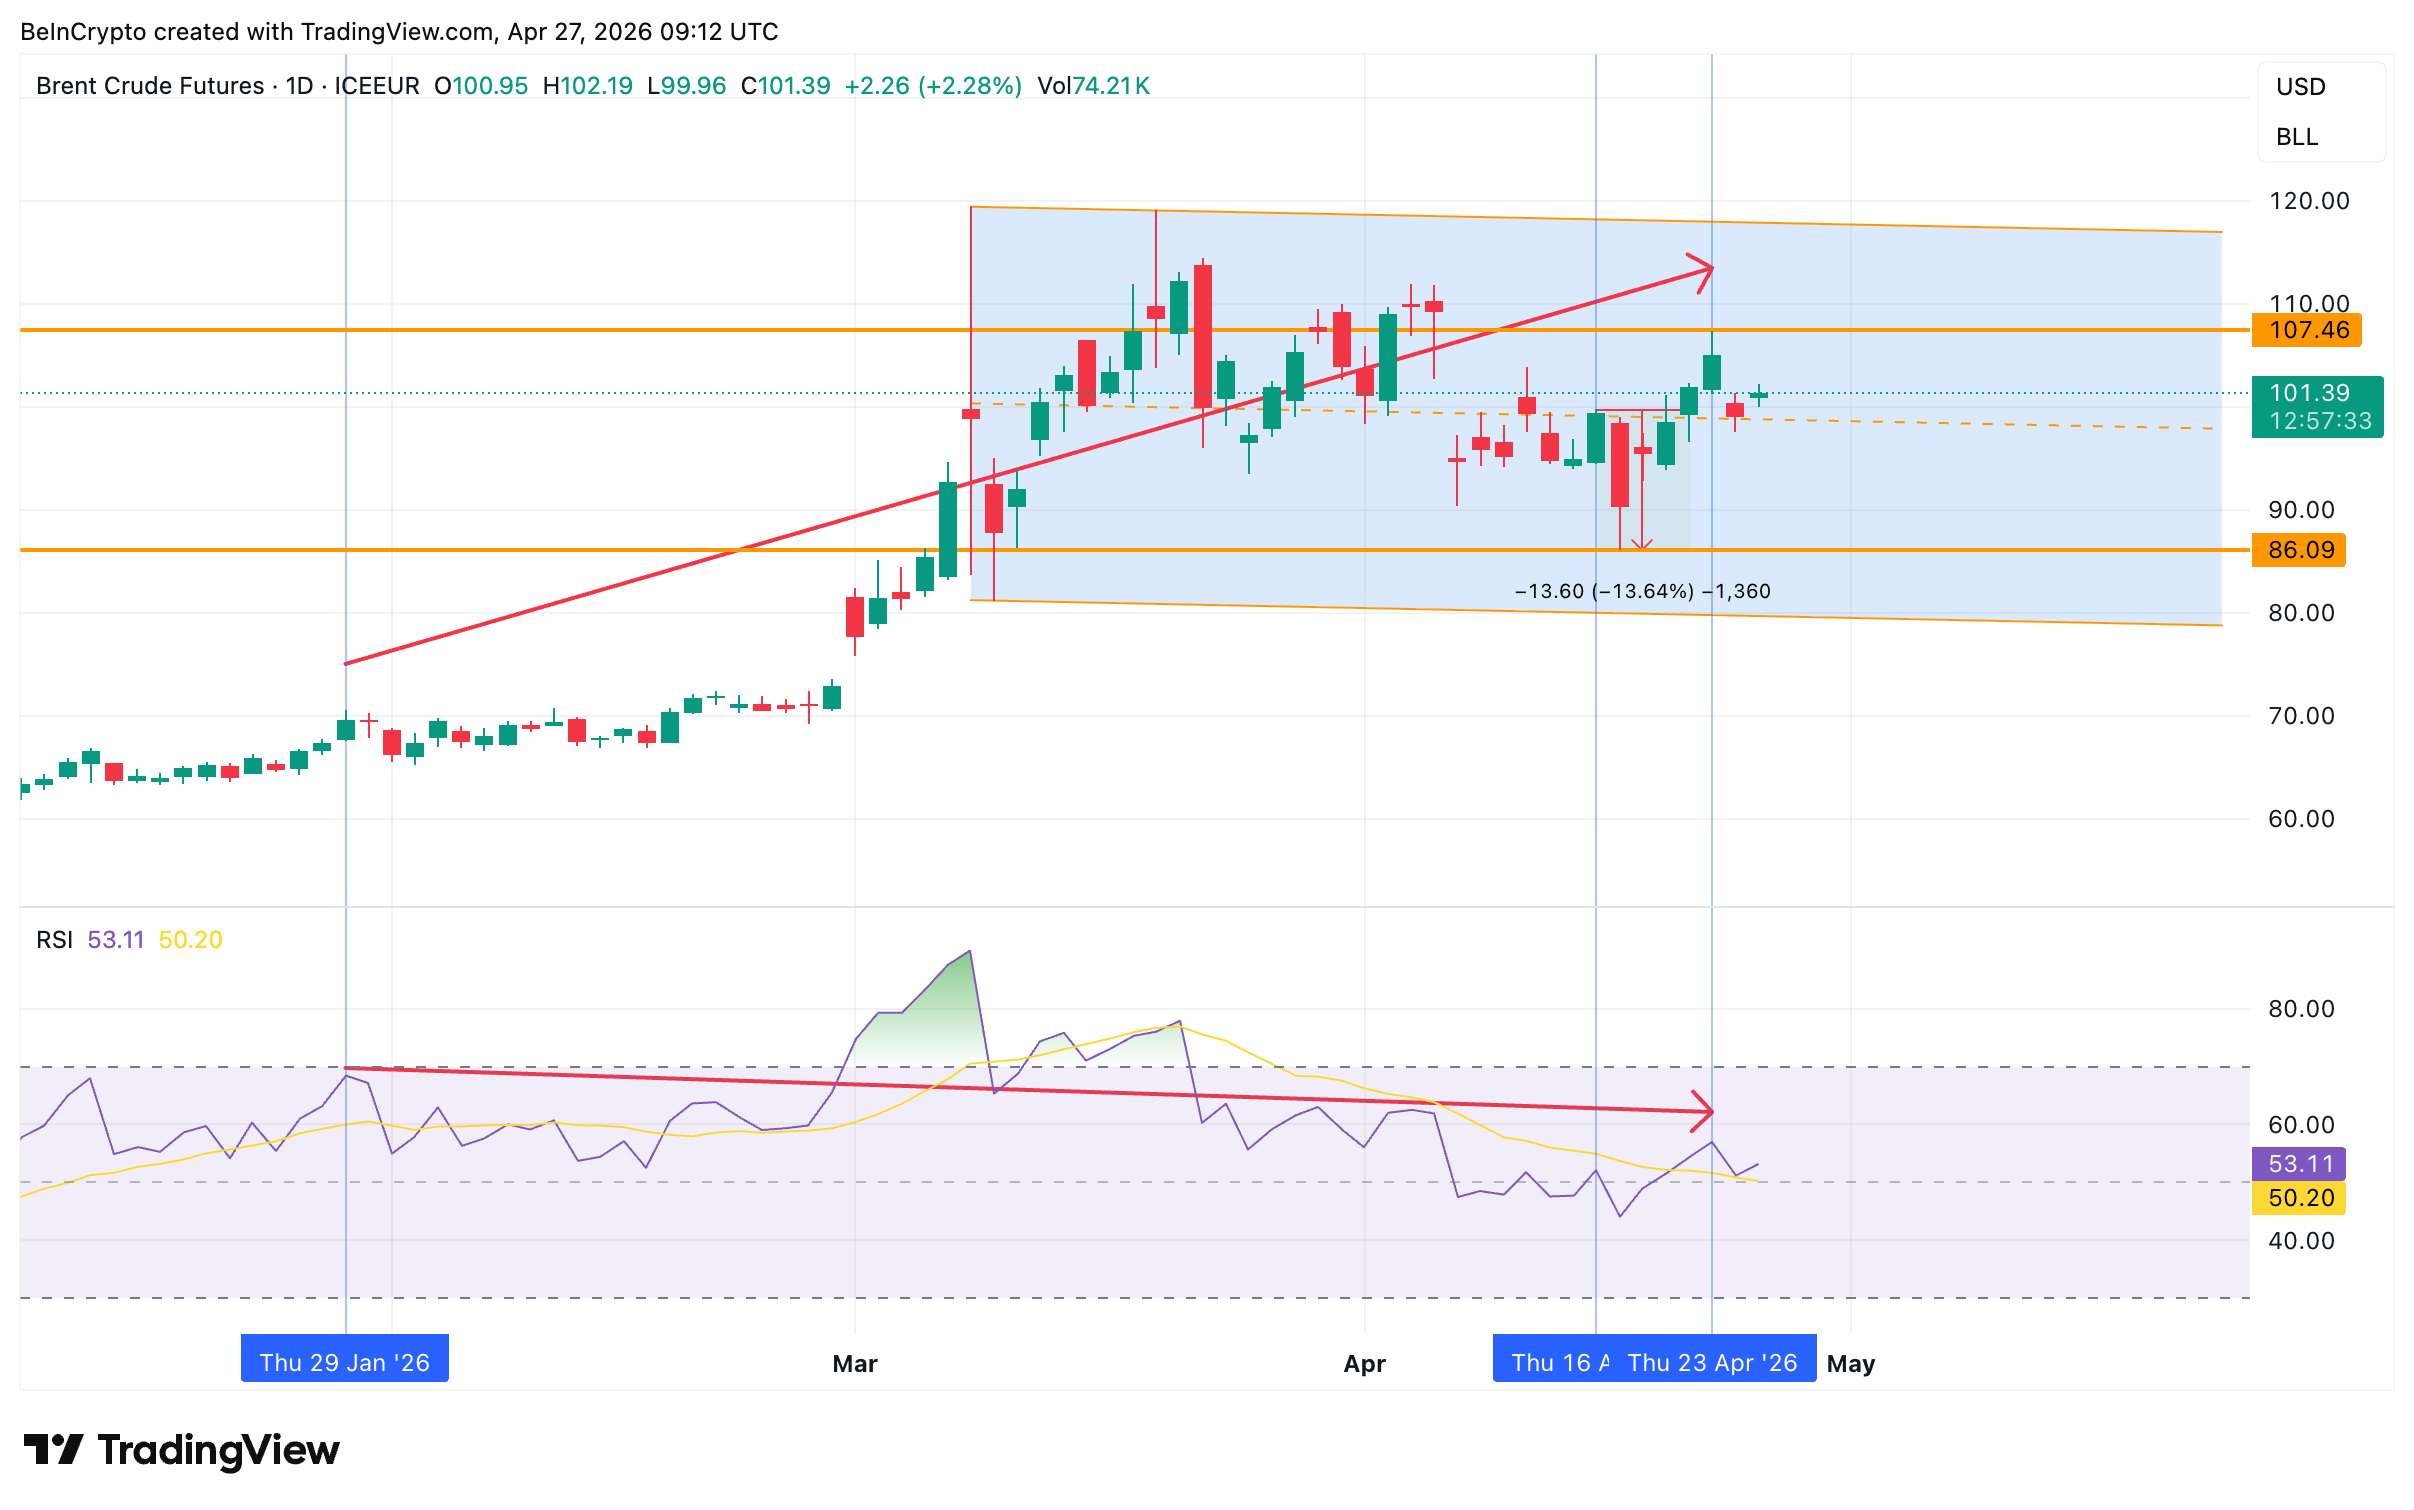
The pattern playing out today is structurally identical, with the same channel, the same momentum failure, and a similar rejection at the upper boundary. If the playbook holds, oil price faces a measured drop back toward the channel floor near $81.72.
Goldman, Inventory Draws, and a Collapsing Put-Call Ratio Disagree With the Chart
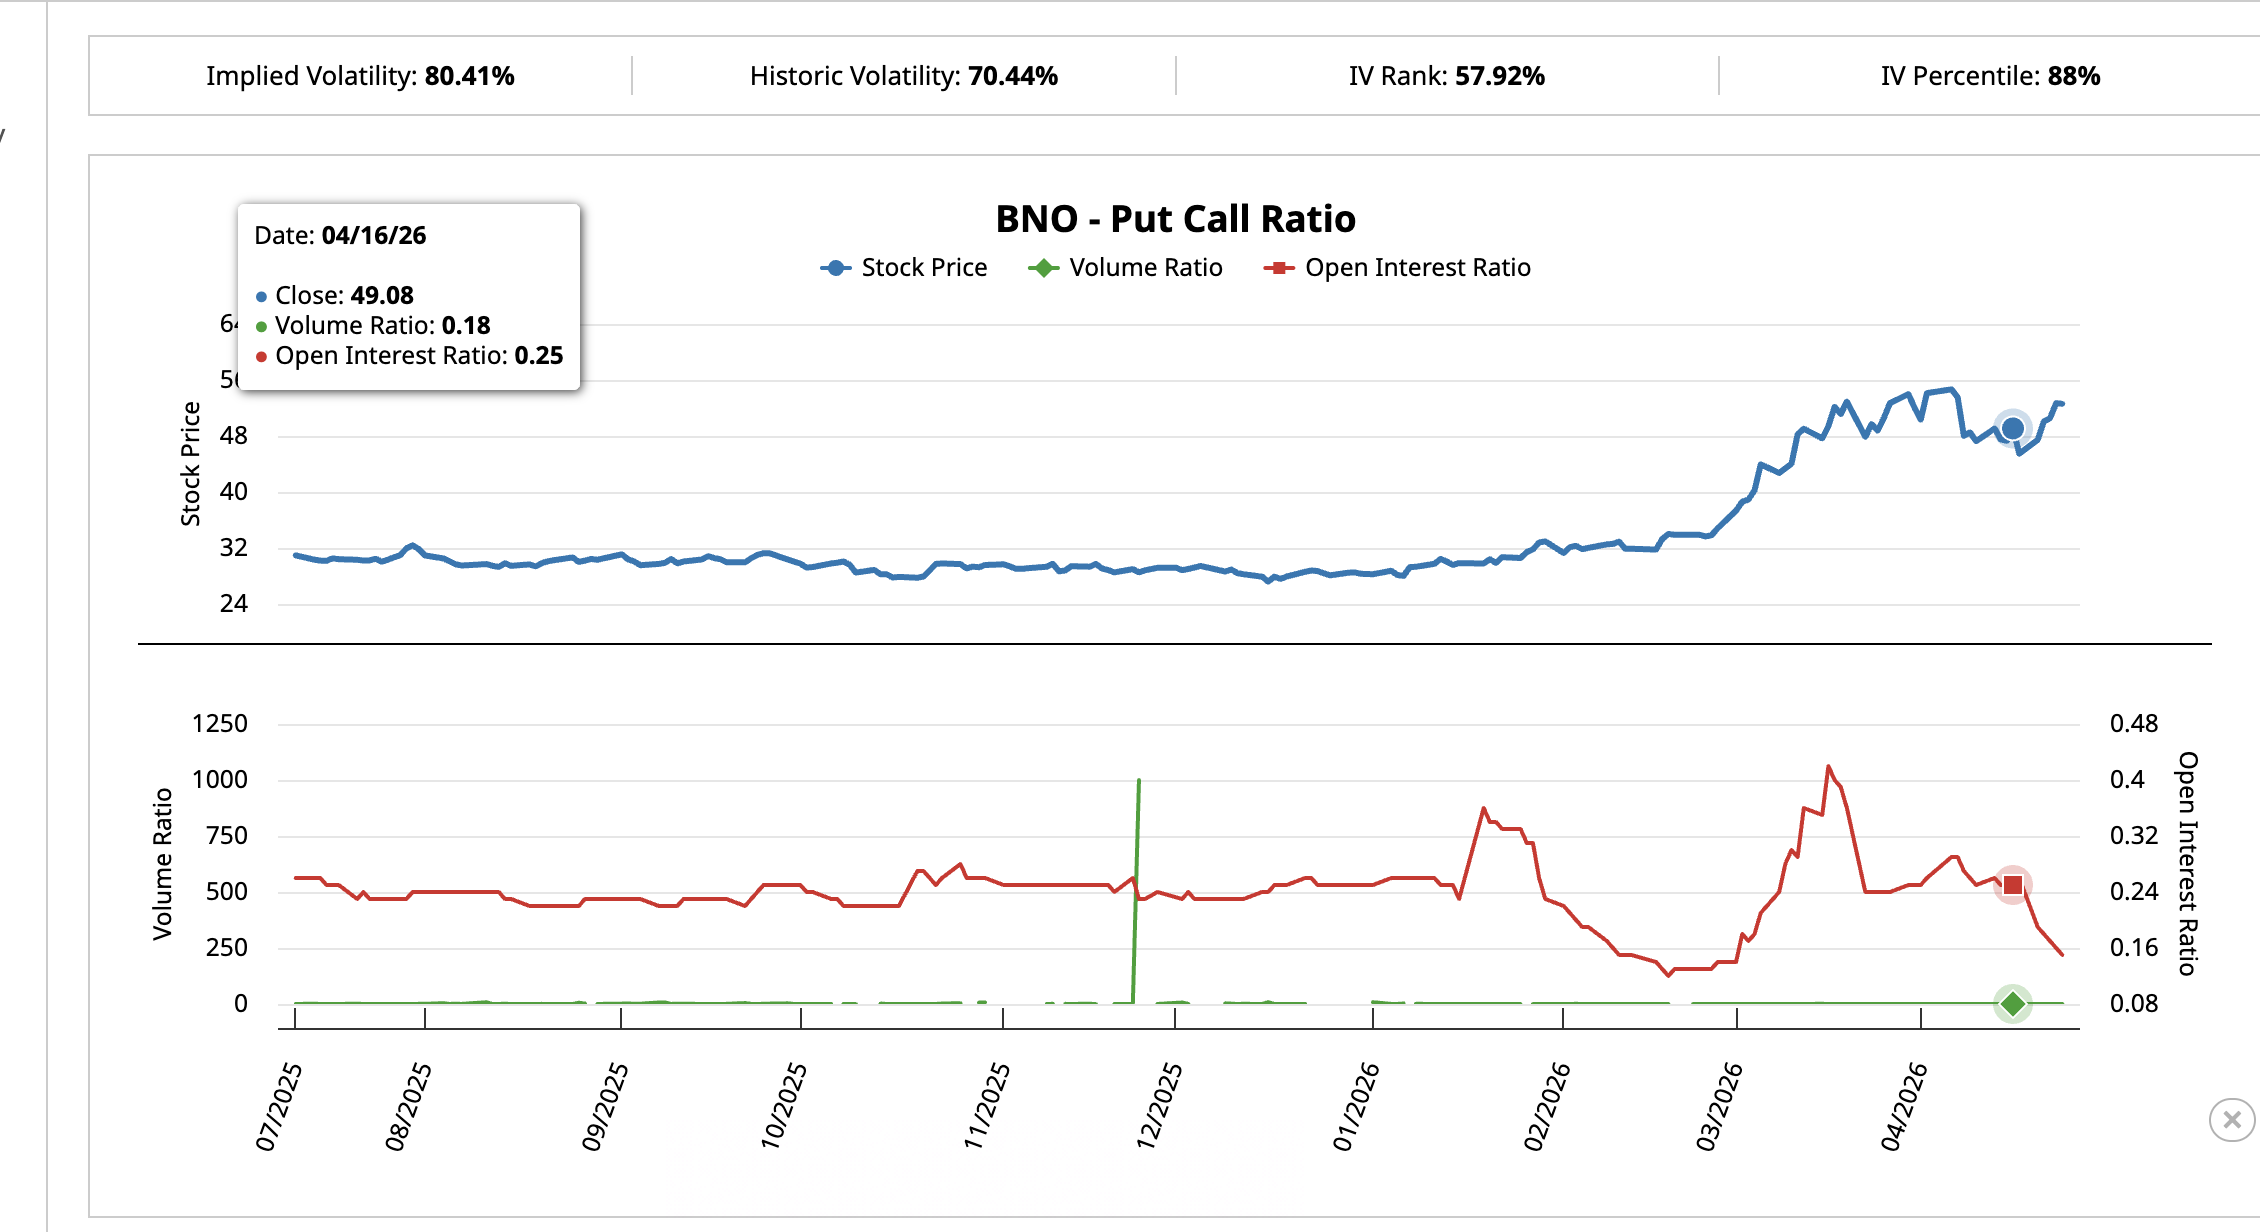
The chart says one thing. The options market says another. The United States Brent Oil Fund (BNO), a US-listed exchange-traded fund (ETF) that tracks Brent crude prices, gives a clean window into how options traders are positioning.
On April 16, when the prior bearish divergence flashed, BNO’s volume put-call ratio, a measure of bearish versus bullish bets in daily options flow, sat at 0.18, while its open interest put-call ratio, which measures standing positioning, was 0.25.
Brent then dropped 13%.
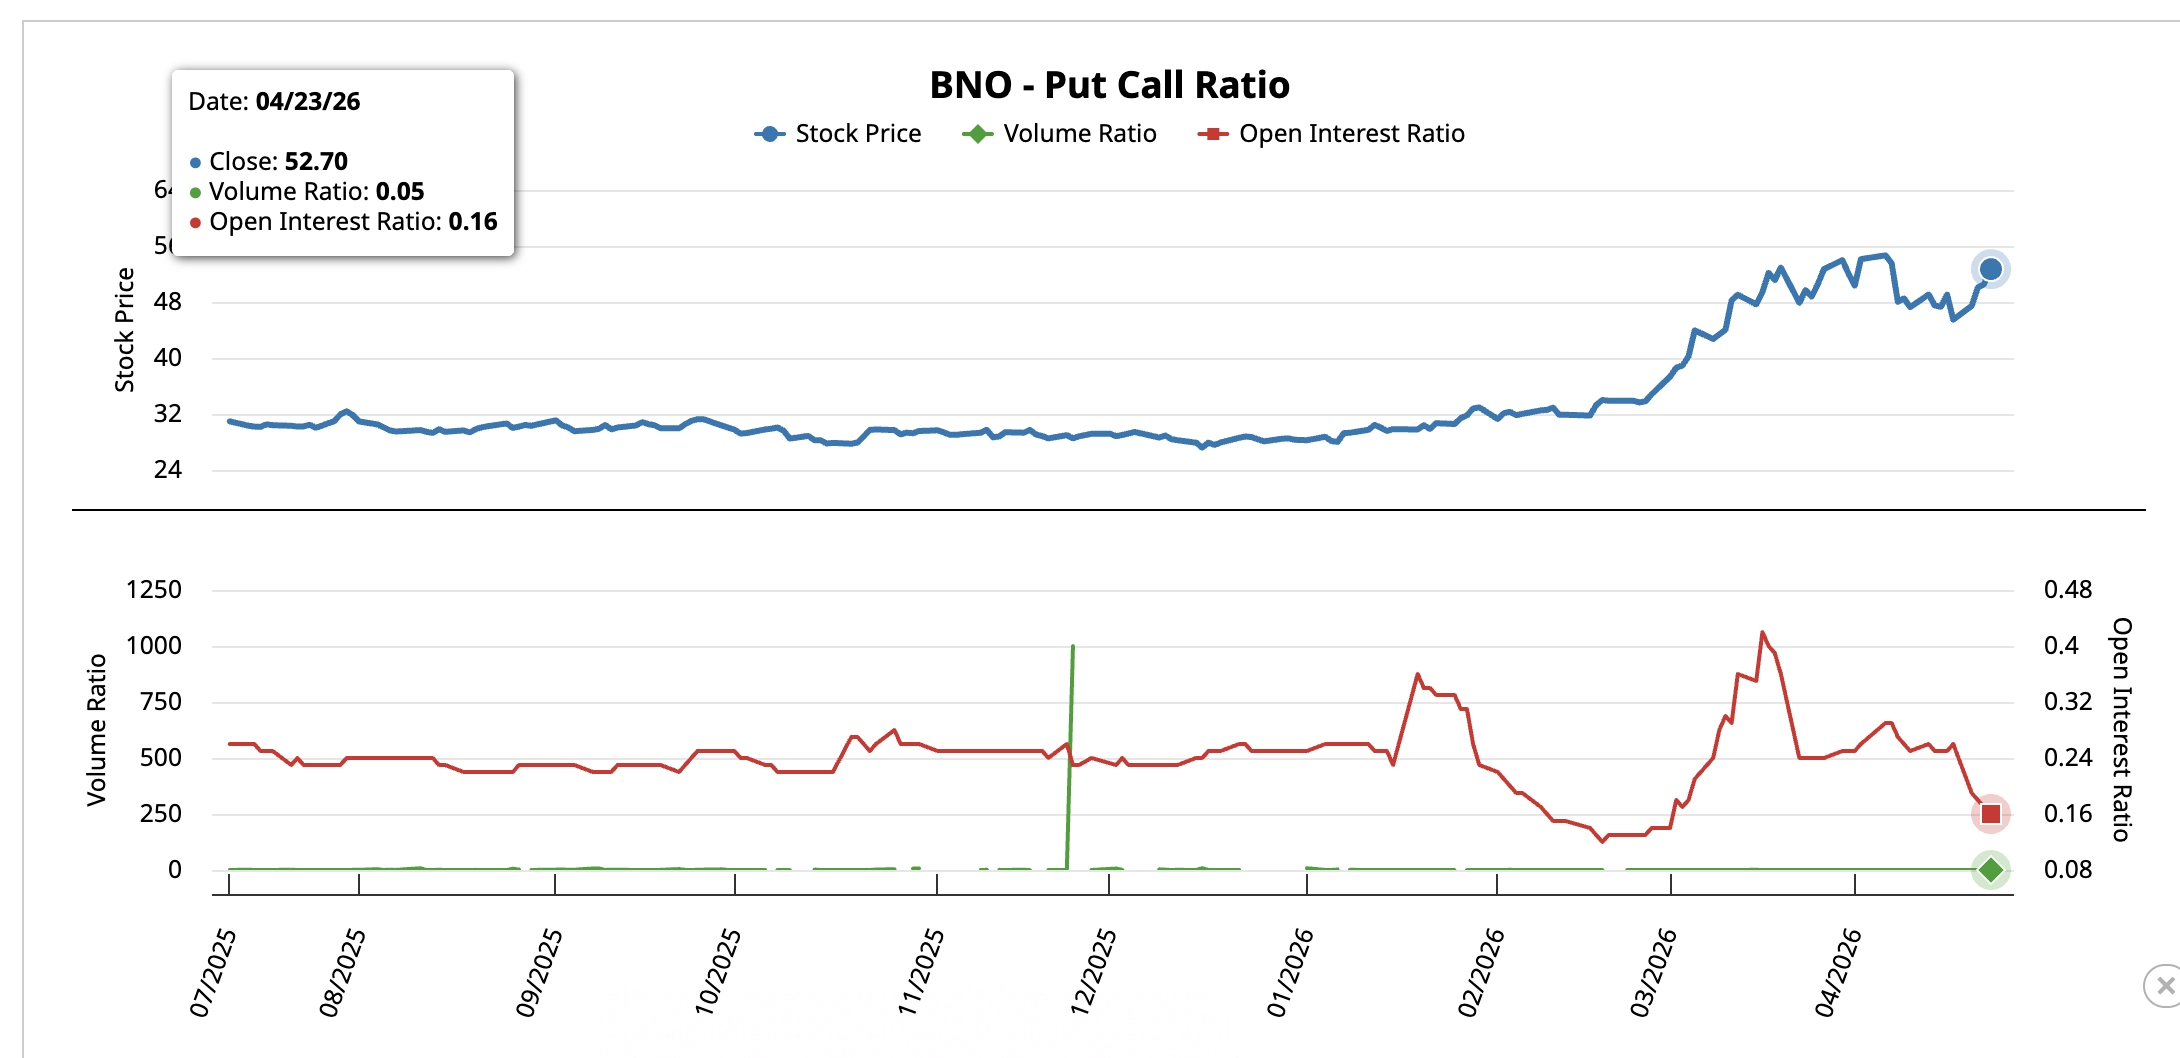
By April 23, when the latest divergence printed, the picture flipped. Volume put-call collapsed to 0.05, and open interest put-call dropped to 0.16, indicating shorts were liquidated and call demand surged.
Implied volatility (IV), the market’s expectation of future price swings, sits at 80.41% with an IV percentile at 88%, signaling traders are pricing a large move ahead.
The supply side explains the bullish positioning. Goldman Sachs raised its Q4 2026 Brent forecast to $90 per barrel from $80 on Monday, citing 14.5 million barrels per day in Persian Gulf production losses and global inventory drawdowns running at 11 to 12 million barrels per day.
That is the structural fuel keeping a bid under oil price, even as the technical picture warns of a drop.
Oil Price Levels Make $99.17 the Trigger, $107.46 the Reversal
The decision sits at $99.17, the 20-day Exponential Moving Average (EMA), where EMA is a trend line that averages price with more weight on recent candles.
On April 13, when oil price lost the 20-day EMA, a 13% drop accelerated within sessions. The same line is now sitting just below the current price.
A daily close above $101.40, the 0.236 Fibonacci level, keeps the bullish path open and points back toward $107.46. A clean break above $107.46 confirms the supply shock thesis. It opens room toward $119.11, the upper channel boundary.
However, a $99.17 loss mirrors the April 13 trigger.
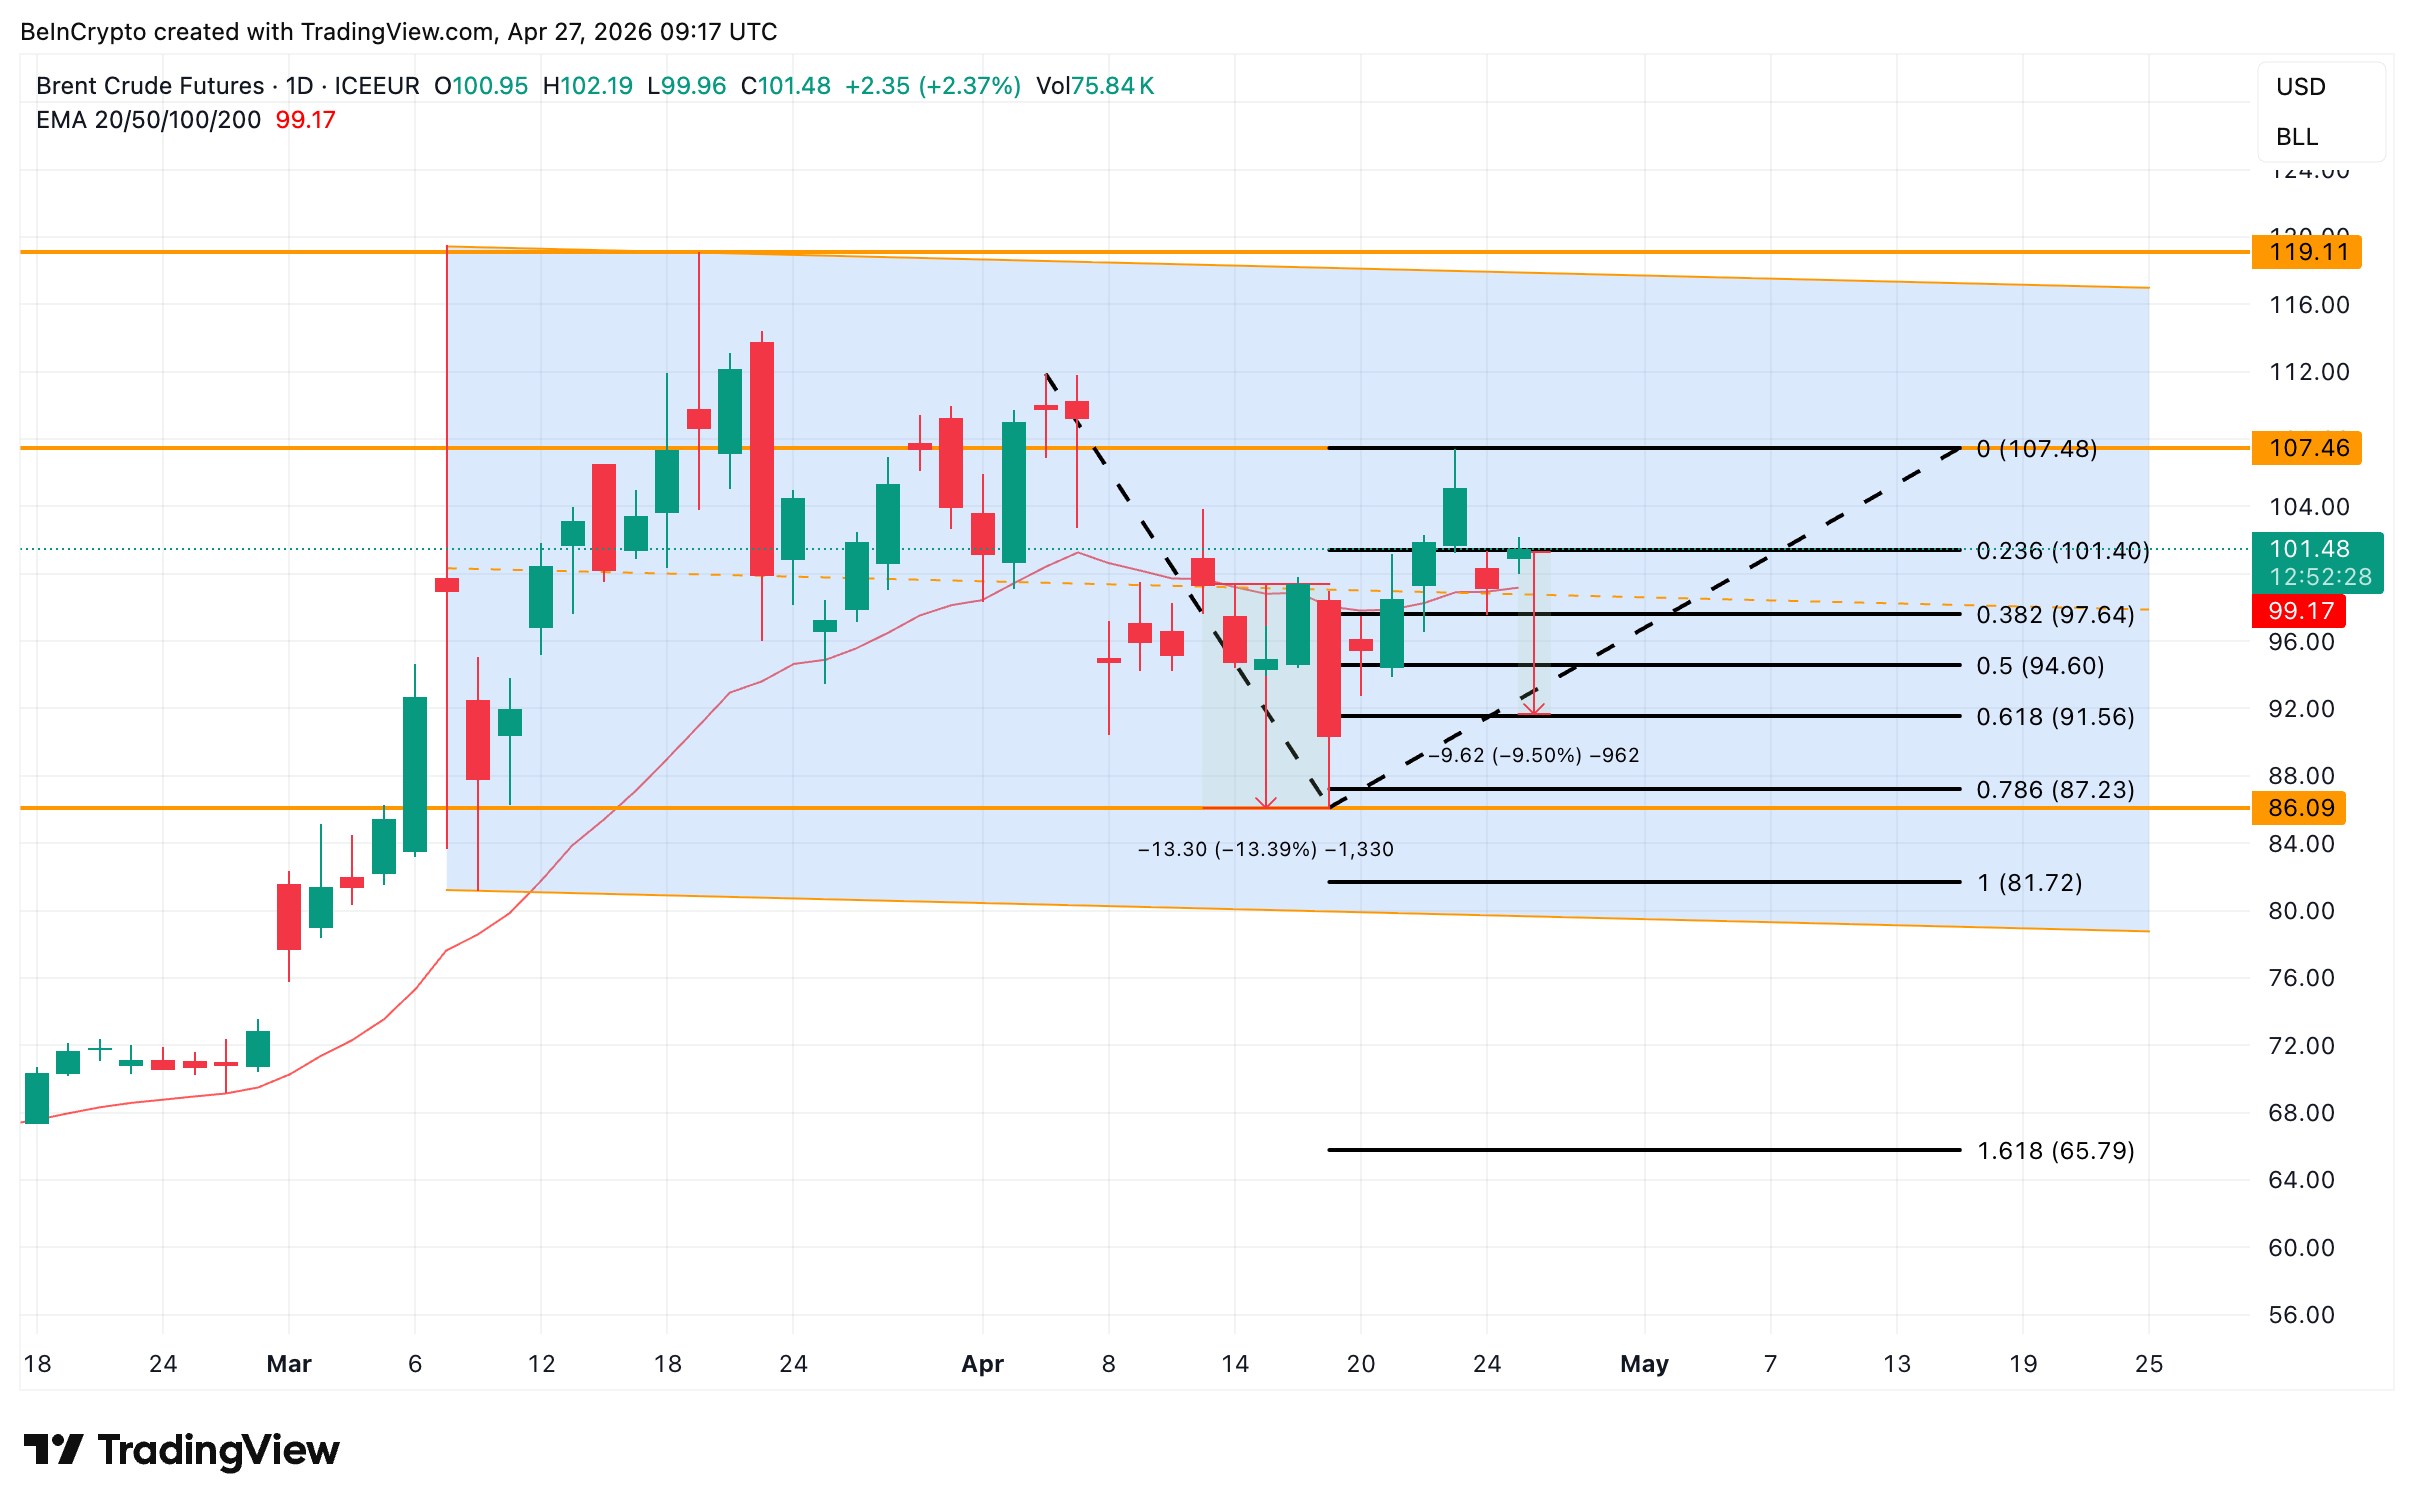
It then exposes $97.64 at the 0.382 Fibonacci level, with $94.60 at the 0.5 Fibonacci level as the next test. The decisive cluster sits at $91.56, the 0.618 Fibonacci, which is the strongest support on the daily chart.
A break below $91.56 opens $87.23 and then $81.72, the channel floor that would complete the repeat-of-April scenario.
For now, $99.17 separates a bearish repeat from a supply-shock-driven rally.
The post Will Oil Price Drop Again or Has the Supply Shock Rewritten the Playbook? appeared first on BeInCrypto.
Read moreLatest News