3 Altcoins That Could Hit New All-Time Highs in the Second Week of April 2026
Most altcoins are trading 50% or more below their record prices, but a small group is moving against that trend. Three tokens currently sit within 11% of their all-time highs, each backed by a distinct catalyst and a confirmed breakout pattern.
BeInCrypto analysts identified these altcoins where the technical setup and fundamental momentum converge, creating a realistic path to new price discovery this week.
Aria.AI (ARIA)
AriaAI (ARIA), an AI-powered gaming and publishing platform, trades at $0.607 on the 8-hour chart, approximately 10.5% below its all-time high of $0.679. The token has surged 214% since March 23, driven by the broader AI sector rally that pushed the category’s total market cap up 30% in a single month to $19 billion.
Grayscale, the world’s largest crypto asset manager, added ARIA to its Q1 2026 “Assets Under Consideration” watchlist in January under the Consumer and Culture category, as reported by Wu Blockchain.
Want more token insights like this? Sign up for Editor Harsh Notariya’s Daily Crypto Newsletter here.
That institutional recognition, combined with the AI sector momentum, has fueled the rally. The 8-hour chart shows a pole and flag pattern. The pole represents the 214% ascent since March 23, and since April 5, prices have consolidated inside what resembles a bullish flag.
However, the Relative Strength Index (RSI), a momentum oscillator, is flashing a bearish divergence. Between March 22 and April 6, price made a higher high while RSI made a lower high. This warns that momentum is cooling and the consolidation could extend before a breakout attempt.
A break above $0.63 would breach the upper trendline and open the path toward the ATH and beyond, with $0.78 as the next reasonable target.
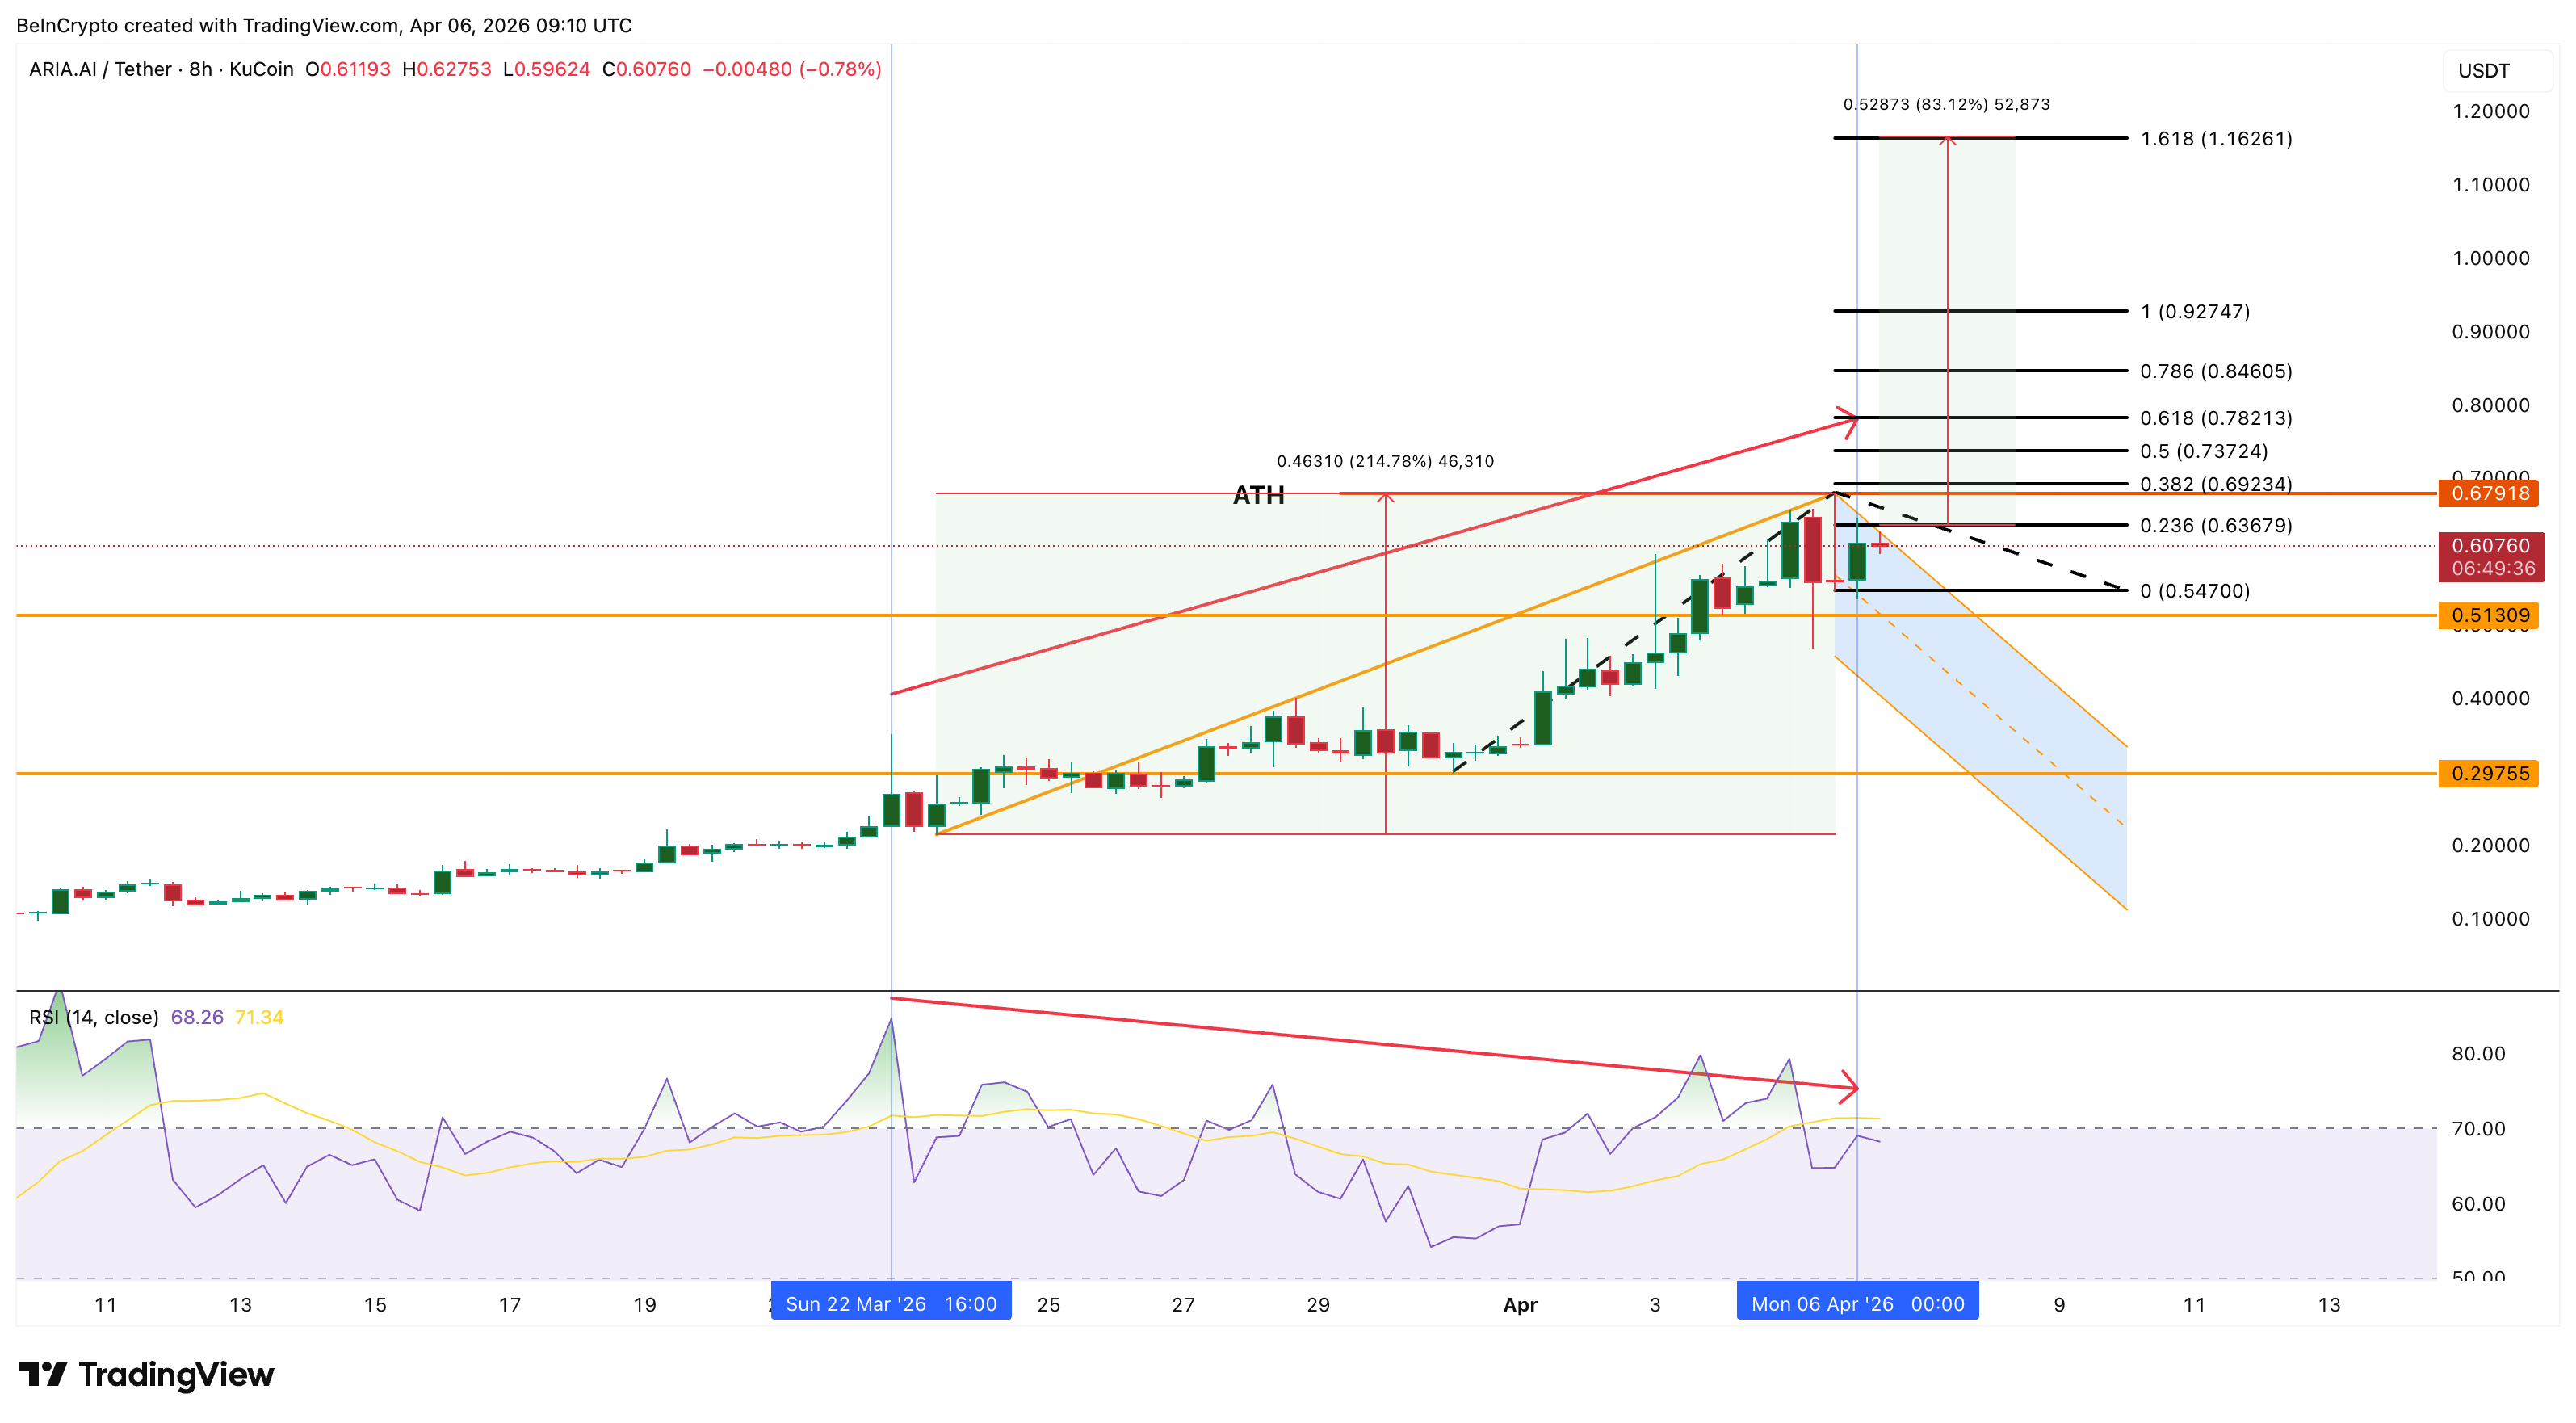
A drop to $0.51 keeps the pattern intact, but a fall under $0.29 invalidates the structure entirely.
MemeCore (M)
MemeCore (M), a Layer 1 blockchain built for meme coin infrastructure, trades at $2.69 on the daily chart. The token is up 73% year-to-date and sits approximately 9.5% below its all-time high of $2.97 set in 2025.
The March 25 hard fork slashed gas fees from 1,500 gwei to 15 gwei, serving as the fundamental catalyst. Since then, MemeCore has confirmed an inverse head and shoulders breakout on the daily chart.
The measured move from the neckline projects a 67% advance, targeting $3.42. That projection lands well above the current all-time high at $2.97, meaning the pattern itself points to price discovery if it completes. The breakout fulfilment is a key reason why M is one of the few altcoins capable of hitting a new peak this week.
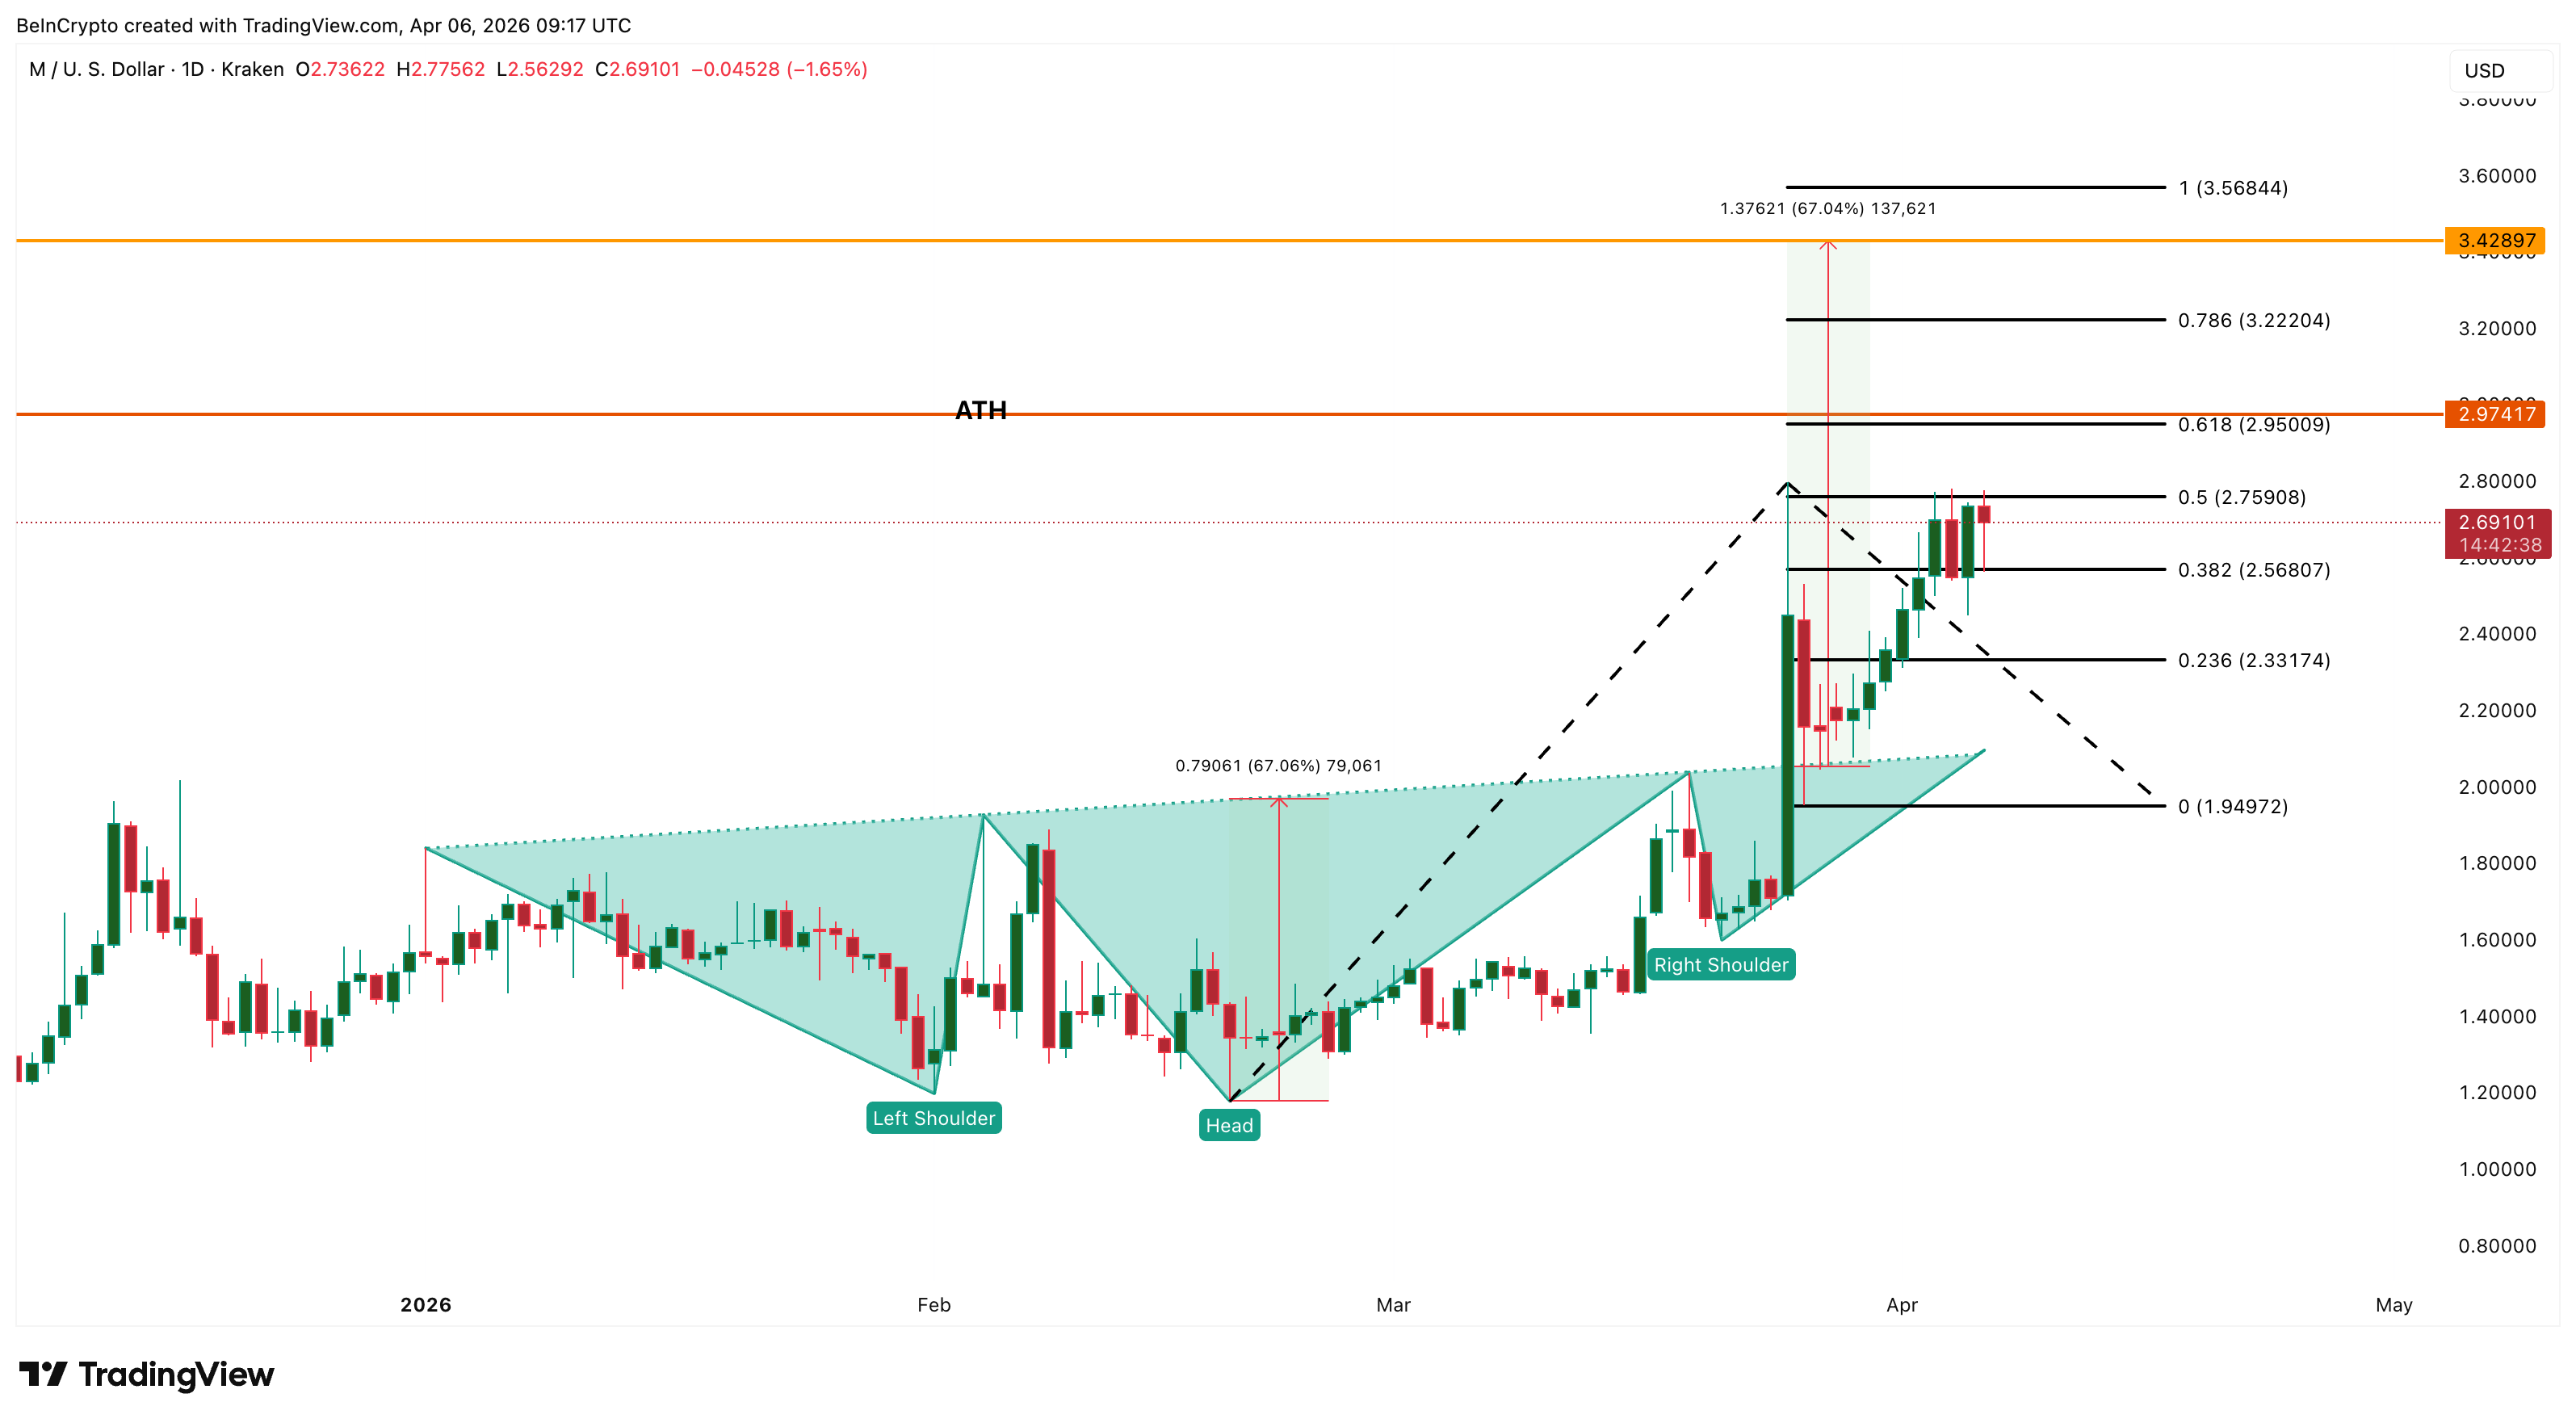
The immediate resistance for M is $2.75, which has capped the last several daily candles. A daily close above $2.75 opens the path to $2.95, followed by the ATH at $2.97. A move above that level enters uncharted territory with $3.22 and $3.42 as the next projected targets.
A daily close above $2.97 confirms a new all-time high with a $3.42 projection, while a failure to hold $2.33 would weaken the breakout structure.
LEO Token (LEO)
LEO Token (LEO), the native utility token of the Bitfinex exchange ecosystem. It trades at $10.12 on the daily chart, just 0.1% from its all-time high of $10.13. Among the three altcoins, LEO requires the smallest move to set a new record.
The reason LEO has been grinding higher while most tokens remain deep below their peaks is structural. Bitfinex parent company iFinex uses at least 27% of its monthly gross revenue to buy back and burn LEO tokens from the open market. That mechanism creates a permanent bid under the price that does not depend on market sentiment.
With war-driven crypto market volatility pushing Bitfinex trading volumes higher, the monthly burn rate has likely accelerated, compressing supply while demand remains steady.
The daily chart confirms an inverse head and shoulders pattern that broke out around March 20. The measured move from the breakout projects a 43.91% advance, targeting $13.27.
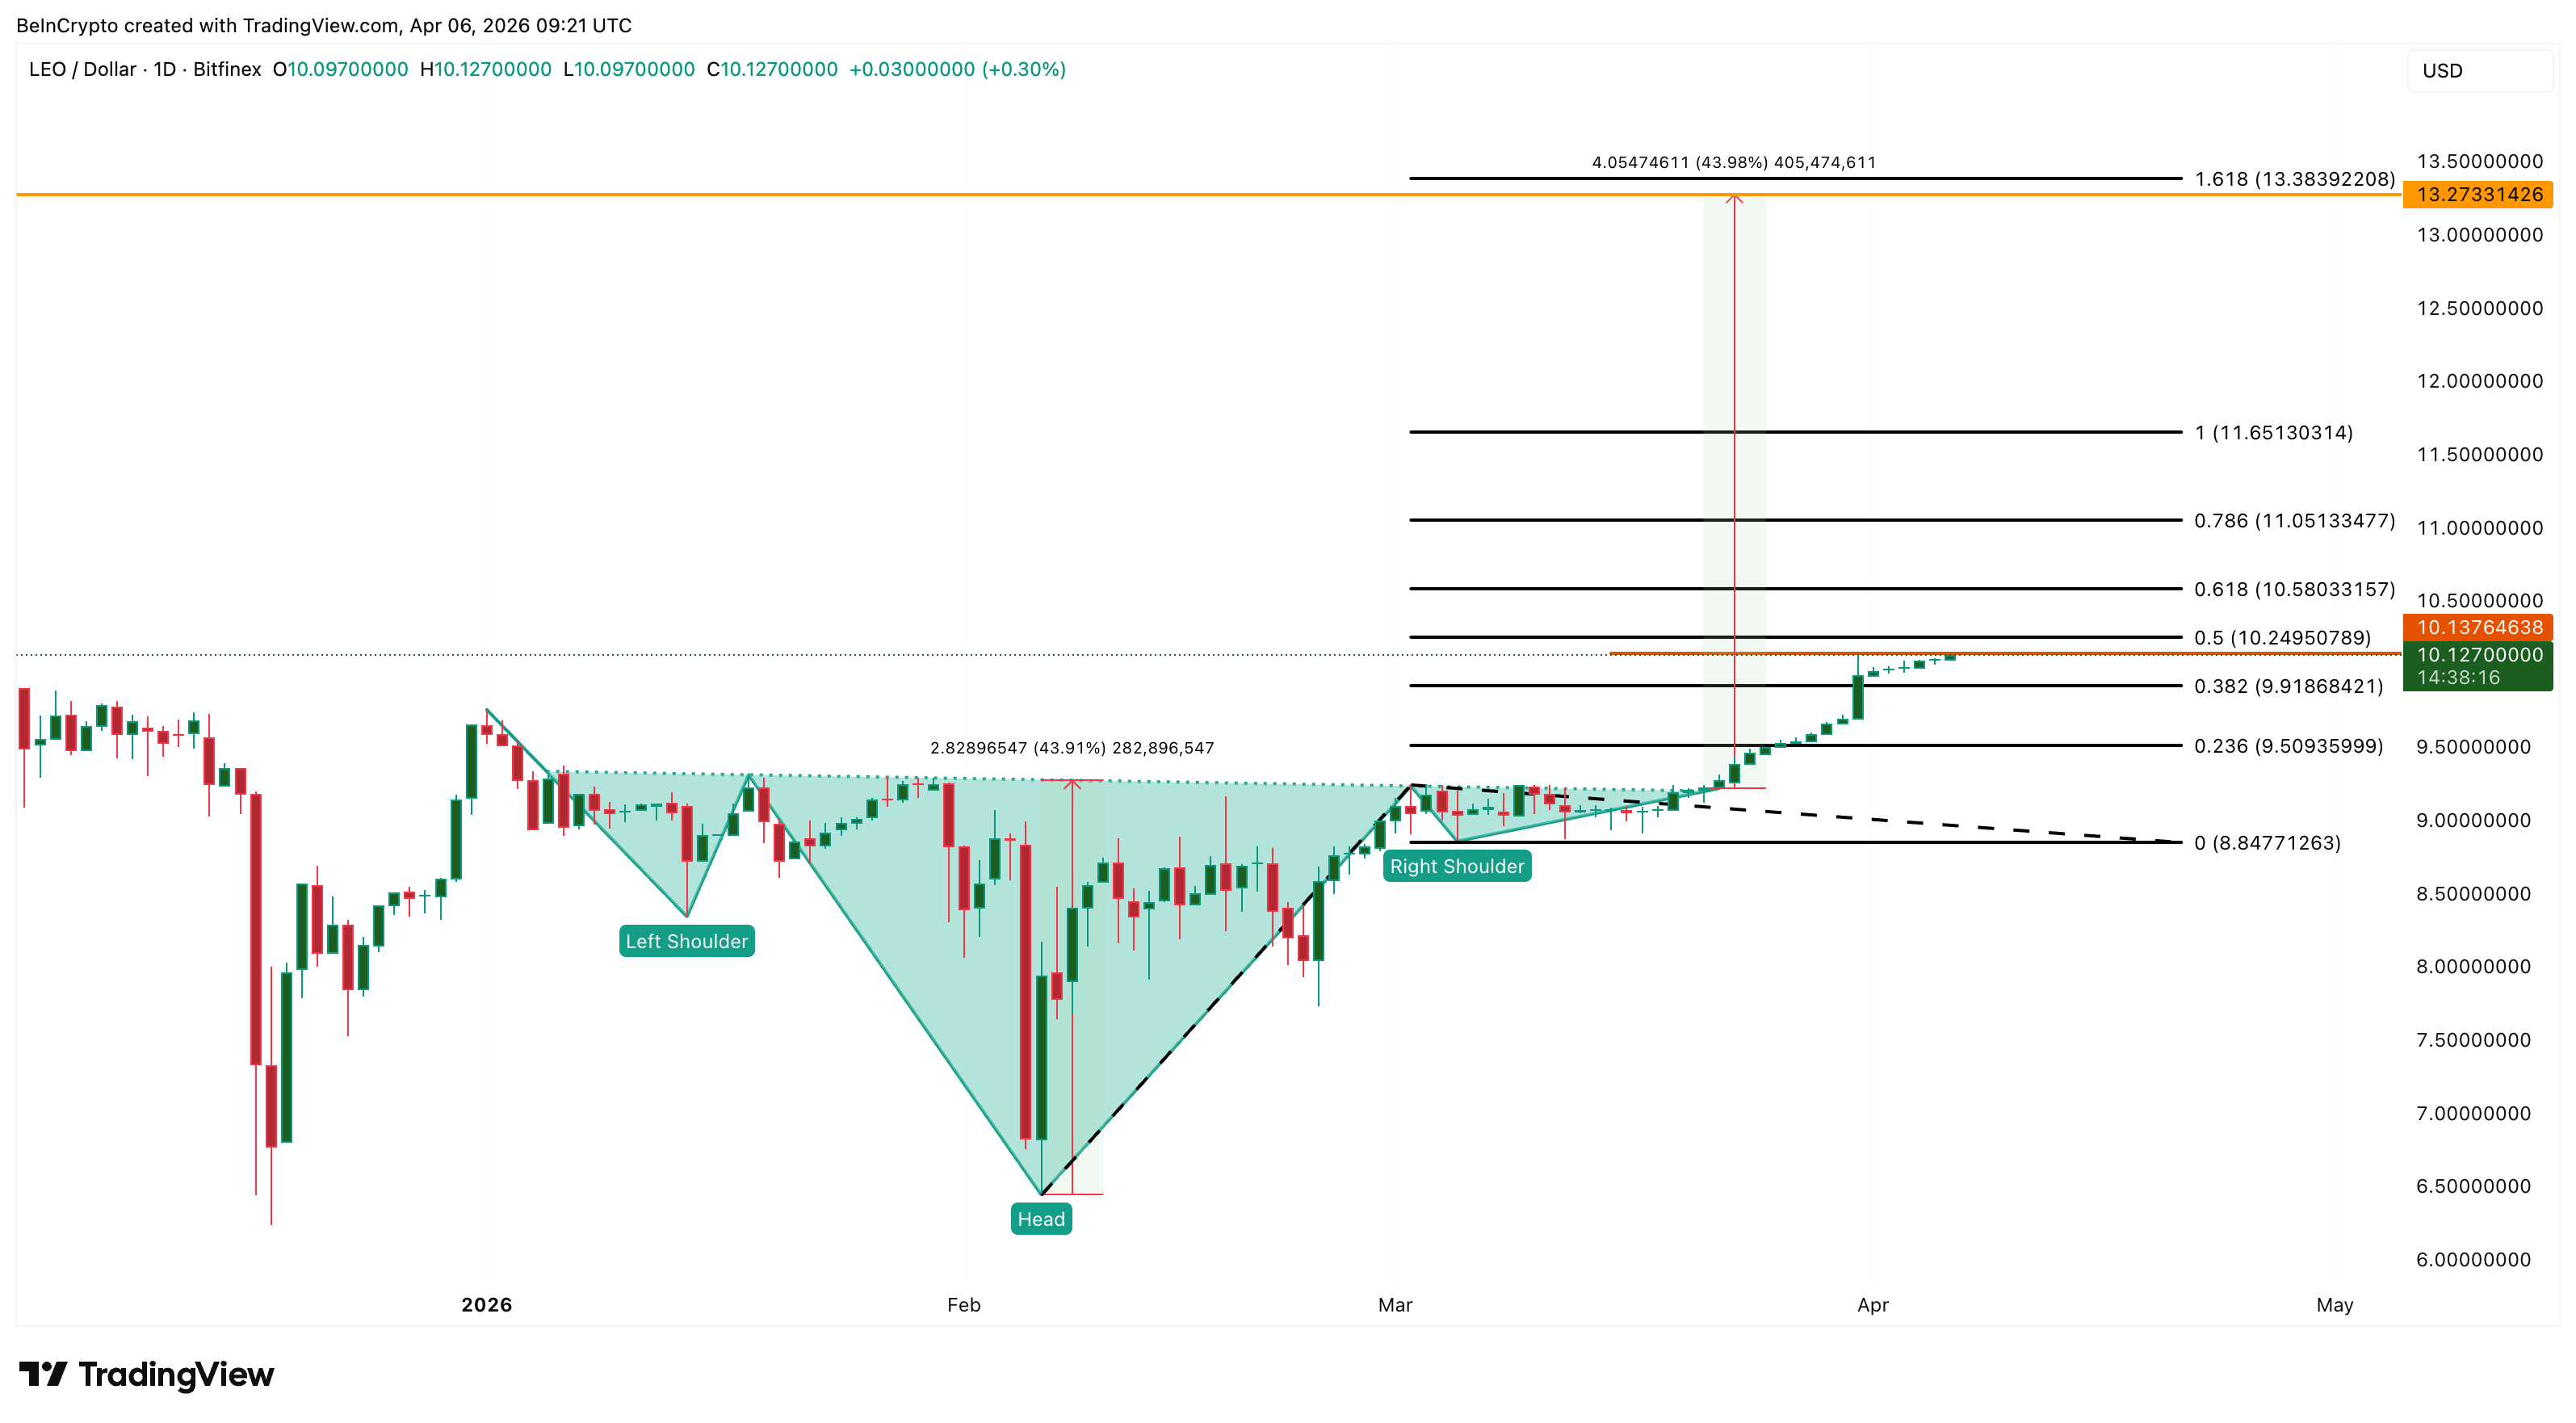
The immediate hurdles are $10.13 and $10.24. A move above $10.13 confirms a new all-time high. It also opens the path toward $10.58 and $11.05 at higher technical levels. The full pattern projection targets $13.27. On the downside, a fall below $9.91 would weaken the short-term structure, with $9.50 and $8.84 as lower supports.
The post 3 Altcoins That Could Hit New All-Time Highs in the Second Week of April 2026 appeared first on BeInCrypto.
Read moreLatest News