Solana Price Faces 12% Drop Risk as Fast Money Bets on a Bounce
Solana price is holding near a critical level, but the structure still leans bearish. After dropping nearly 5% today, SOL is now testing key support while showing early signs of a bounce.
The question is not just about price, but behavior. The most aggressive holders have started positioning again. That raises a key question. Is this the start of a recovery, or just a pause before a deeper 12% drop?
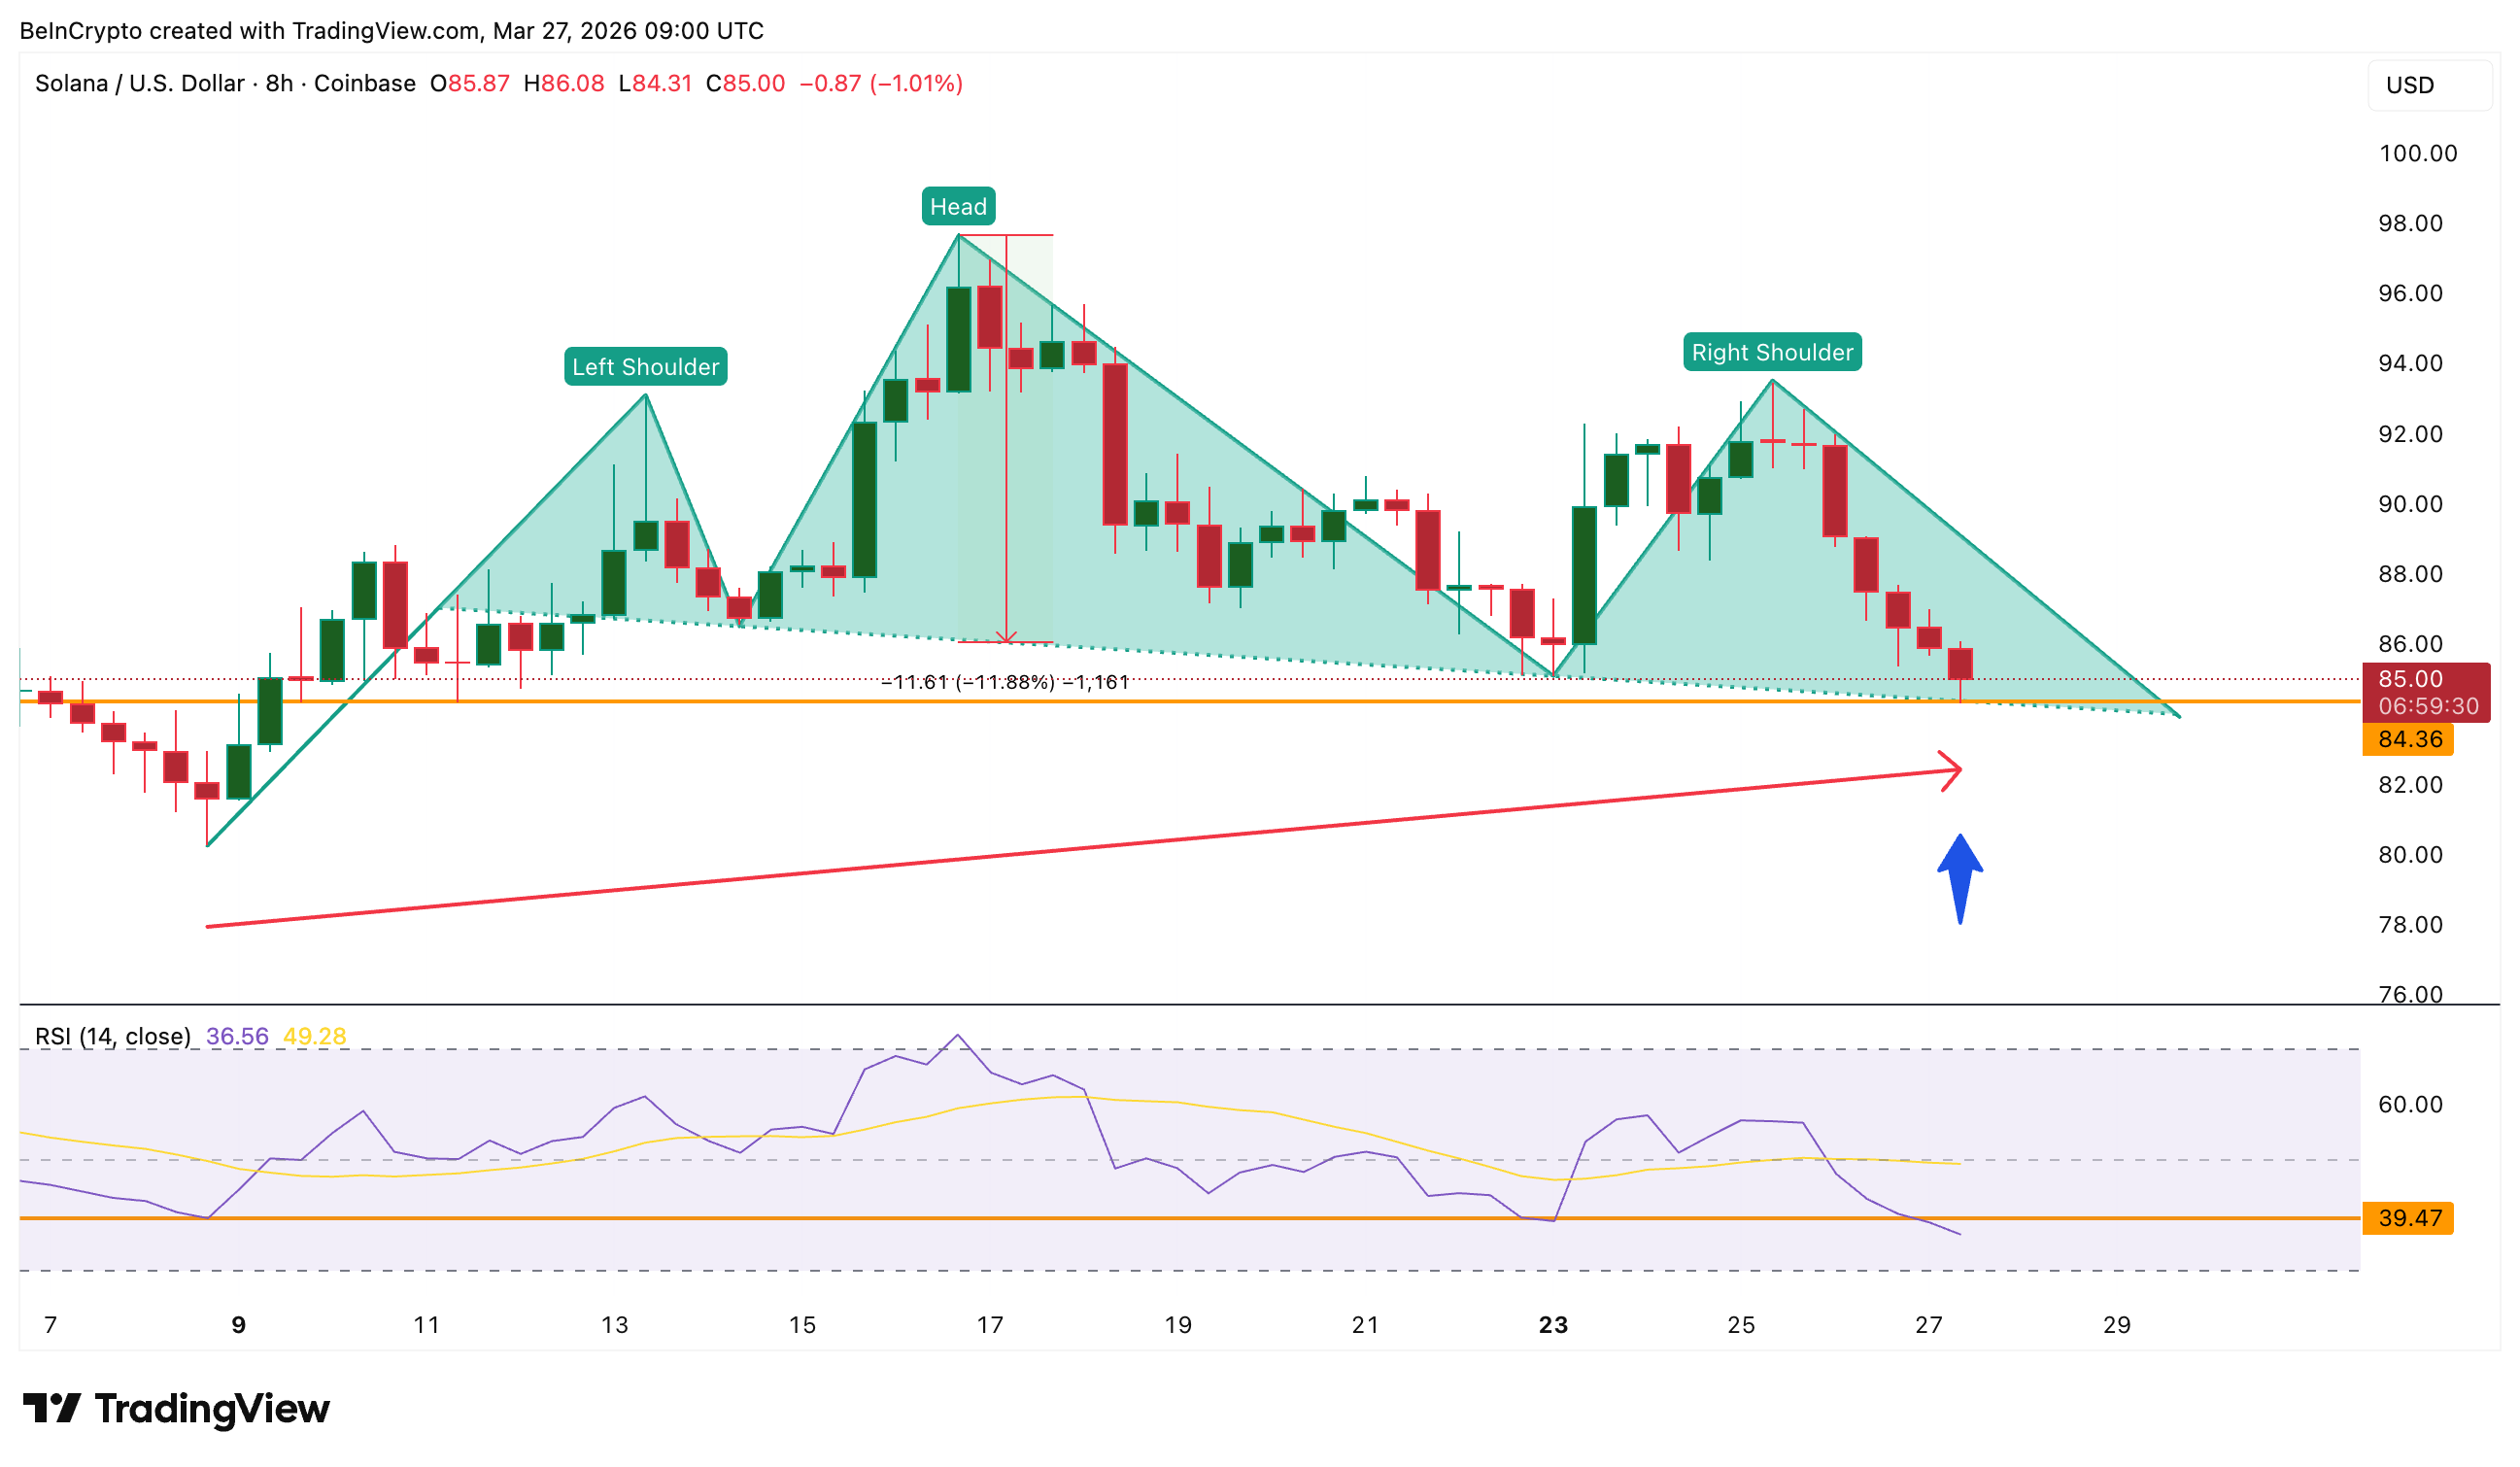
Solana Price Holds Support as Breakdown Pattern Nears Completion
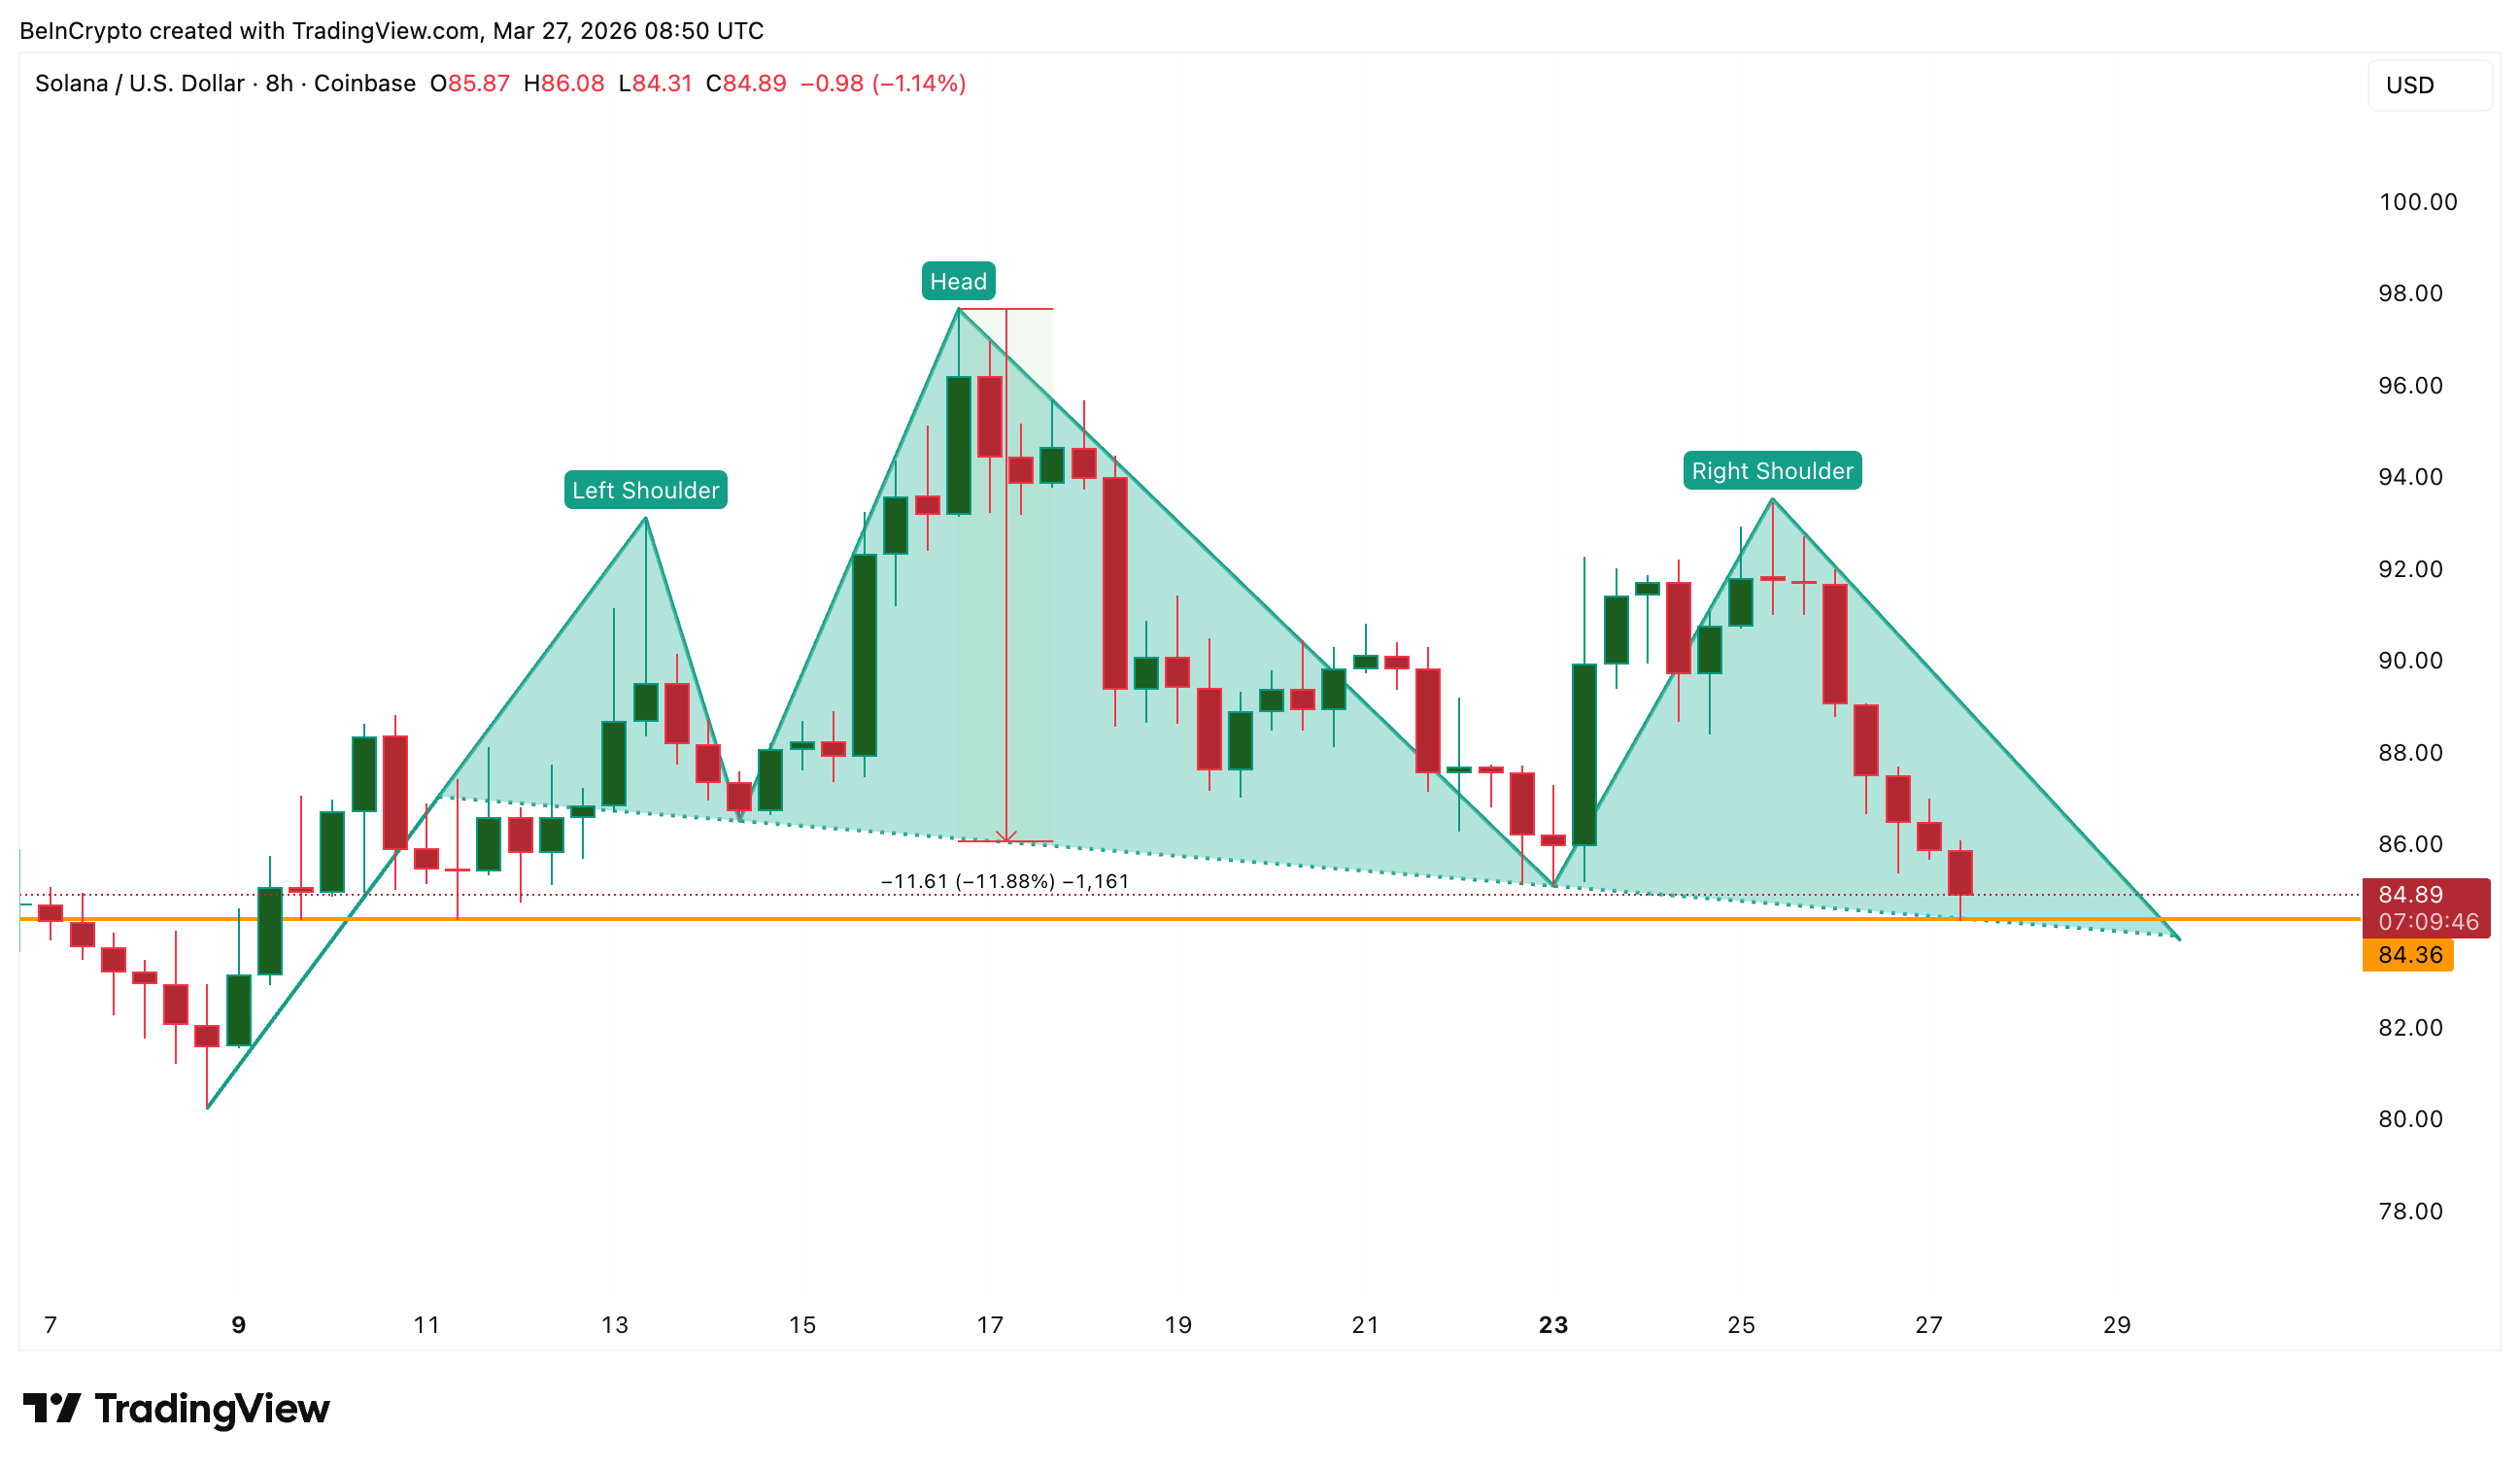
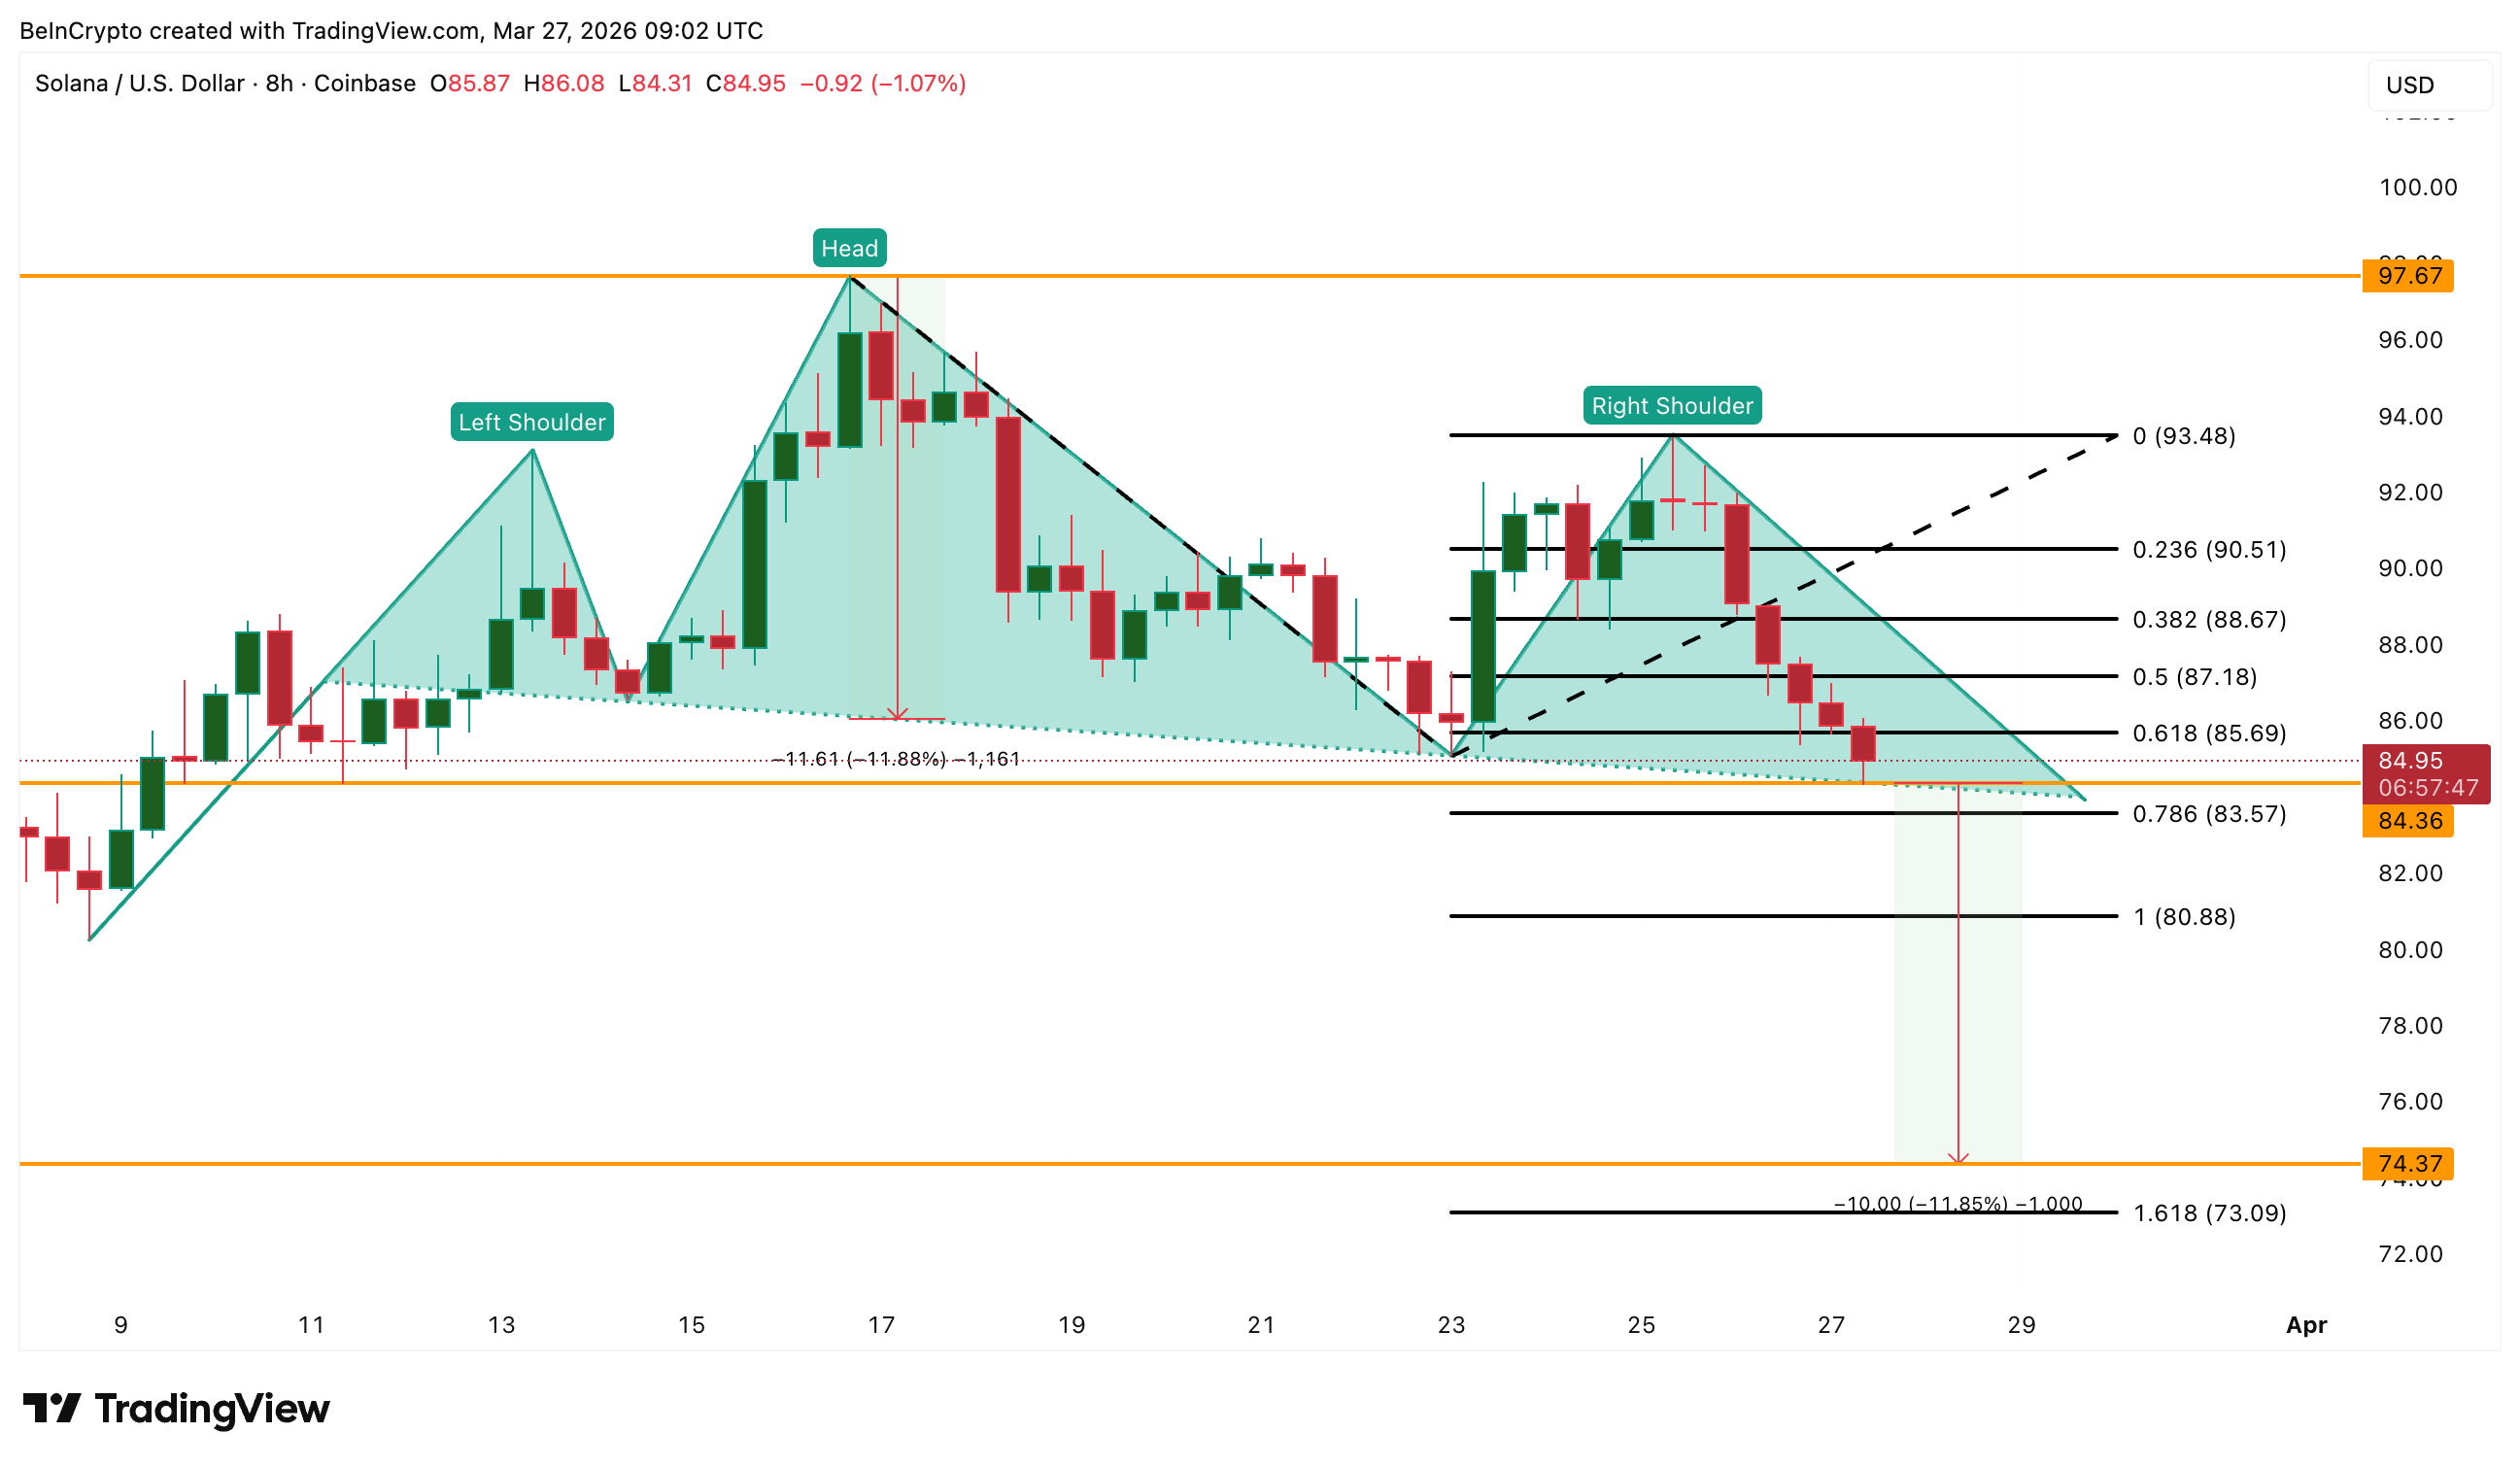
On the 8-hour chart, Solana price is nearing the completion of a head-and-shoulders pattern. This is a bearish structure that usually leads to a drop once support breaks. The neckline sits near $84.36. Price recently tested this level and formed a long lower wick. That wick shows buyers stepped in right at support.
Want more token insights like this? Sign up for Editor Harsh Notariya’s Daily Crypto Newsletter here.
So there is demand. But it is not strong enough yet.
The pattern is still active. As long as Solana remains below the right shoulder resistance, the setup remains bearish. The risk is simple. If the neckline breaks cleanly, the pattern confirms.
That opens the door for an almost 12% drop from current levels. So the market is at a decision point. Support is holding for now, but the structure is still pointing lower.
Exchange Flows Show Buying Exists, But It Is Getting Weaker
To understand that wick, we look at exchange flows.
Exchange Net Position Change tracks whether tokens are moving into or out of exchanges. Outflows usually mean accumulation. Since March 17, Solana has seen consistent outflows. That means buyers are active. This supports the idea that the neckline is seeing demand.
But there is a problem. That buying pressure is fading. On March 22, net outflows were around 2.1 million SOL. By March 26, that dropped to around 1.3 million SOL, a 38% drop. That is a sharp decline in the buying trend.
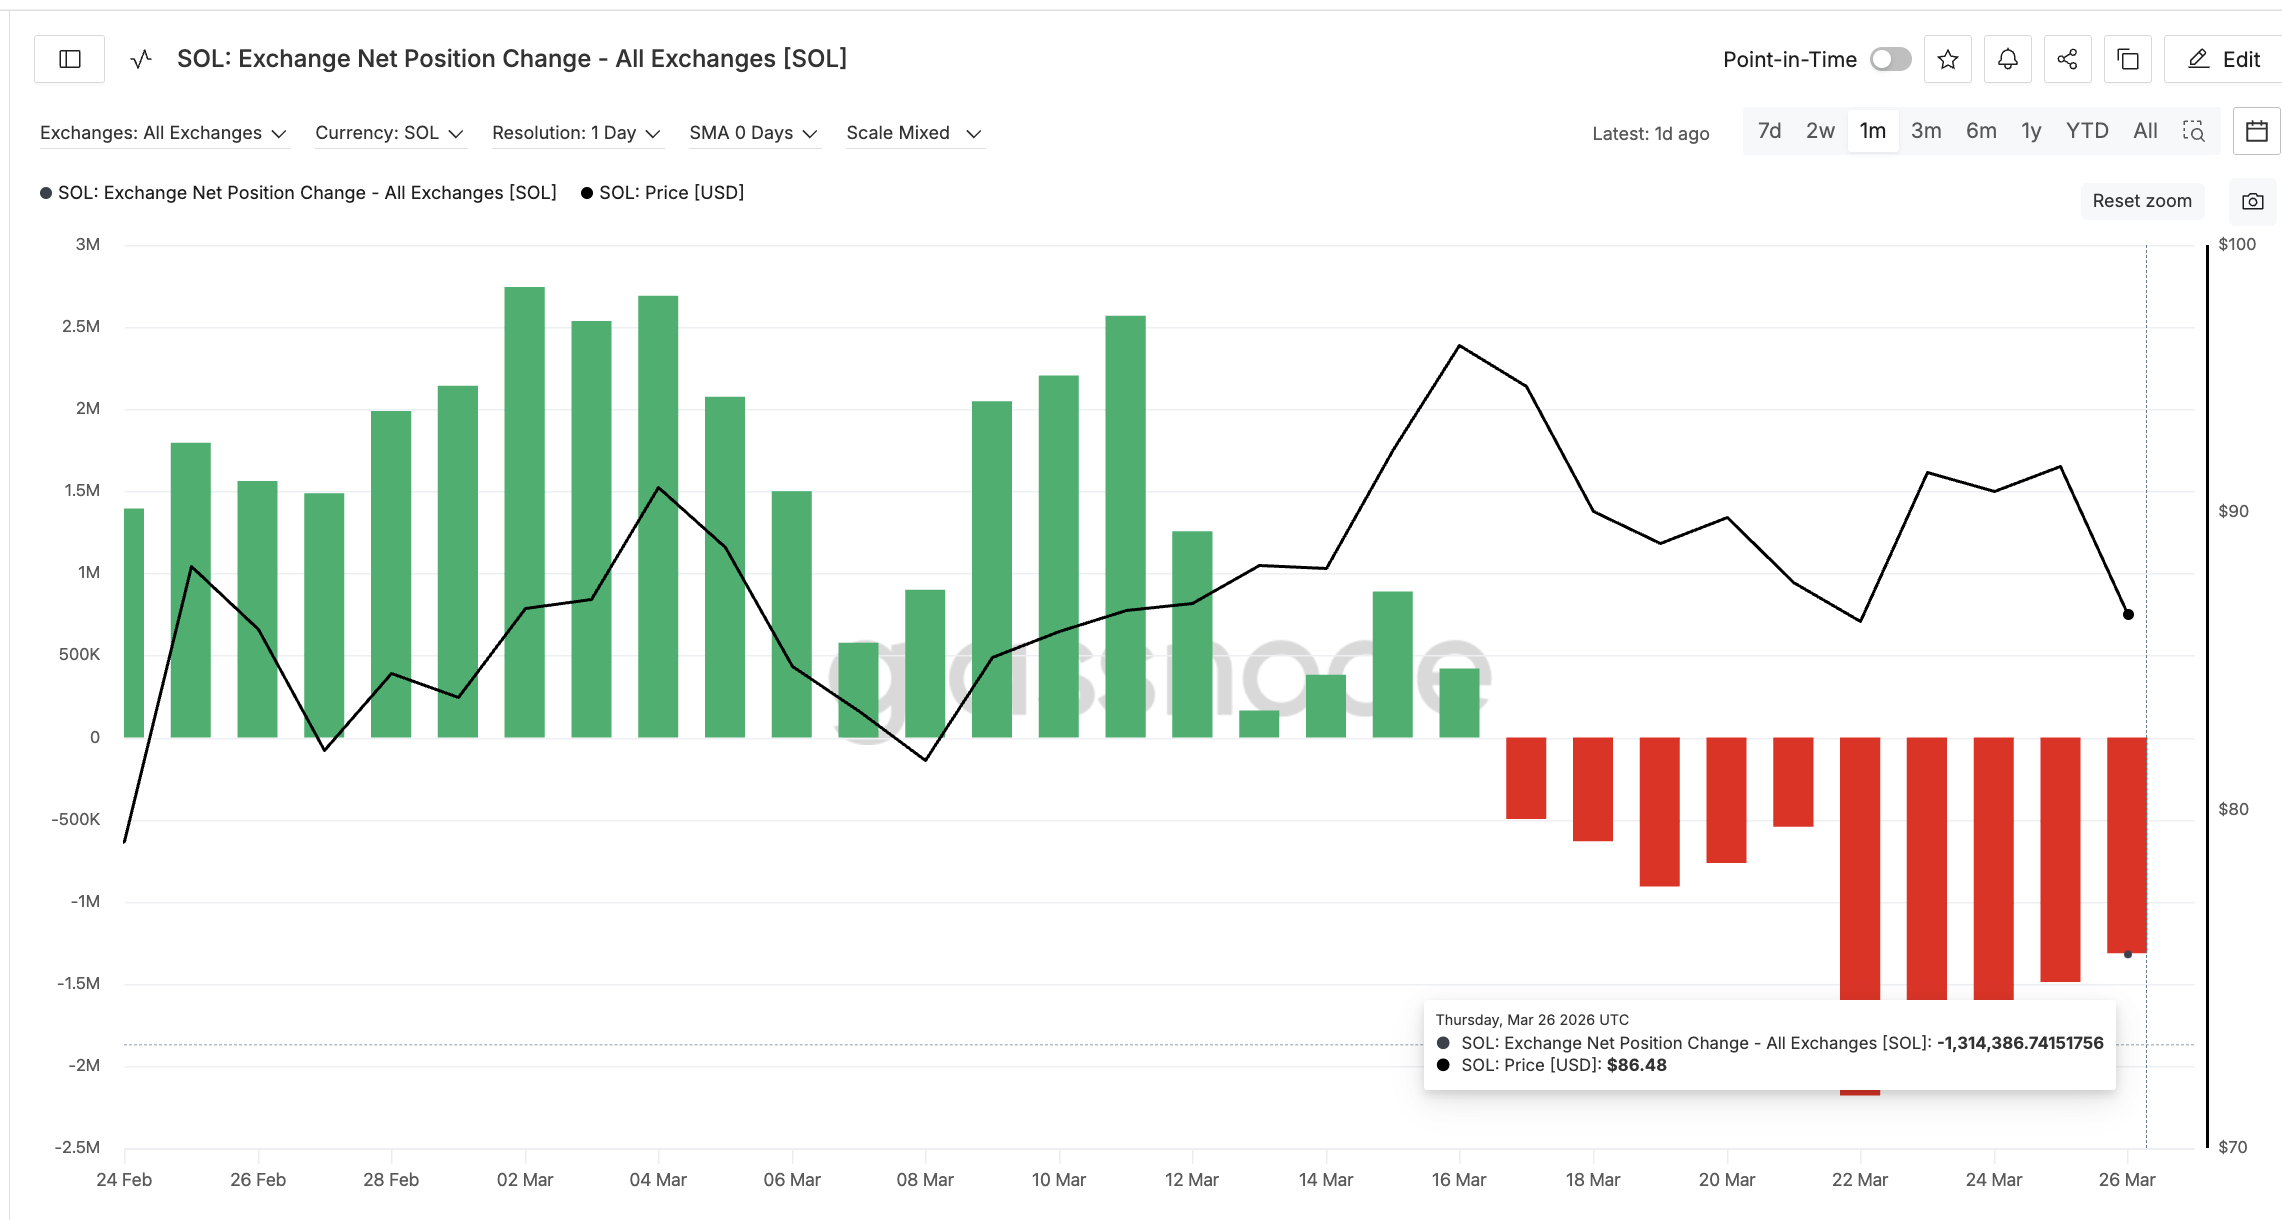
So while buyers are still present, they are not as aggressive as before. This creates a weak support zone. Enough to slow the drop, but not strong enough to fully reverse it. That is why the SOL price neckline is holding, but still at risk.
Short-Term Holders Are Re-Entering, But They Also Drive Selling
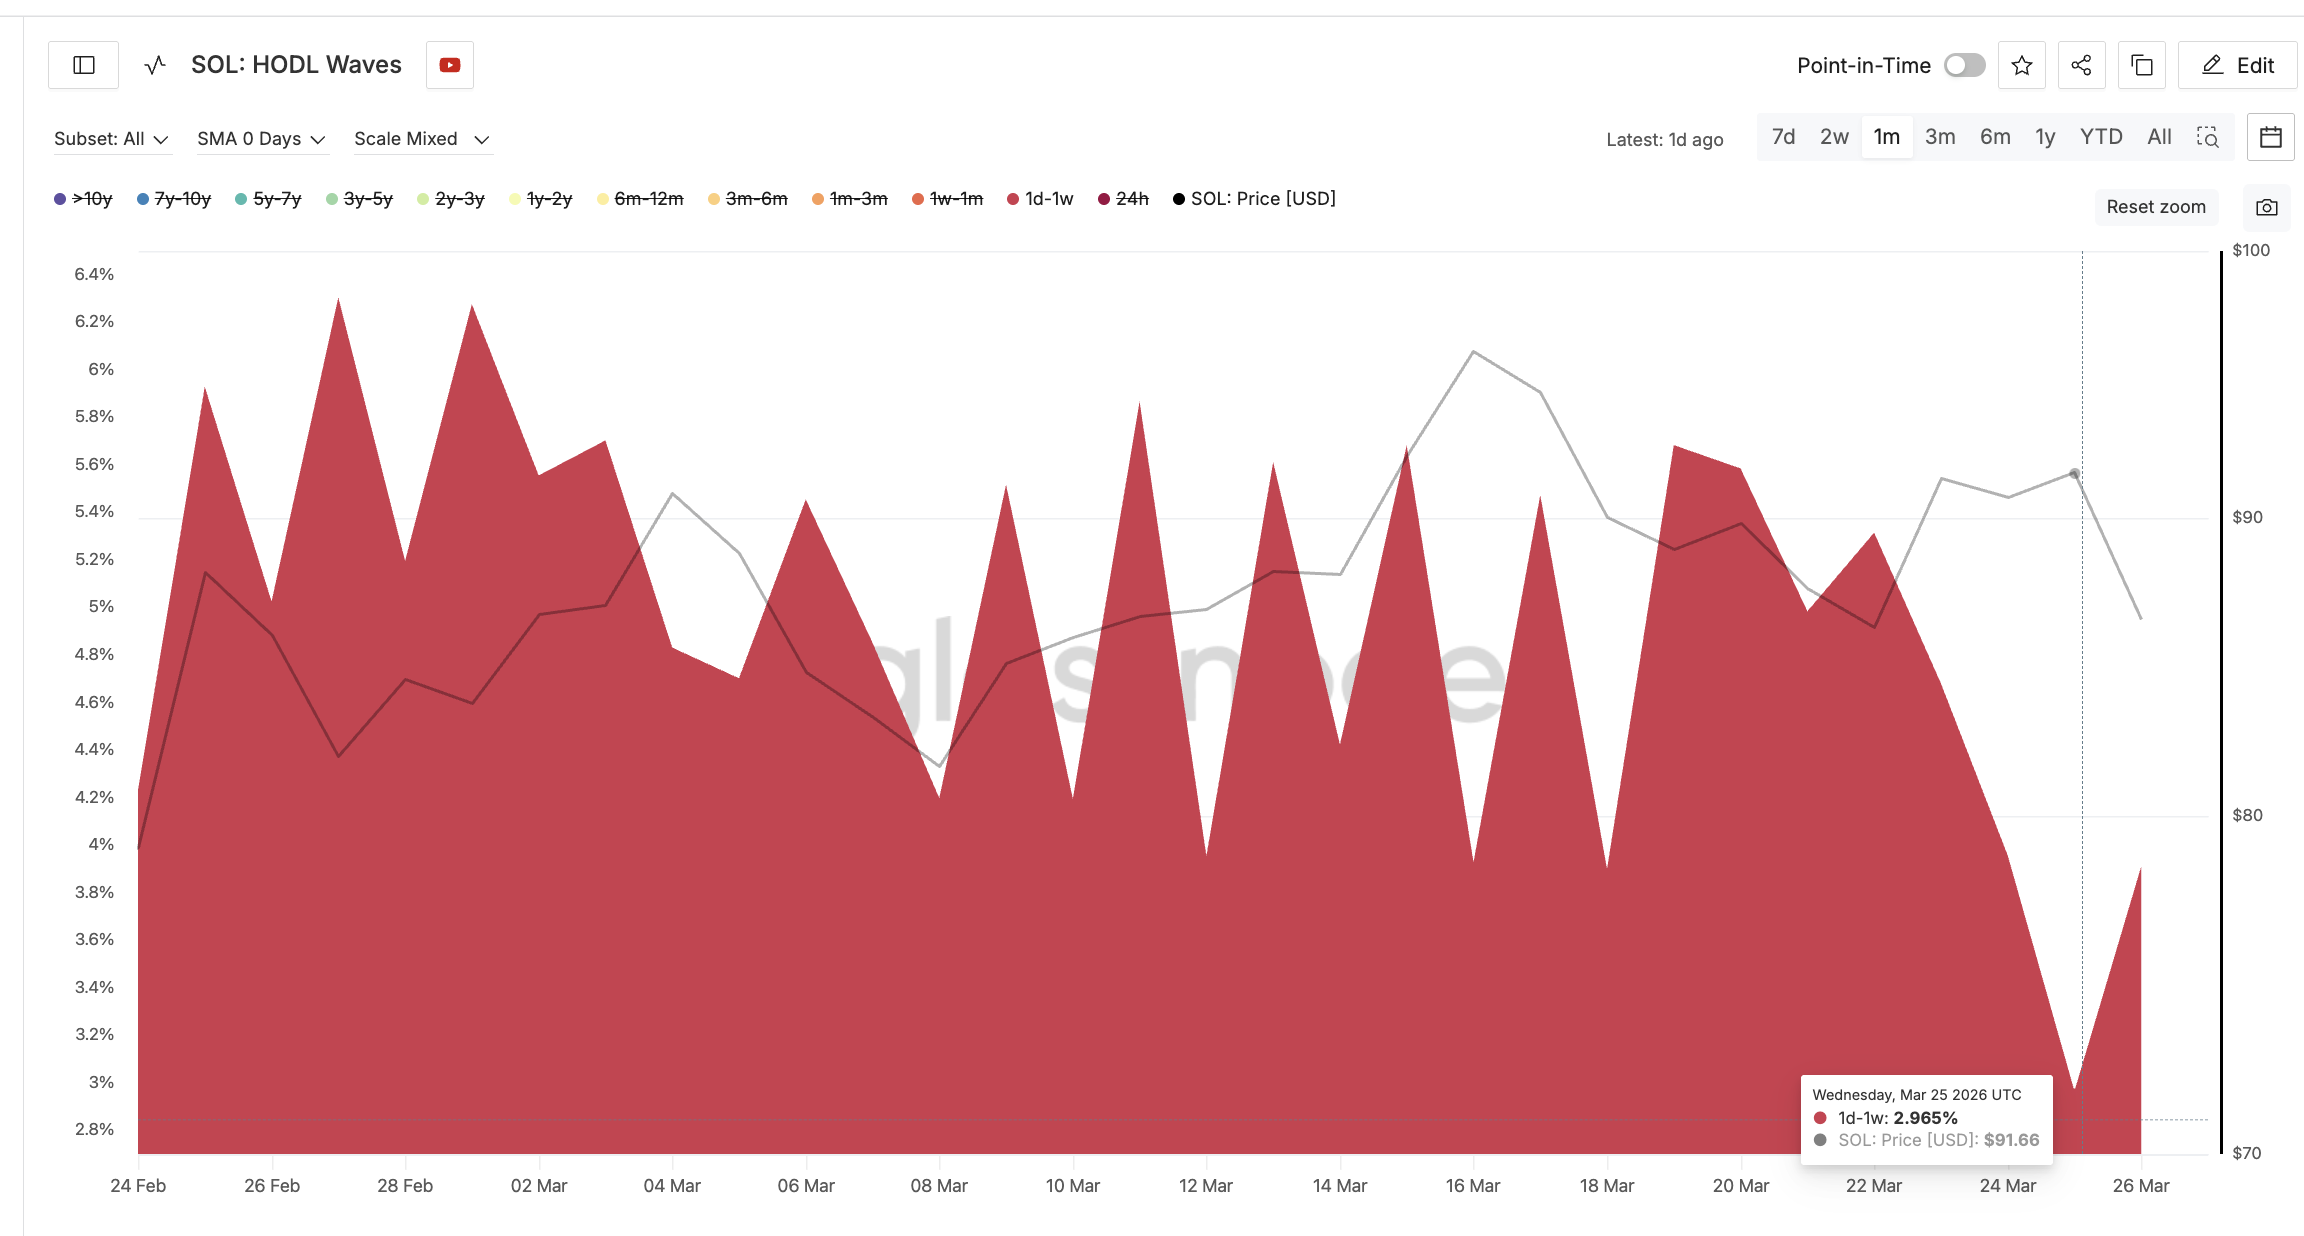
Now comes the most important part. The most aggressive cohort, holders who keep coins for one day to one week, are starting to return per the HODL waves metric. HODL Waves track how long investors hold their coins. The 1D to 1W group is the fastest-moving and most reactive.
On March 22, this cohort held around 5.31% of the supply. By March 25, it dropped to 2.96% as they sold into the decline. Now they are coming back.
Their share has increased again to around 3.9%. That means they are buying again, likely expecting a short-term bounce. This matters because this group has recently timed moves well. Their previous accumulation between March 21 and March 22 came just before a quick rally from $86 to $91.
So yes, they could be predicting a bounce again. But there is a catch.
This speculative money group also sells quickly. They do not hold through uncertainty. They create momentum, but they also end rallies early. So their return supports a bounce, but not a sustained move higher. This is where structure and behavior connect.
Key Solana Price Levels Decide Outcome
The Solana price chart is now starting to reflect this setup.
On the 8-hour timeframe, Solana price is forming a hidden bullish divergence. Price is making higher lows, while RSI is making lower lows. RSI, or Relative Strength Index, measures buying strength. When RSI falls, but price holds, it suggests selling pressure is weakening.
But this only confirms if the next candle holds above the current low. If that happens, the bounce becomes valid.
Then the Solana price needs to reclaim key levels:
- $85.69 as immediate strength confirmation
- $87.18 as follow-through
- $93.48 to weaken the bearish structure
Only a clean move above $93.48 starts breaking the pattern. Full invalidation happens above $97.67, the head of the pattern.
On the downside, the key trigger remains the same. If Solana loses $84.36, the neckline breaks. That can push the price toward $80.88 first, and then toward $74.37 based on the pattern projection. So the setup is clear.
A Solana price bounce can happen. The most aggressive cohort is already positioning for it. RSI is starting to support it. Exchange flows still show buying.
But all of that is happening within a bearish structure, with the neckline at $84.36 determining the next leg. If buyers fail to reclaim higher levels, the same participants driving the bounce could also accelerate the breakdown. That is why the 12% downside risk still remains.
The post Solana Price Faces 12% Drop Risk as Fast Money Bets on a Bounce appeared first on BeInCrypto.
Read moreLatest News