
Ethereum Staking Demand Falls 50% – ETH Price in More Trouble?
The Ethereum price action has not inspired much confidence recently. It has stayed mostly flat over the past 24 hours and remains down over 5% in the past seven days. Yet a small recovery attempt is underway. Since February 19, Ethereum has rebounded about 4.5%, helped by a bullish divergence on the daily chart.
This signal usually suggests that selling pressure is weakening. But at the same time, a sharp drop in staking demand is raising a new question. Is returning liquidity quietly building pressure against this recovery?
Bullish Divergence Appears, Yet Falling Staking Demand May Be Returning Supply
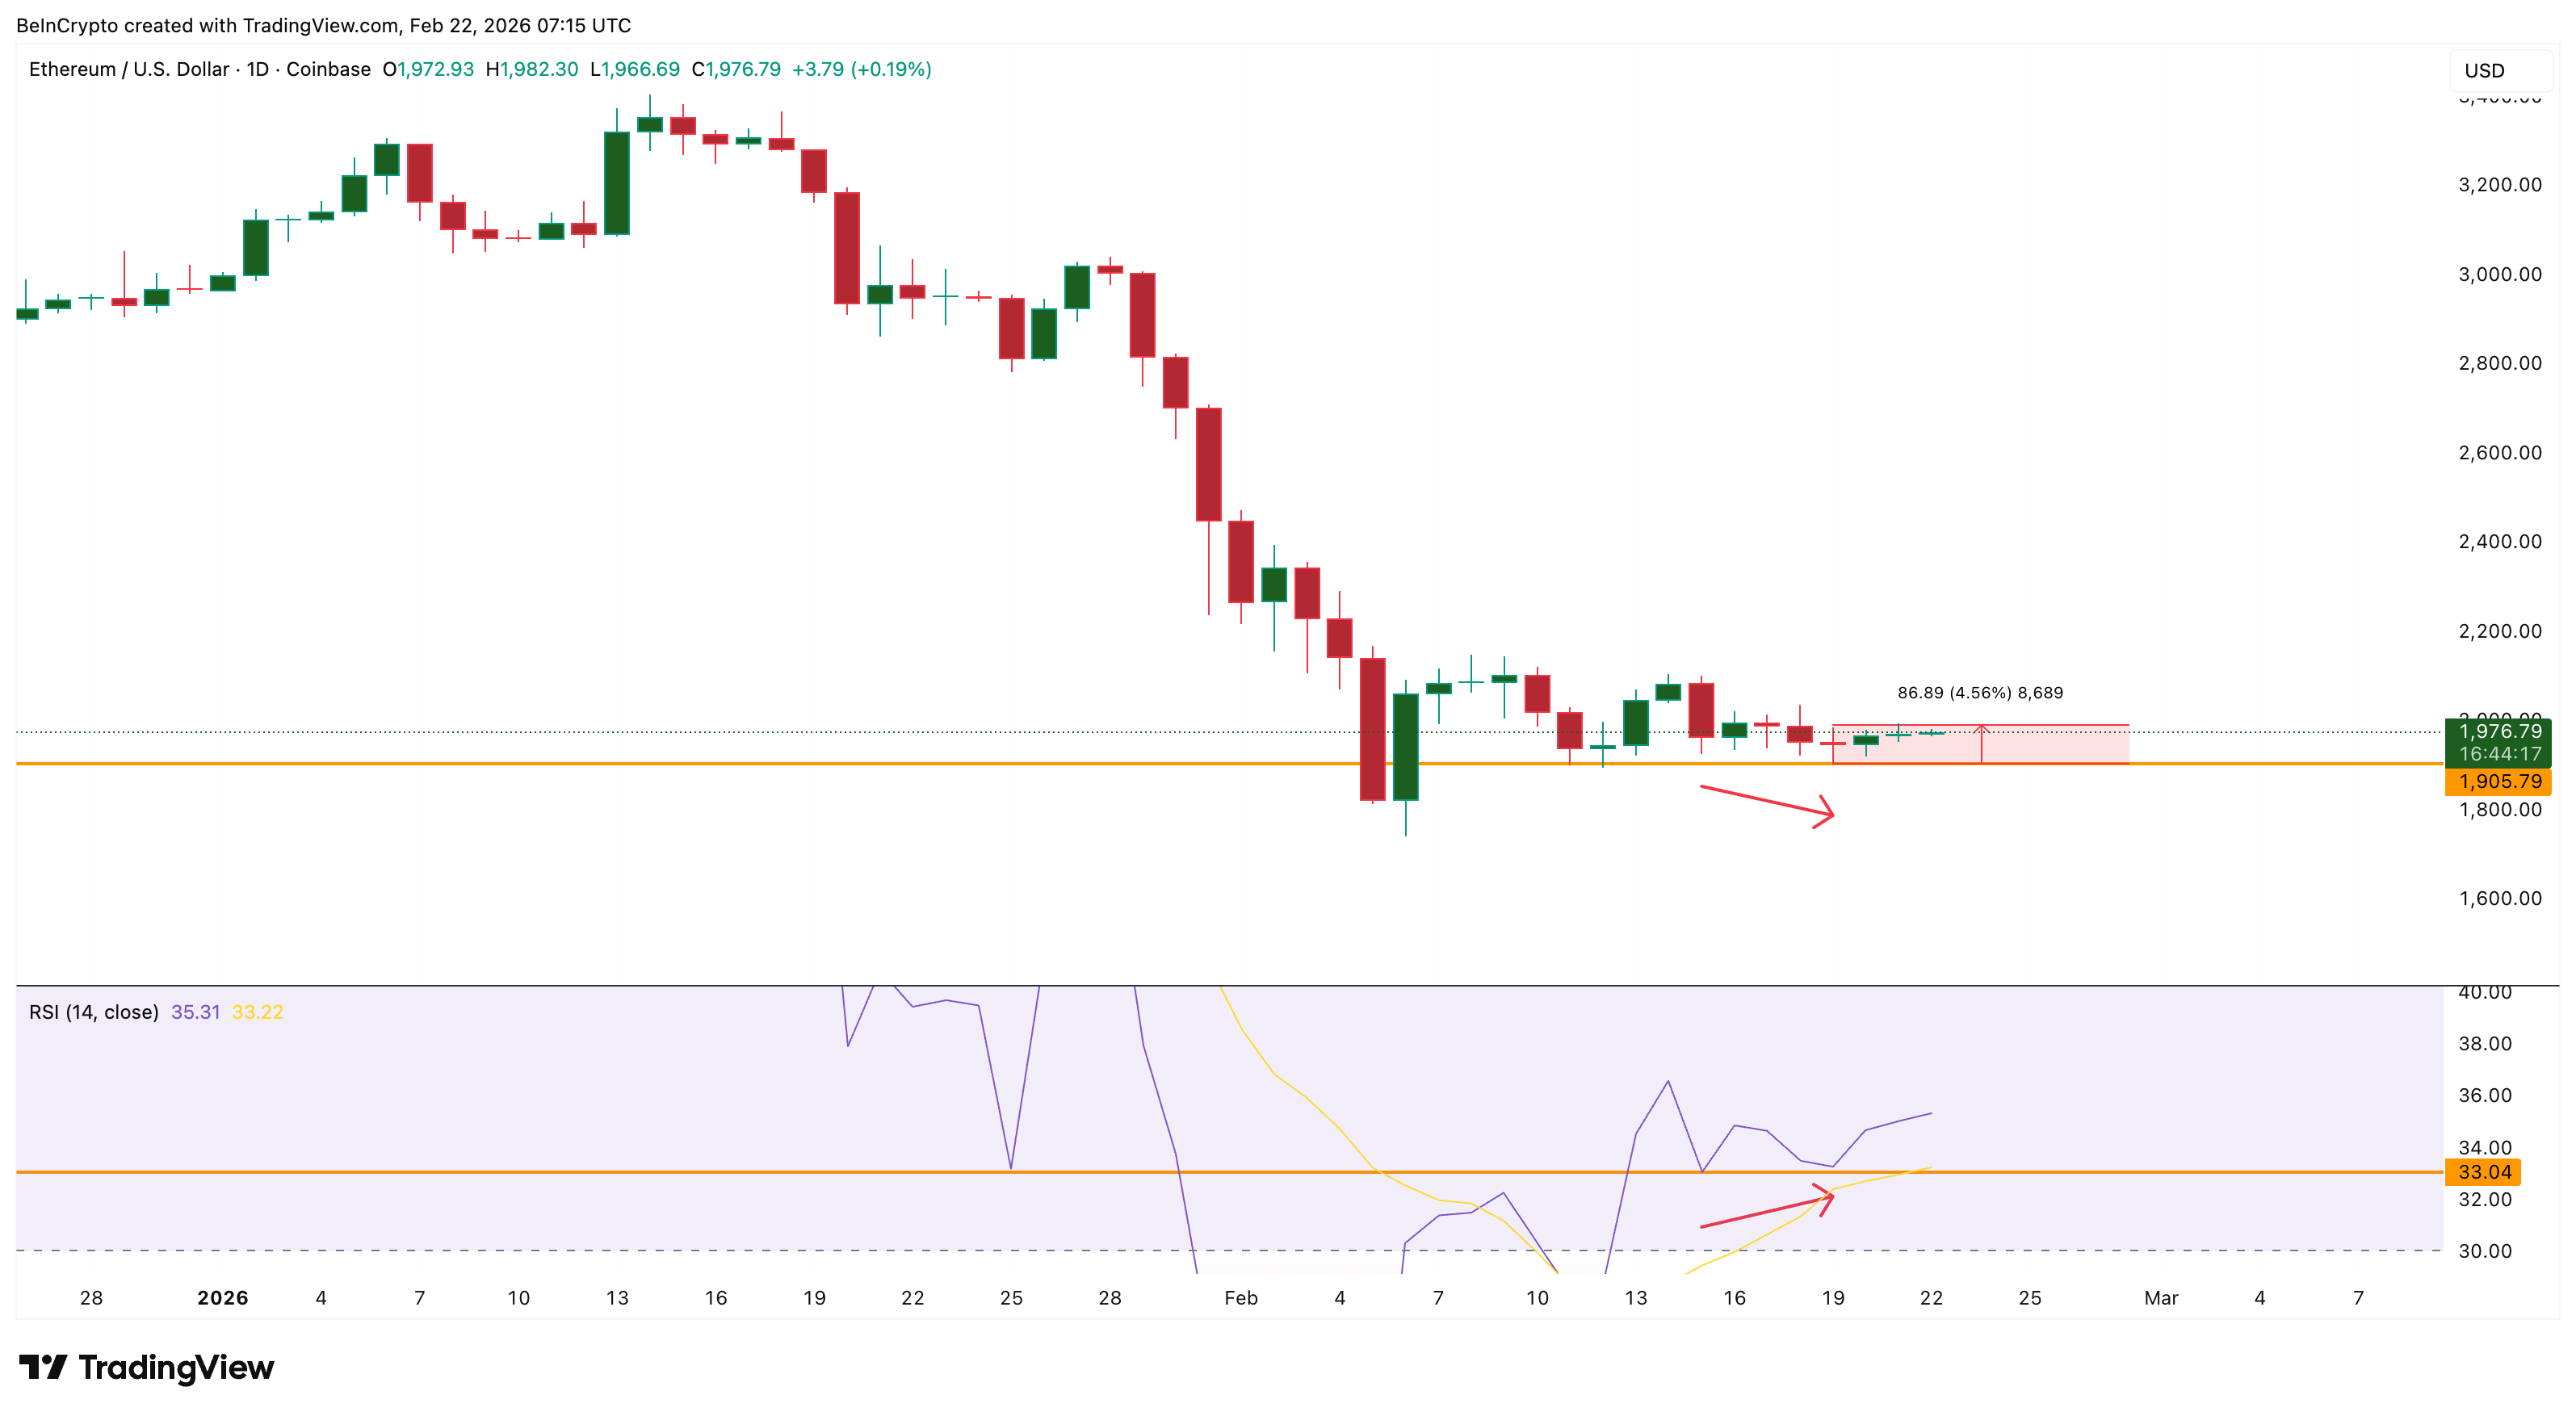
Ethereum’s recent rebound began after a bullish divergence formed between February 15 and February 19. A bullish divergence occurs when the price makes a lower low while the Relative Strength Index (RSI) makes a higher low. RSI is a momentum indicator that shows whether selling or buying pressure is stronger.
When RSI improves while price falls, it often signals that sellers are losing strength, allowing a rebound to begin. This is why Ethereum managed to recover from its February 6 low near $1,740 and climb back toward $1,970, at press time.
Want more token insights like this? Sign up for Editor Harsh Notariya’s Daily Crypto Newsletter here.
However, while the chart signaled recovery, Ethereum’s staking data, compiled exclusively by BeInCrypto analysts, began to show the opposite trend.
Staking means locking ETH inside the network to help secure Ethereum and earn rewards. When ETH is staked, it reduces the liquid supply because those coins cannot be easily sold.
But when demand falls, that supply can return to the market and increase selling risk.
Ethereum’s 6-month cumulative net staking deposits dropped from 1,994,282 ETH on January 13 to 1,008,012 ETH on February 22. This is a decline of about 986,000 ETH, or nearly 50%.
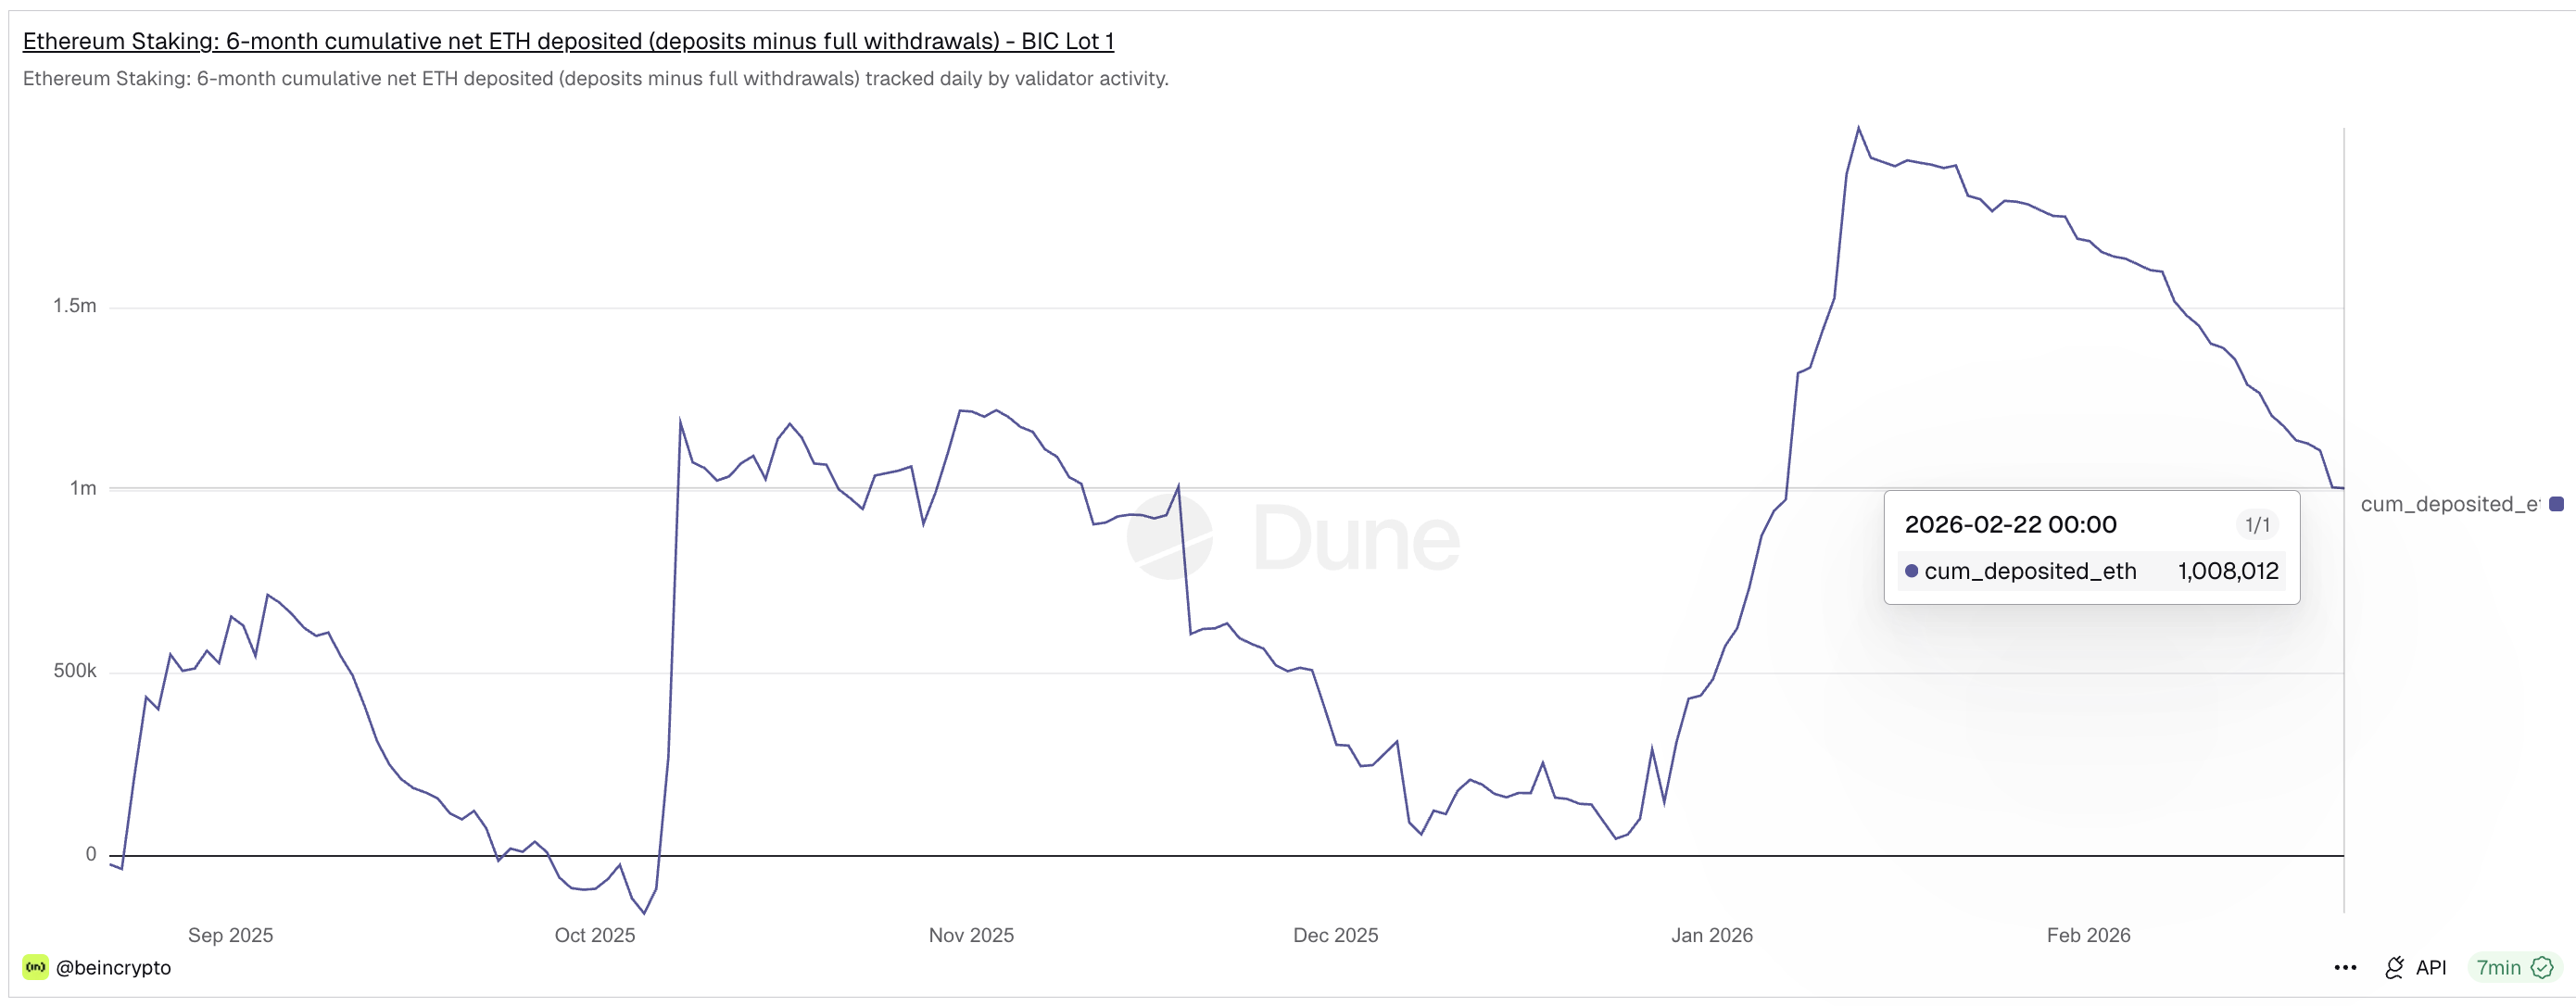
This sharp drop means far less ETH is being absorbed into staking. This allows more ETH to remain liquid or available in the market. This creates a direct conflict.
The bullish divergence suggests recovery, but falling staking demand suggests liquidity is returning. So the key question becomes clear.
Where is this returning ETH going?
Exchange Balances And Whale Selling Show Liquidity Is Already Moving
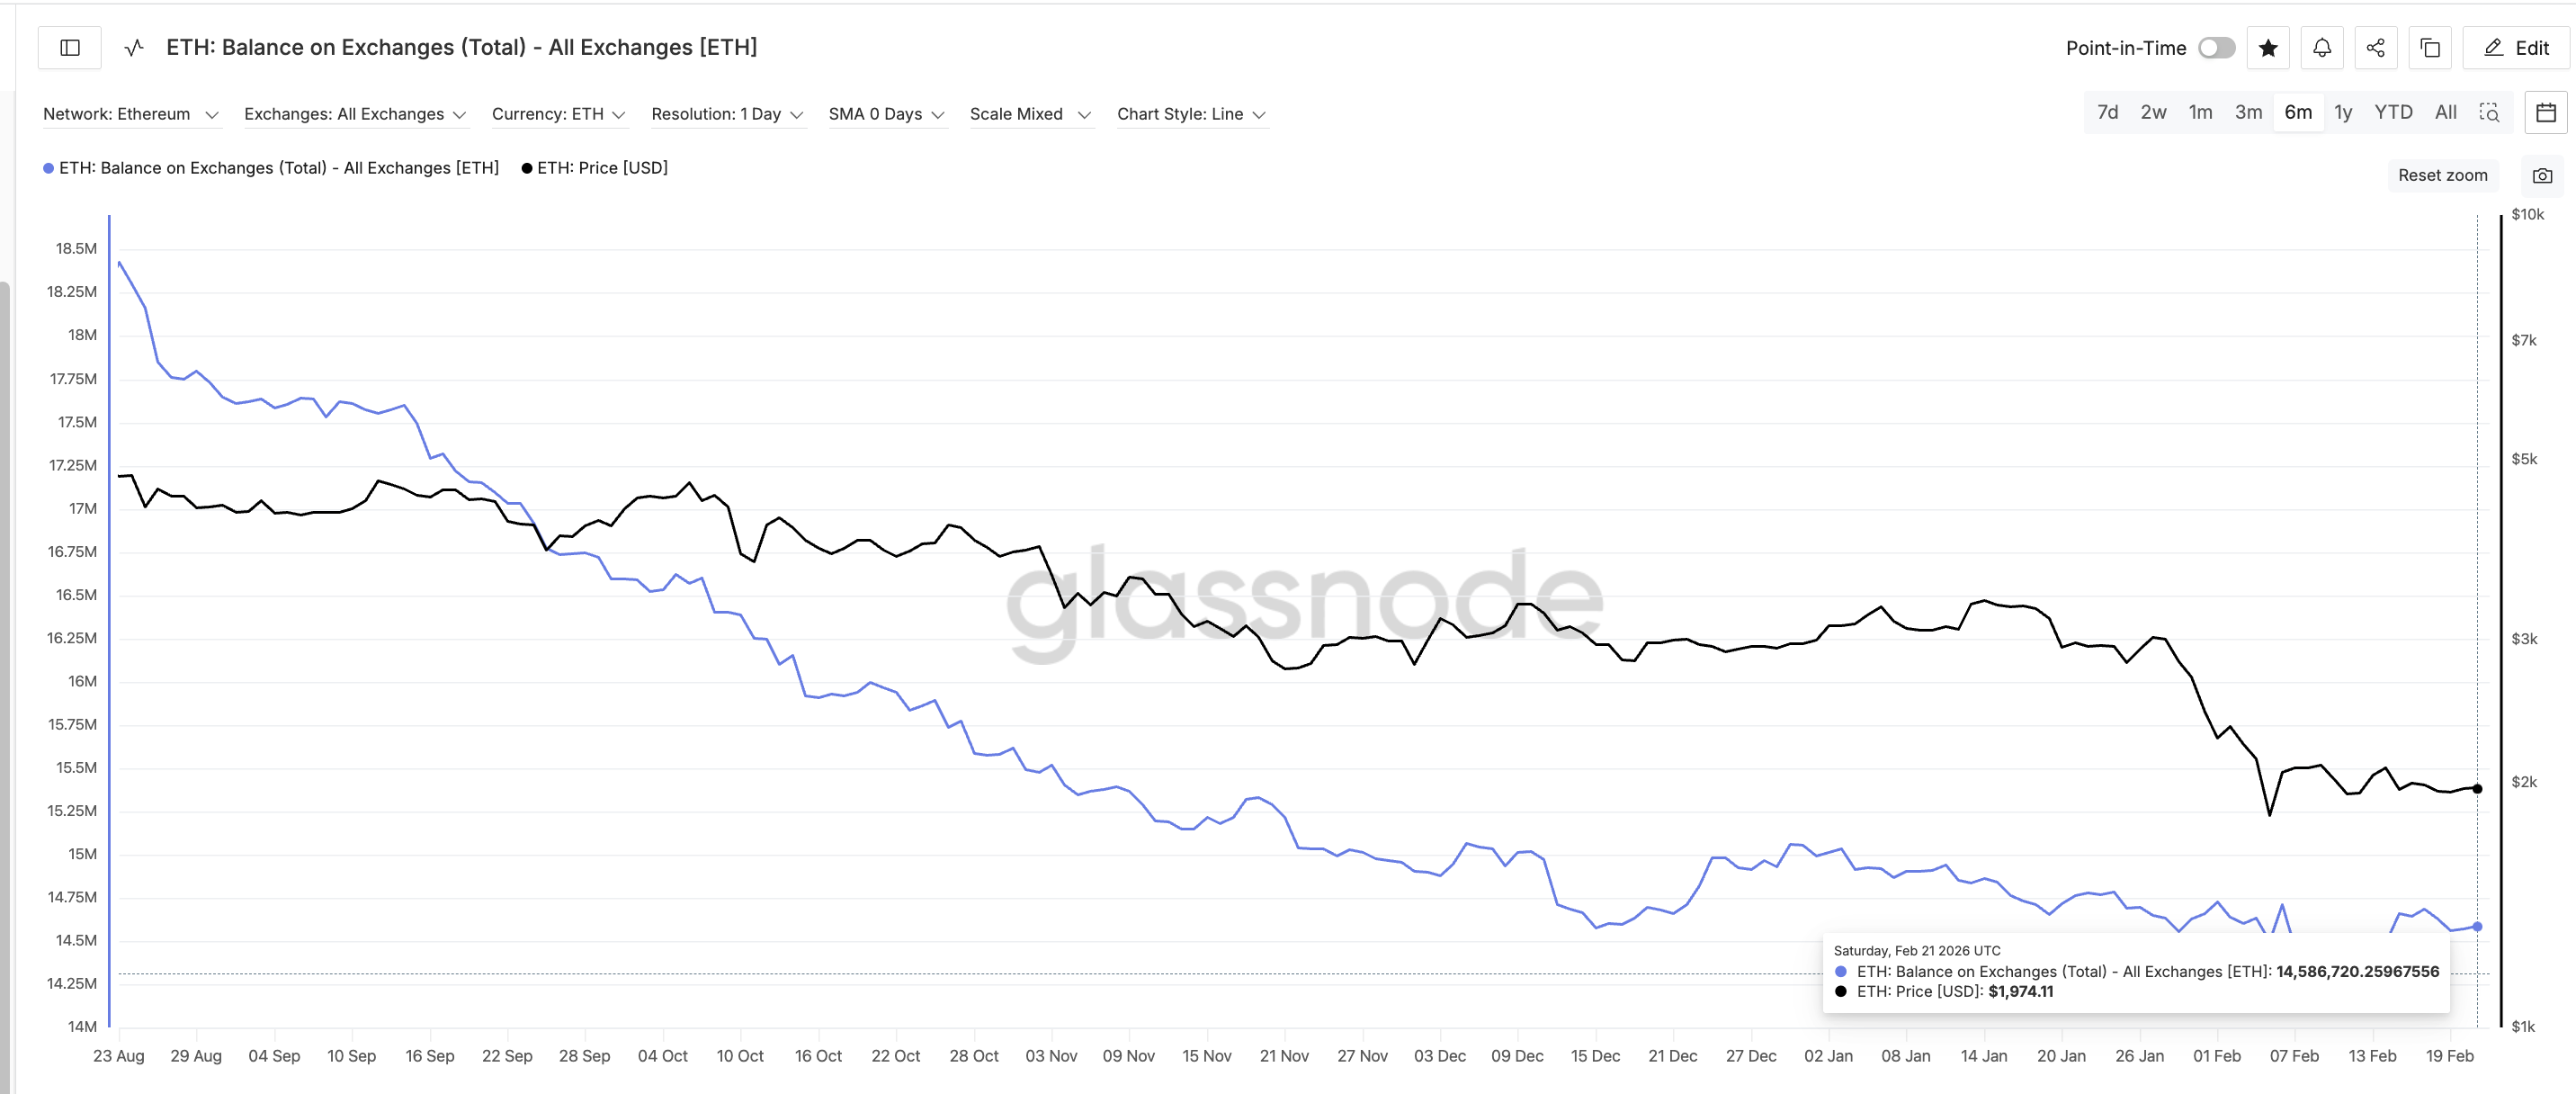
Exchange balance data provides the first clue. Ethereum balances on exchanges recently rose from 14,241,203 ETH to 14,586,720 ETH. This is an increase of about 345,500 ETH, or roughly 2.4%, in a short time.
Exchange balances measure how much ETH is available on trading platforms. When this number rises, it usually means more ETH is available to sell.
This level is especially important because it matches levels last seen on February 4.
At that time, Ethereum’s price fell sharply from $2,140 to $1,820 in just one day, a drop of nearly 15%. This shows how rising exchange supply can quickly translate into selling pressure.
The timing also aligns closely with the staking decline, confirming that falling staking demand is contributing to rising liquid supply.
ETH whale behavior is reinforcing this trend. Whales are large holders whose buying and selling can influence price direction. Since February 19, whale holdings have dropped from 113.65 million ETH to 113.42 million ETH.
This means whales sold about 230,000 ETH in just three days. This selling happened while Ethereum was attempting to recover.
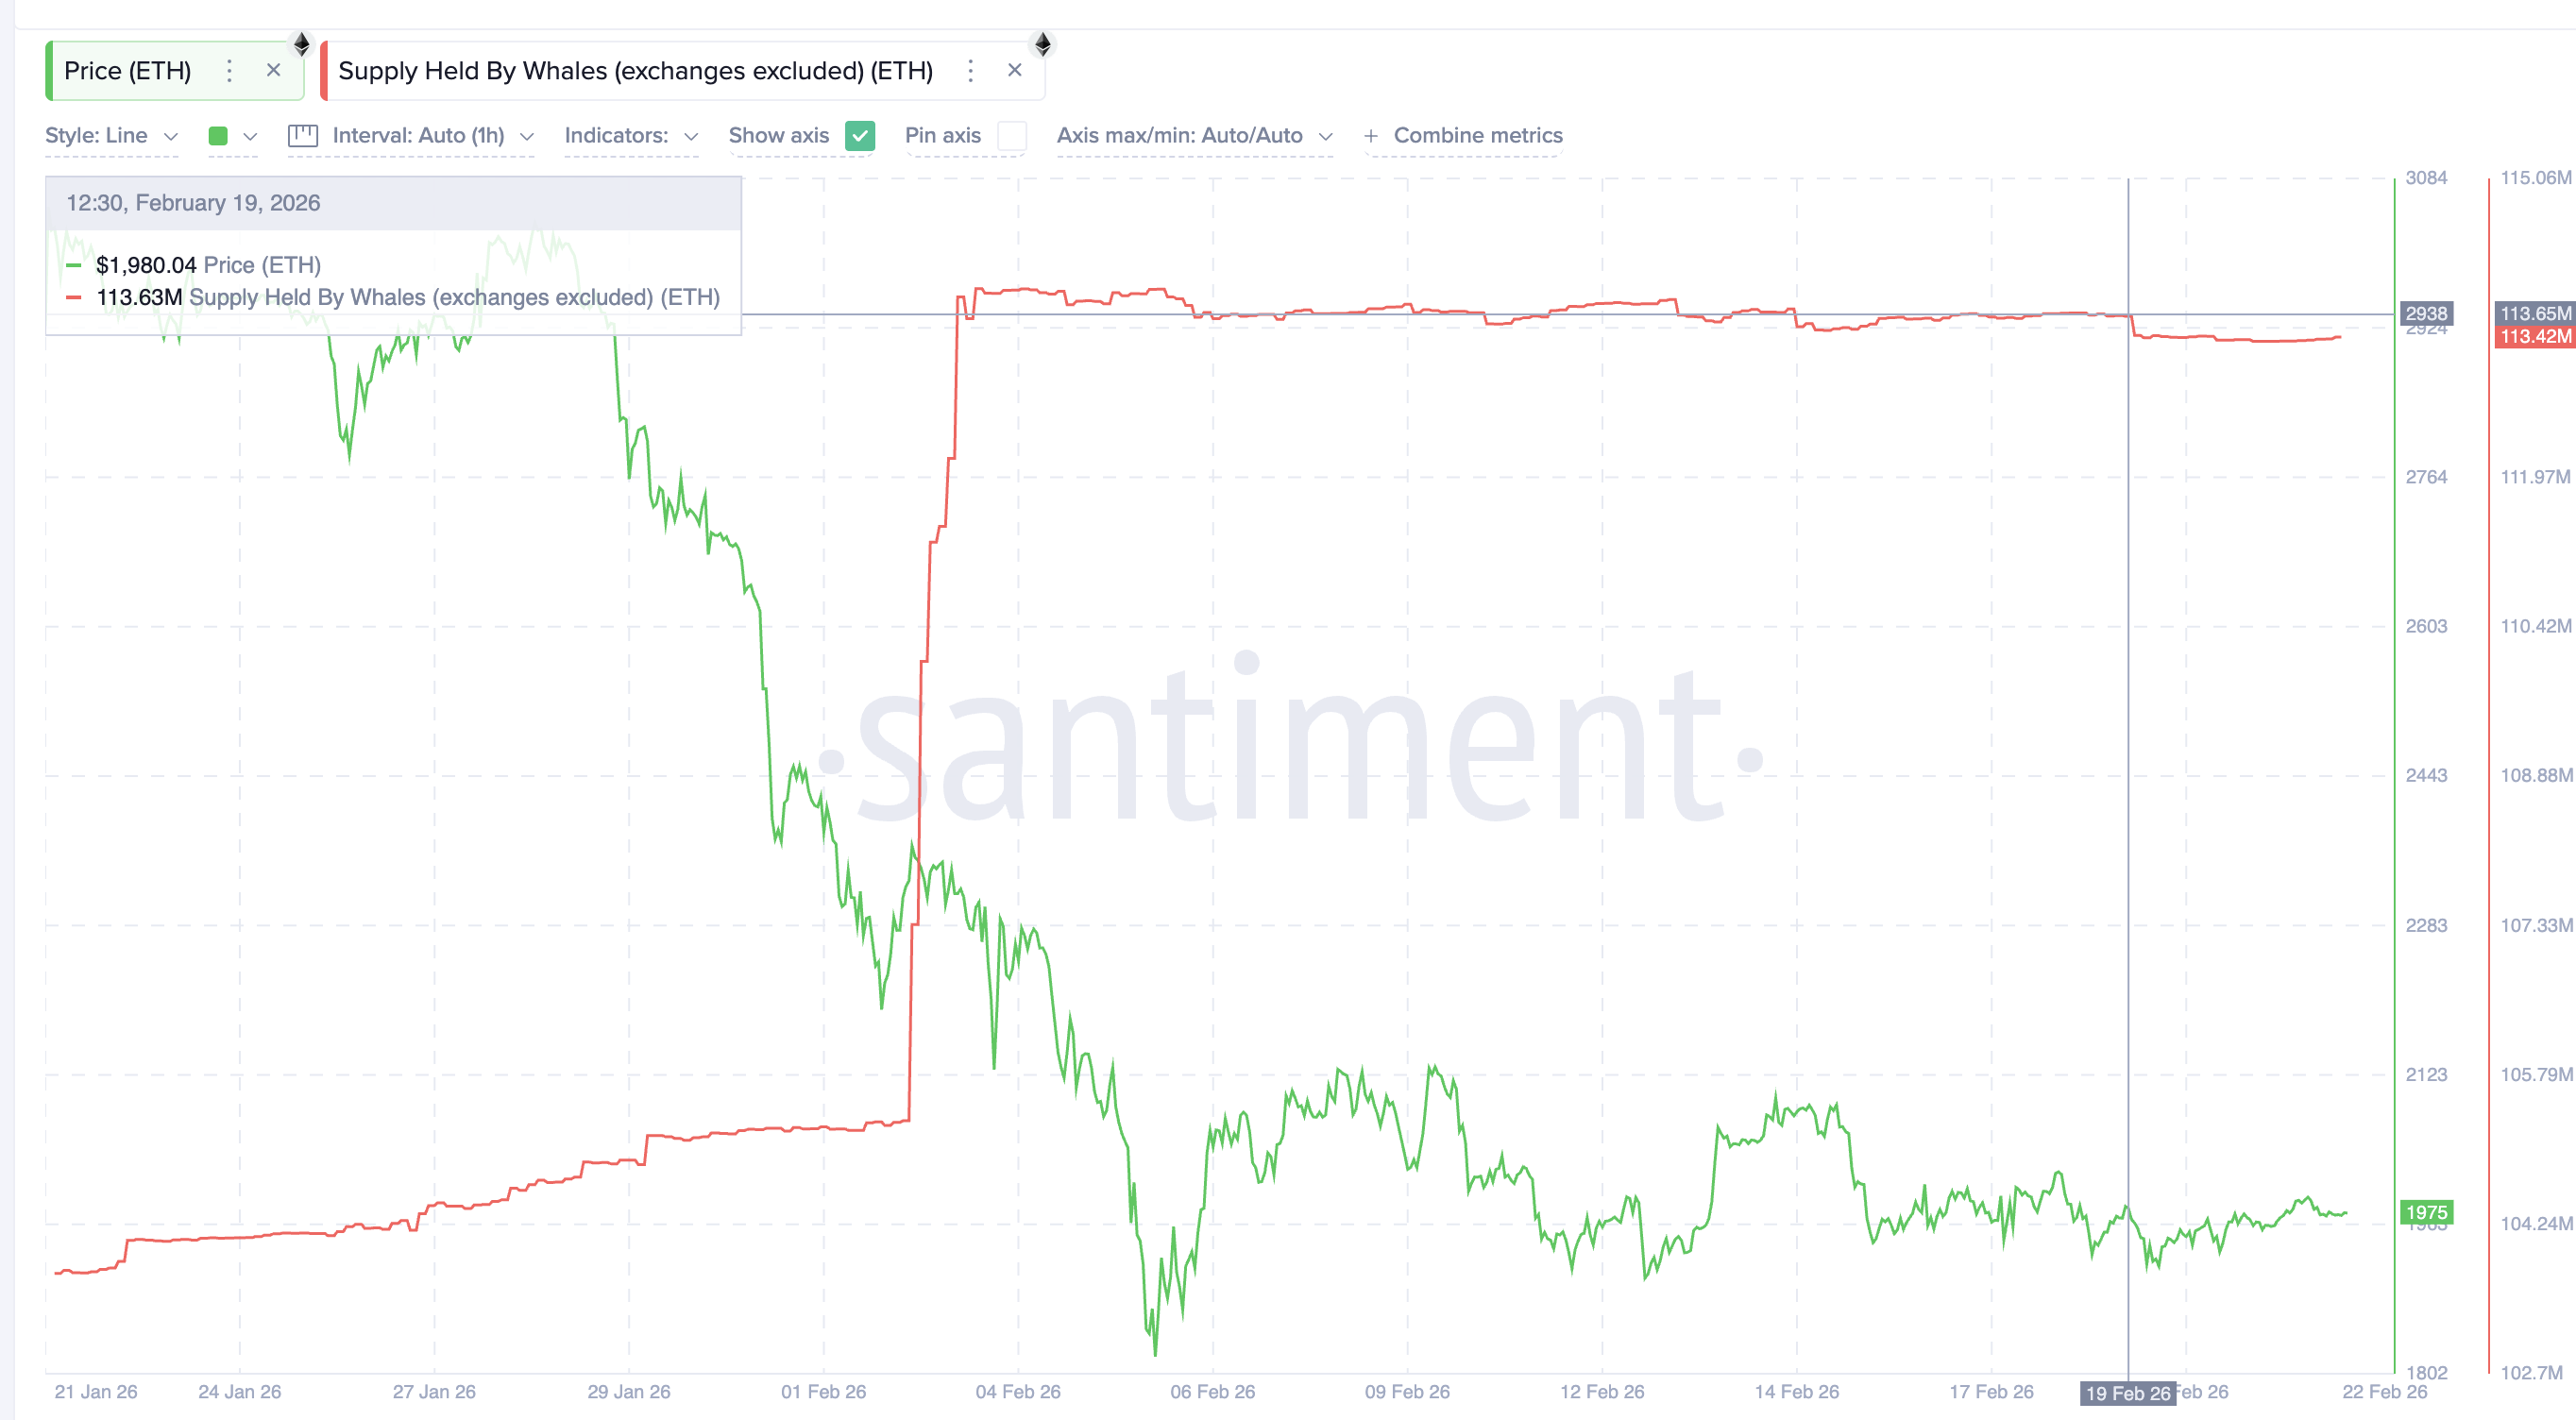
This suggests that instead of supporting the rebound, large holders are possibly using the existing or increased liquidity to reduce their positions. This combination of rising exchange balances and whale selling shows that liquidity is not just returning. It is already creating resistance.
Cost Basis Clusters Show Why the Ethereum Price Recovery Faces Immediate Resistance
On-chain cost basis data now explains where this resistance may appear. Cost basis represents the price levels at which investors previously bought their ETH. When prices return to these levels, many holders try to sell at breakeven, creating resistance unless a reason to hold emerges.
This data comes from the UTXO Realized Price Distribution, or URPD. Although Ethereum uses an account-based system, this metric has been adapted to estimate Ethereum’s supply distribution.
It shows that more than 2% of Ethereum’s supply is concentrated between $2,020 and $2,070. These levels also align closely with resistance levels on Ethereum’s price chart.
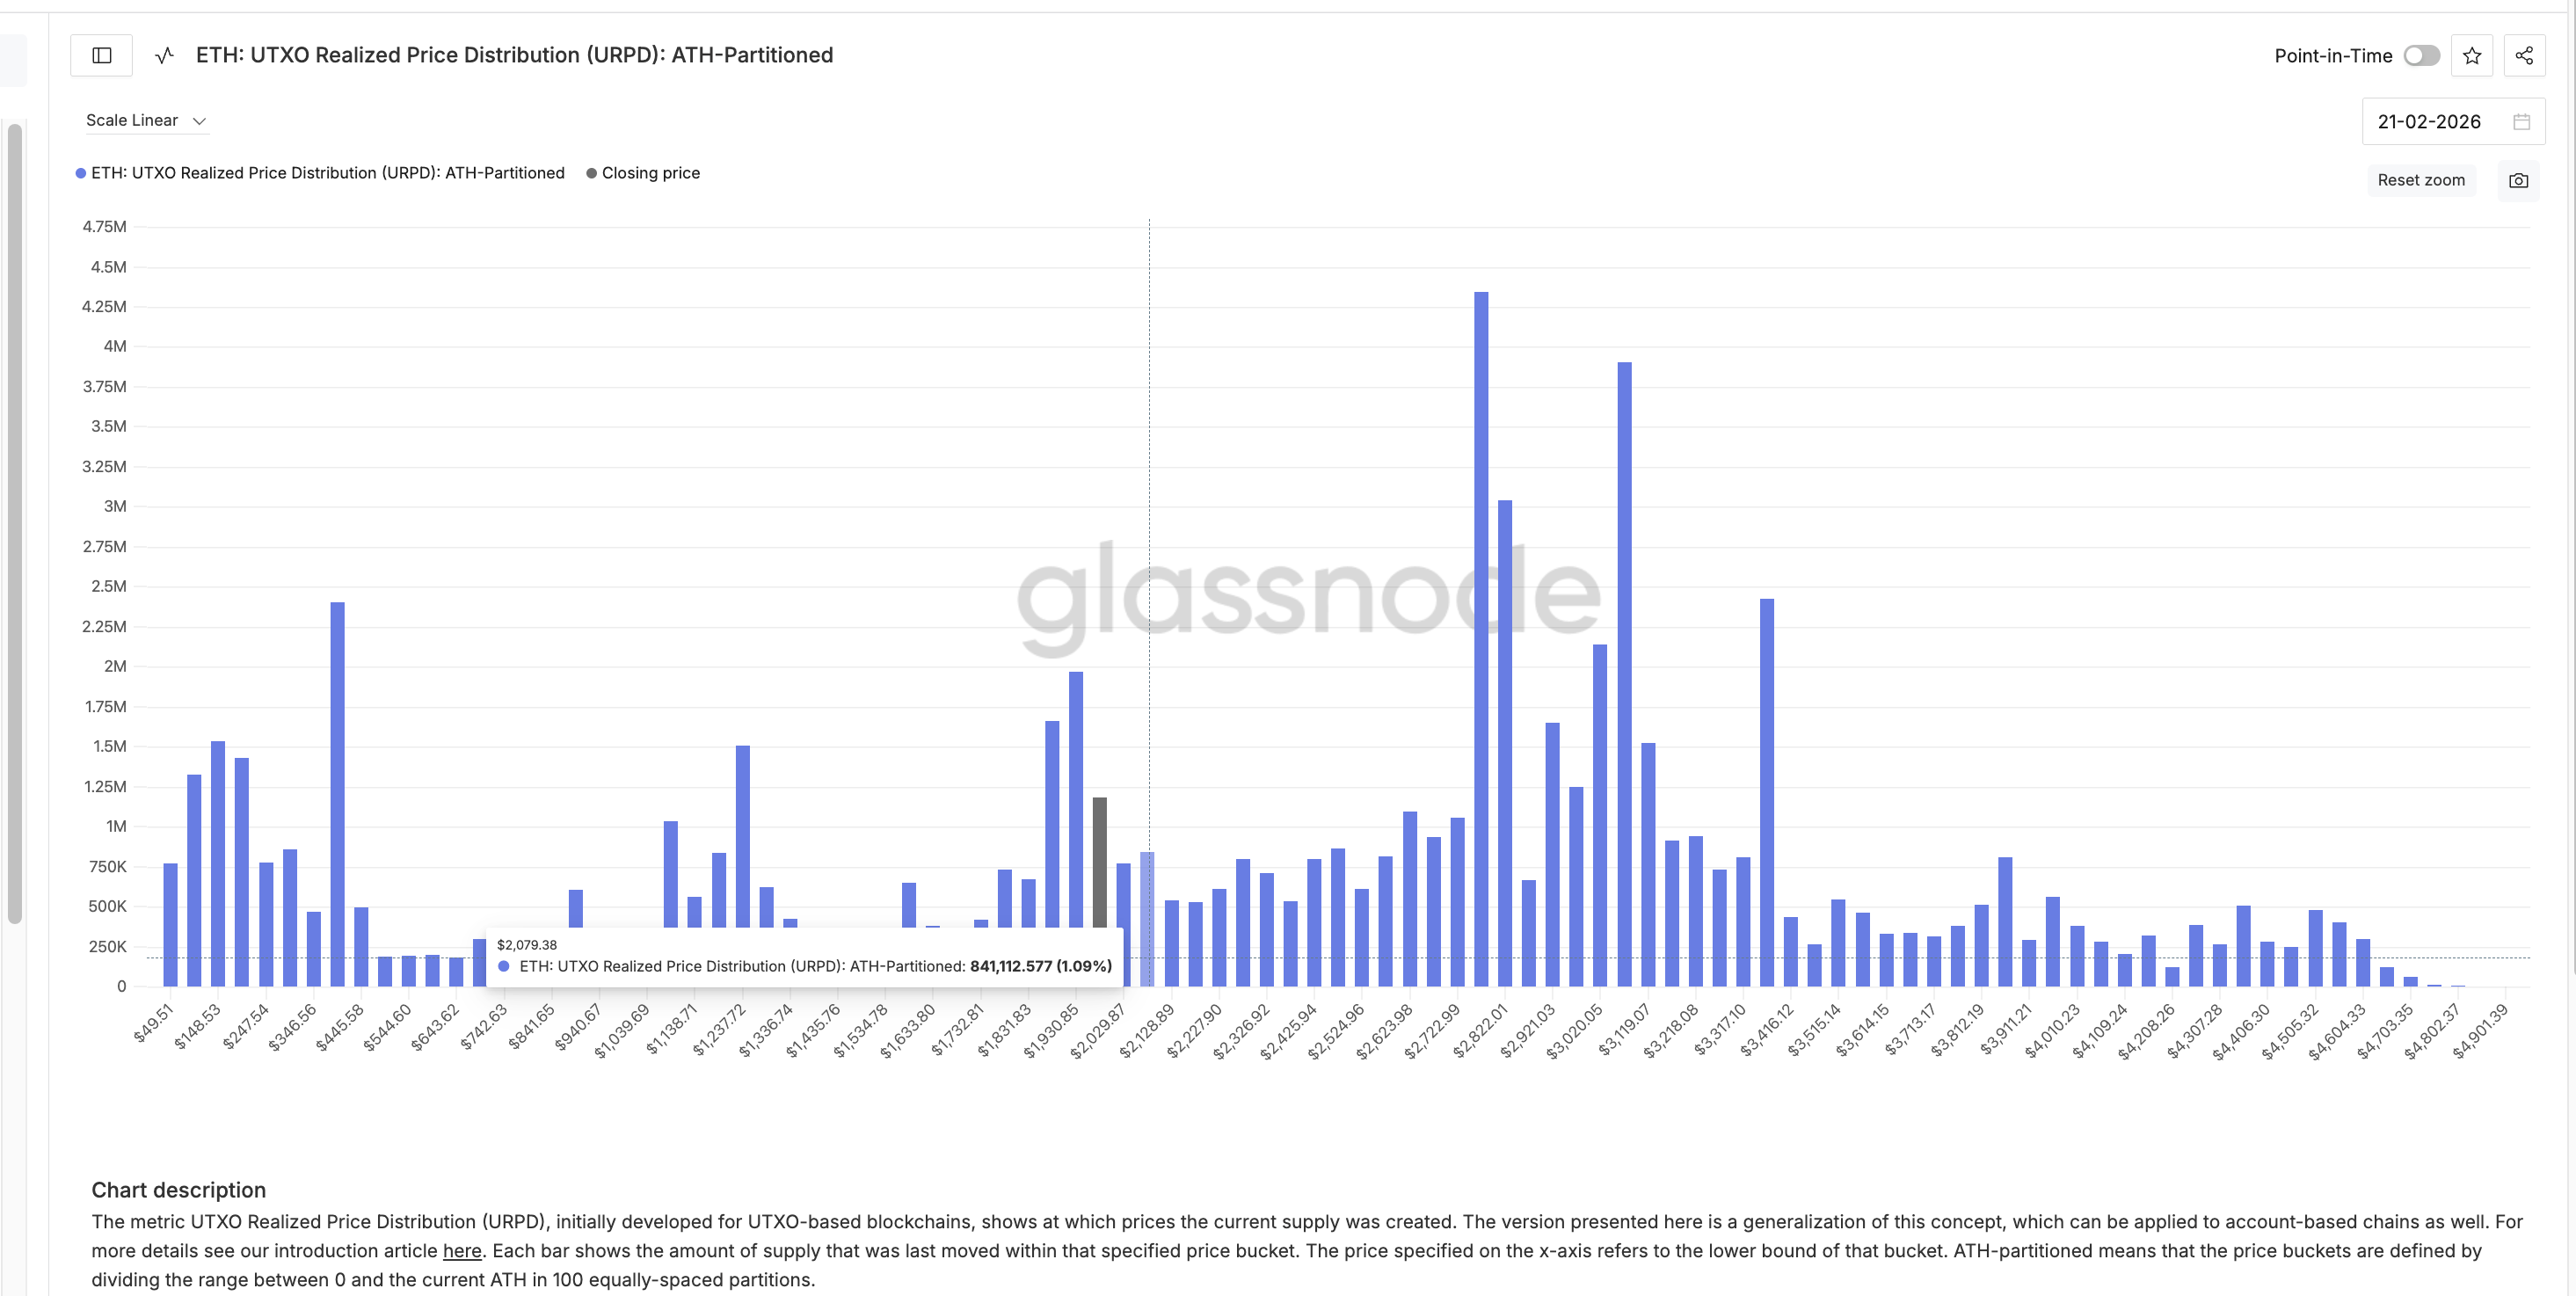
This creates a critical test. If Ethereum’s recovery continues, it must break above $2,050 first and then challenge the $2,140 level. A stronger move could extend toward $2,300.
But because supply is concentrated near $2,020 and $2,070, many holders may sell as ETH approaches these levels. This makes $2,050 the most crucial zone in the short term.
With staking demand falling and whales already selling, absorbing this supply (if it unlocks when the price hits a key level) becomes difficult without strong new demand.
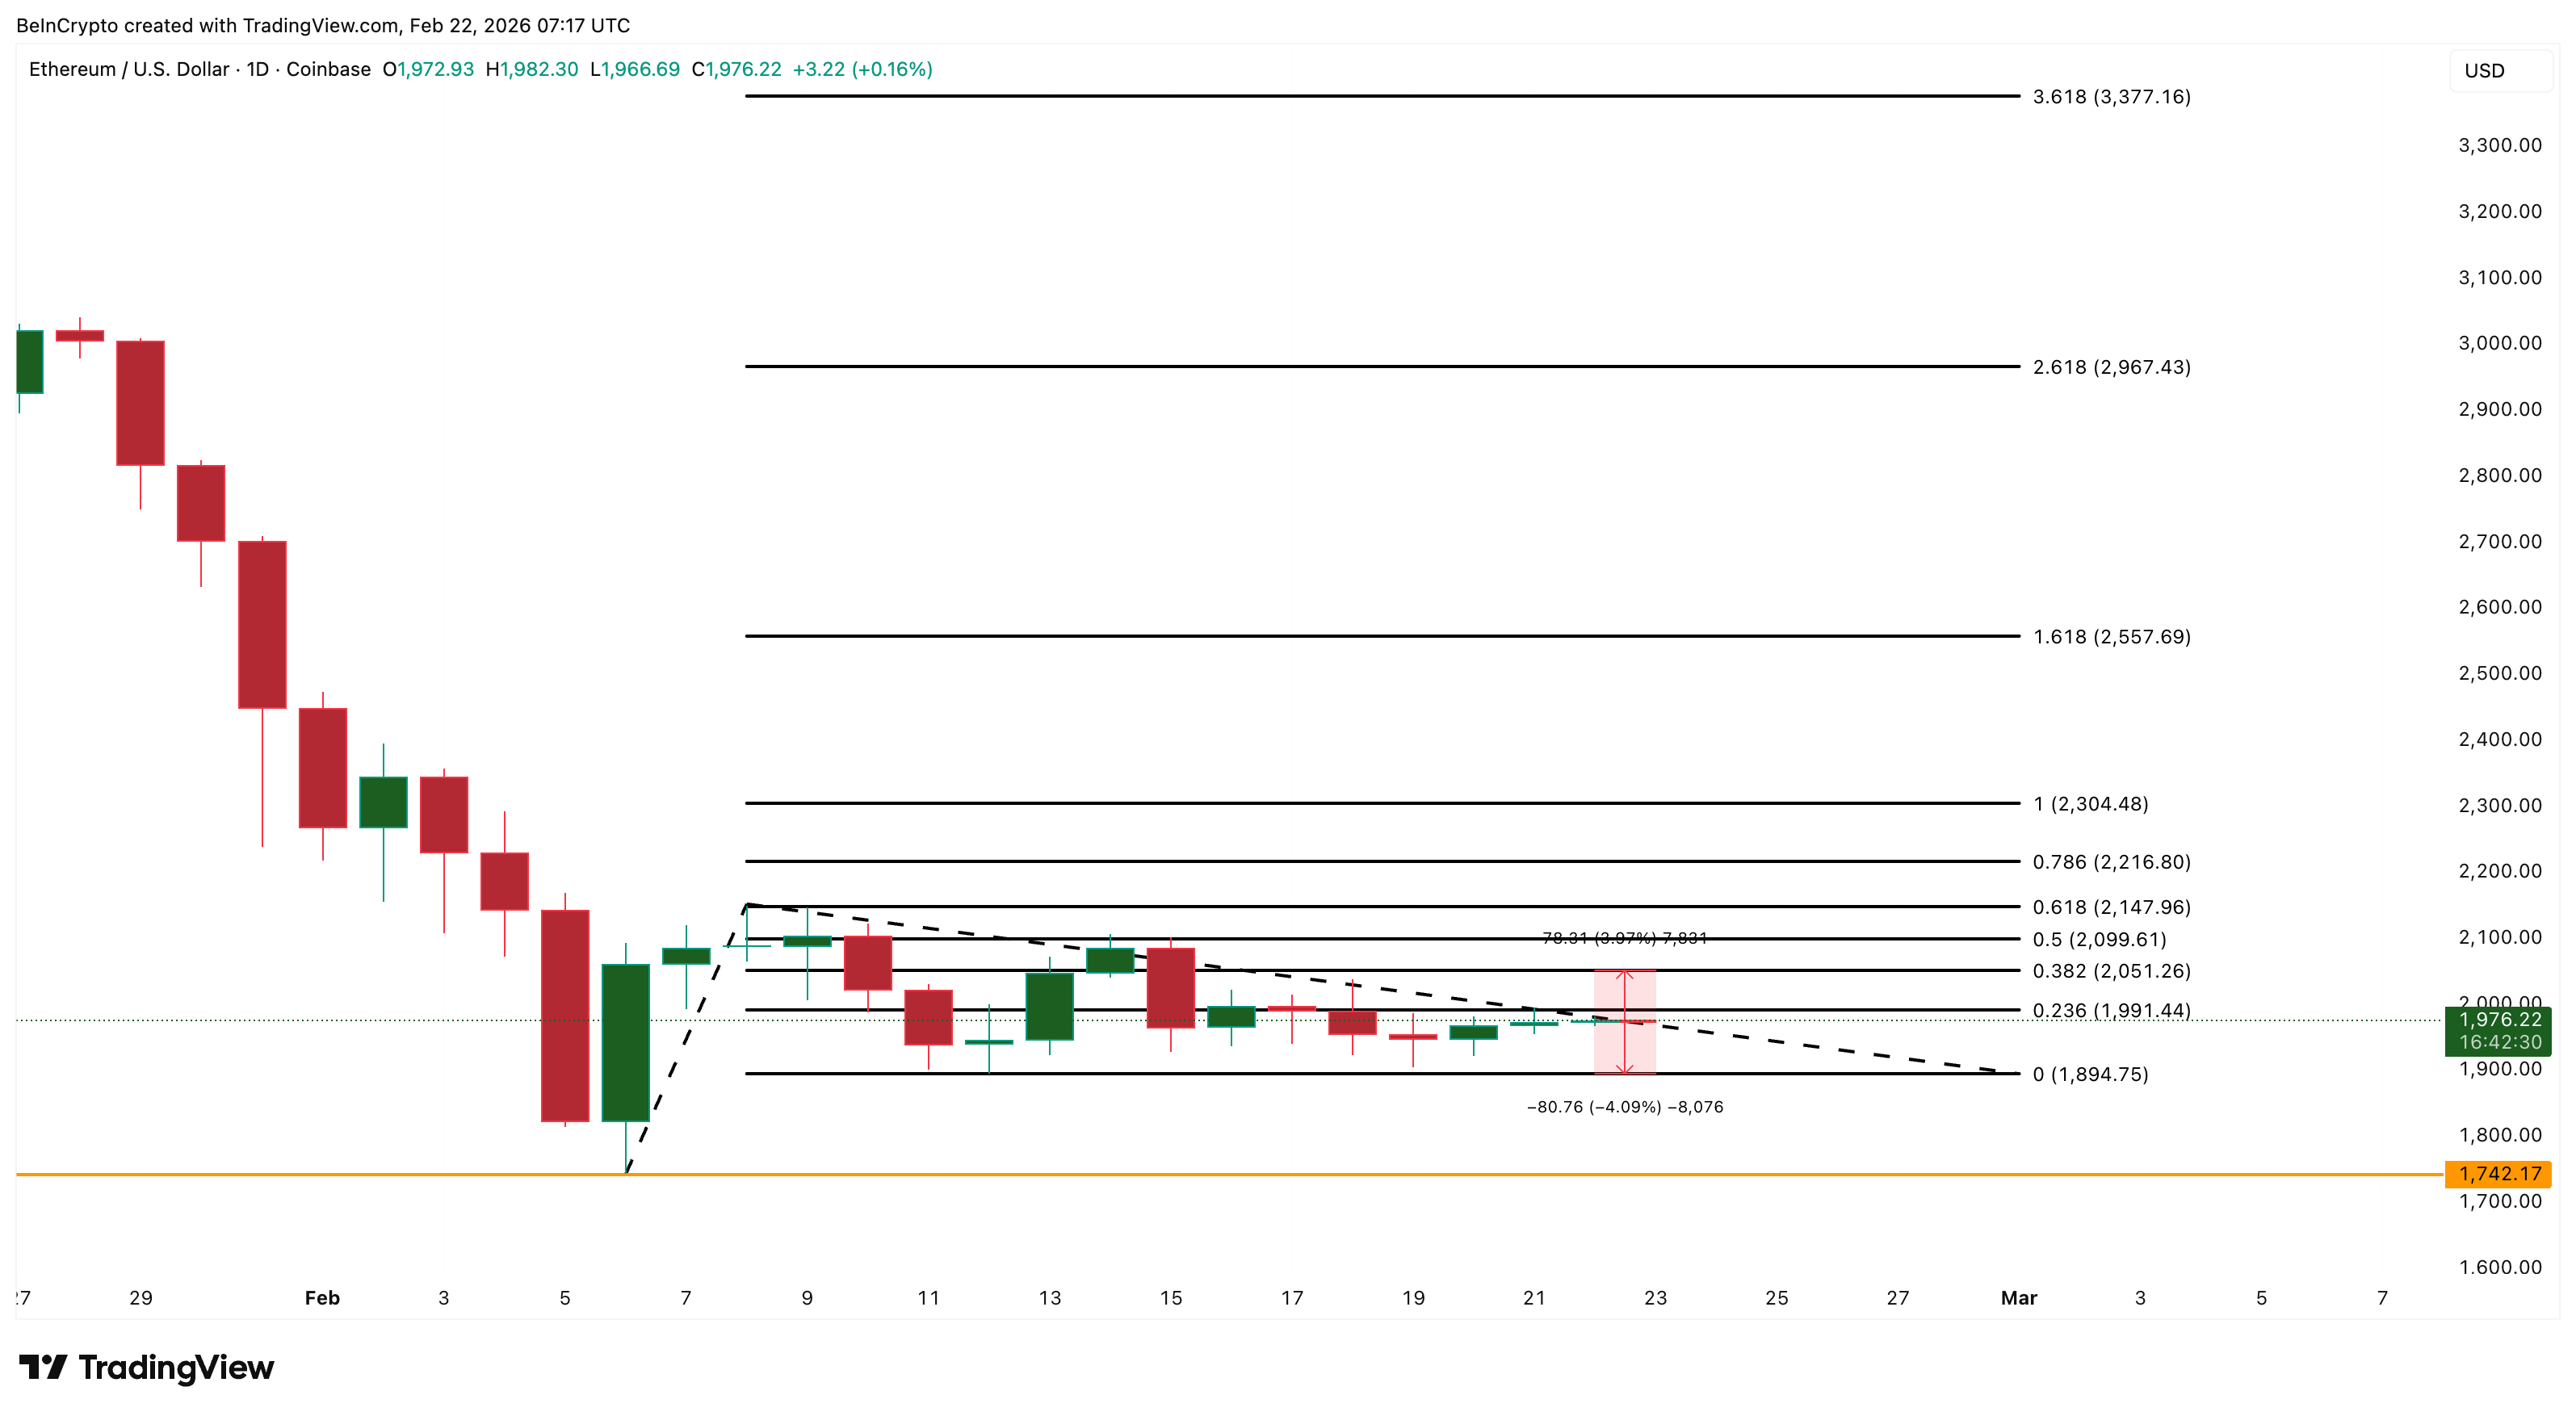
On the downside, the key support level sits at $1,890. This level sits about 4% below the current price. If this support fails, Ethereum could fall back toward its February low near $1,740.
This places Ethereum in a risky position. The bullish divergence has opened the door for recovery. But falling staking demand, rising exchange balances, whale selling, and strong cost-basis resistance suggest that returning liquidity may determine what happens next.
The post Ethereum Staking Demand Falls 50% – ETH Price in More Trouble? appeared first on BeInCrypto.
Read moreLatest News