
Bitcoin Flat at $89,000, but Charts Warn Buyers Are Losing Ground
Bitcoin price has barely moved over the past 24 hours. BTC is trading flat near $89,500, even as weekly losses still sit close to 6%. On the surface, this looks like calm consolidation. Underneath, charts suggest something else.
Multiple technical and on-chain signals now point to a standoff. Buyers are trying to delay a larger breakdown, not push a fresh rally. The risk is building quietly, and a lesser-known adversary is starting to matter.
Doji-Like Candles and EMA Loss Show BTC Buyers Defending, Not Advancing
Over the past three daily sessions, Bitcoin has printed doji-like candles with thin bodies and long wicks. These candles reflect hesitation, not balance. Sellers are pressing lower, buyers are stepping in late, and neither side is gaining control.
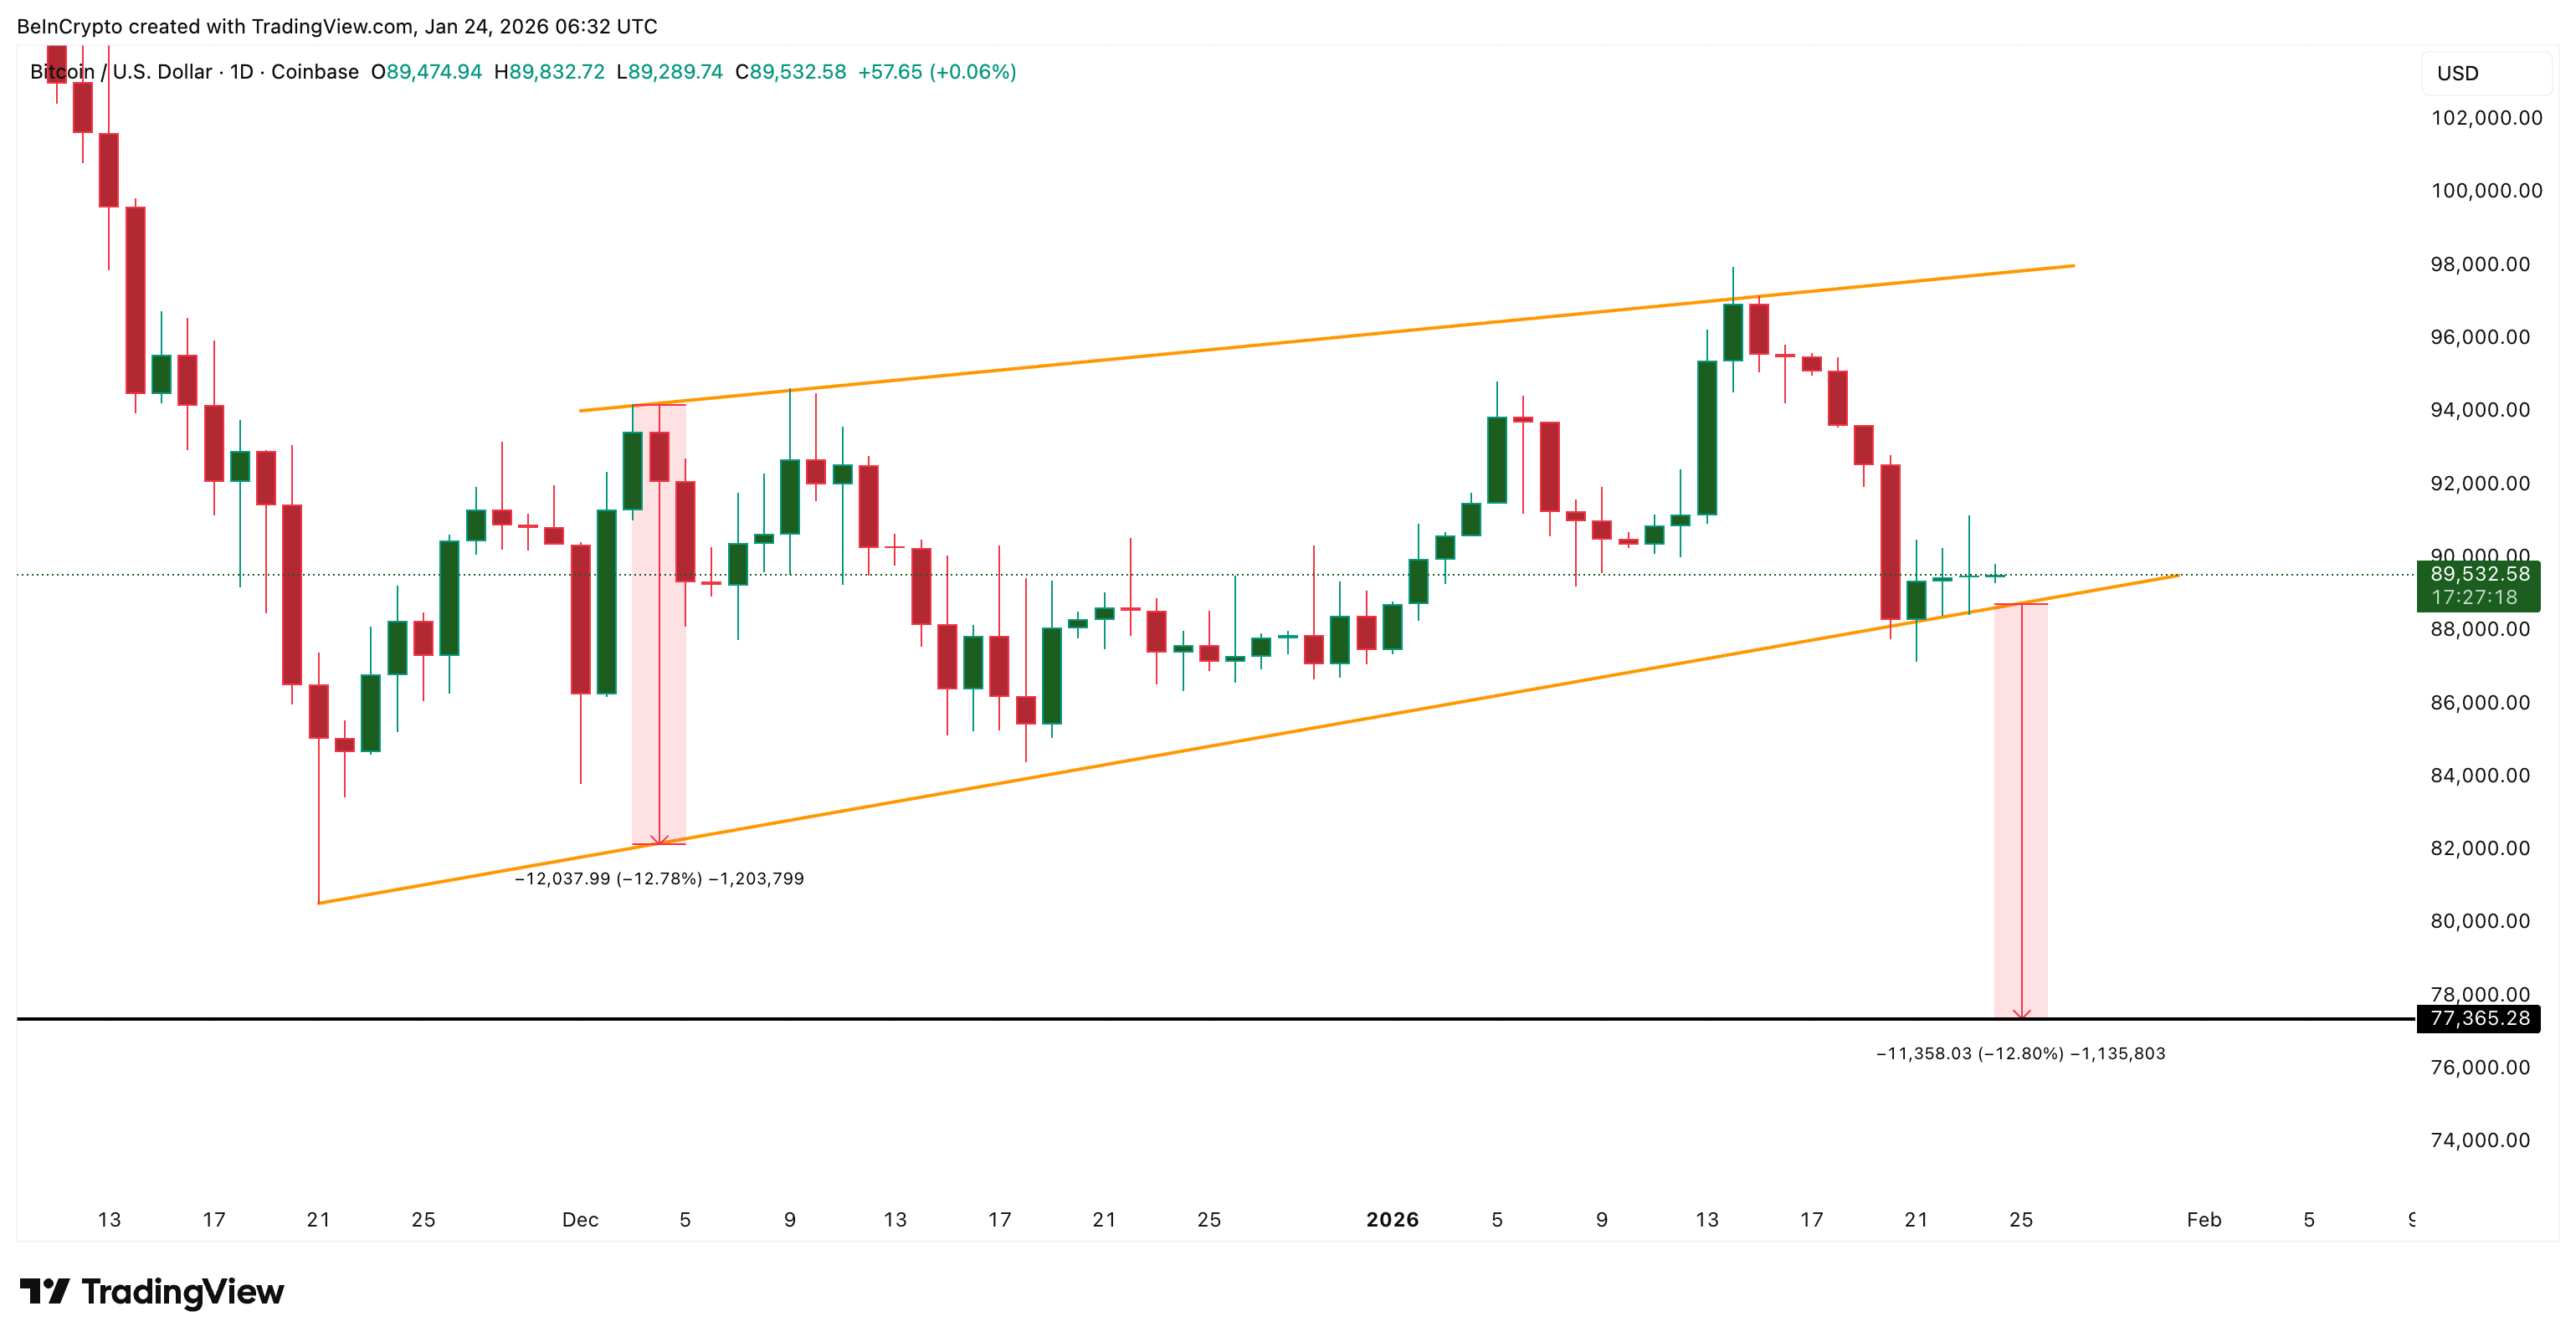
This behavior is appearing right at the lower boundary of a rising wedge. An increasing wedge slopes upward but tightens price action, often breaking down when support gives way.
If this structure fails, the measured downside projection points toward $77,300, a potential 13% drop from current levels.
Want more token insights like this? Sign up for Editor Harsh Notariya’s Daily Crypto Newsletter here.
The technical risk deepens when moving averages are added. Bitcoin lost its 20-day exponential moving average (EMA) on January 20. An EMA is a trend indicator that gives more weight to recent prices, making it sensitive to short-term shifts.
The last time Bitcoin clearly broke below the 20-day EMA, on December 12, the price corrected by roughly 8%. This time, BTC has already slipped about 5% from the breakdown before stabilizing. The doji-like candles suggest buyers are slowing the fall, not reversing it.
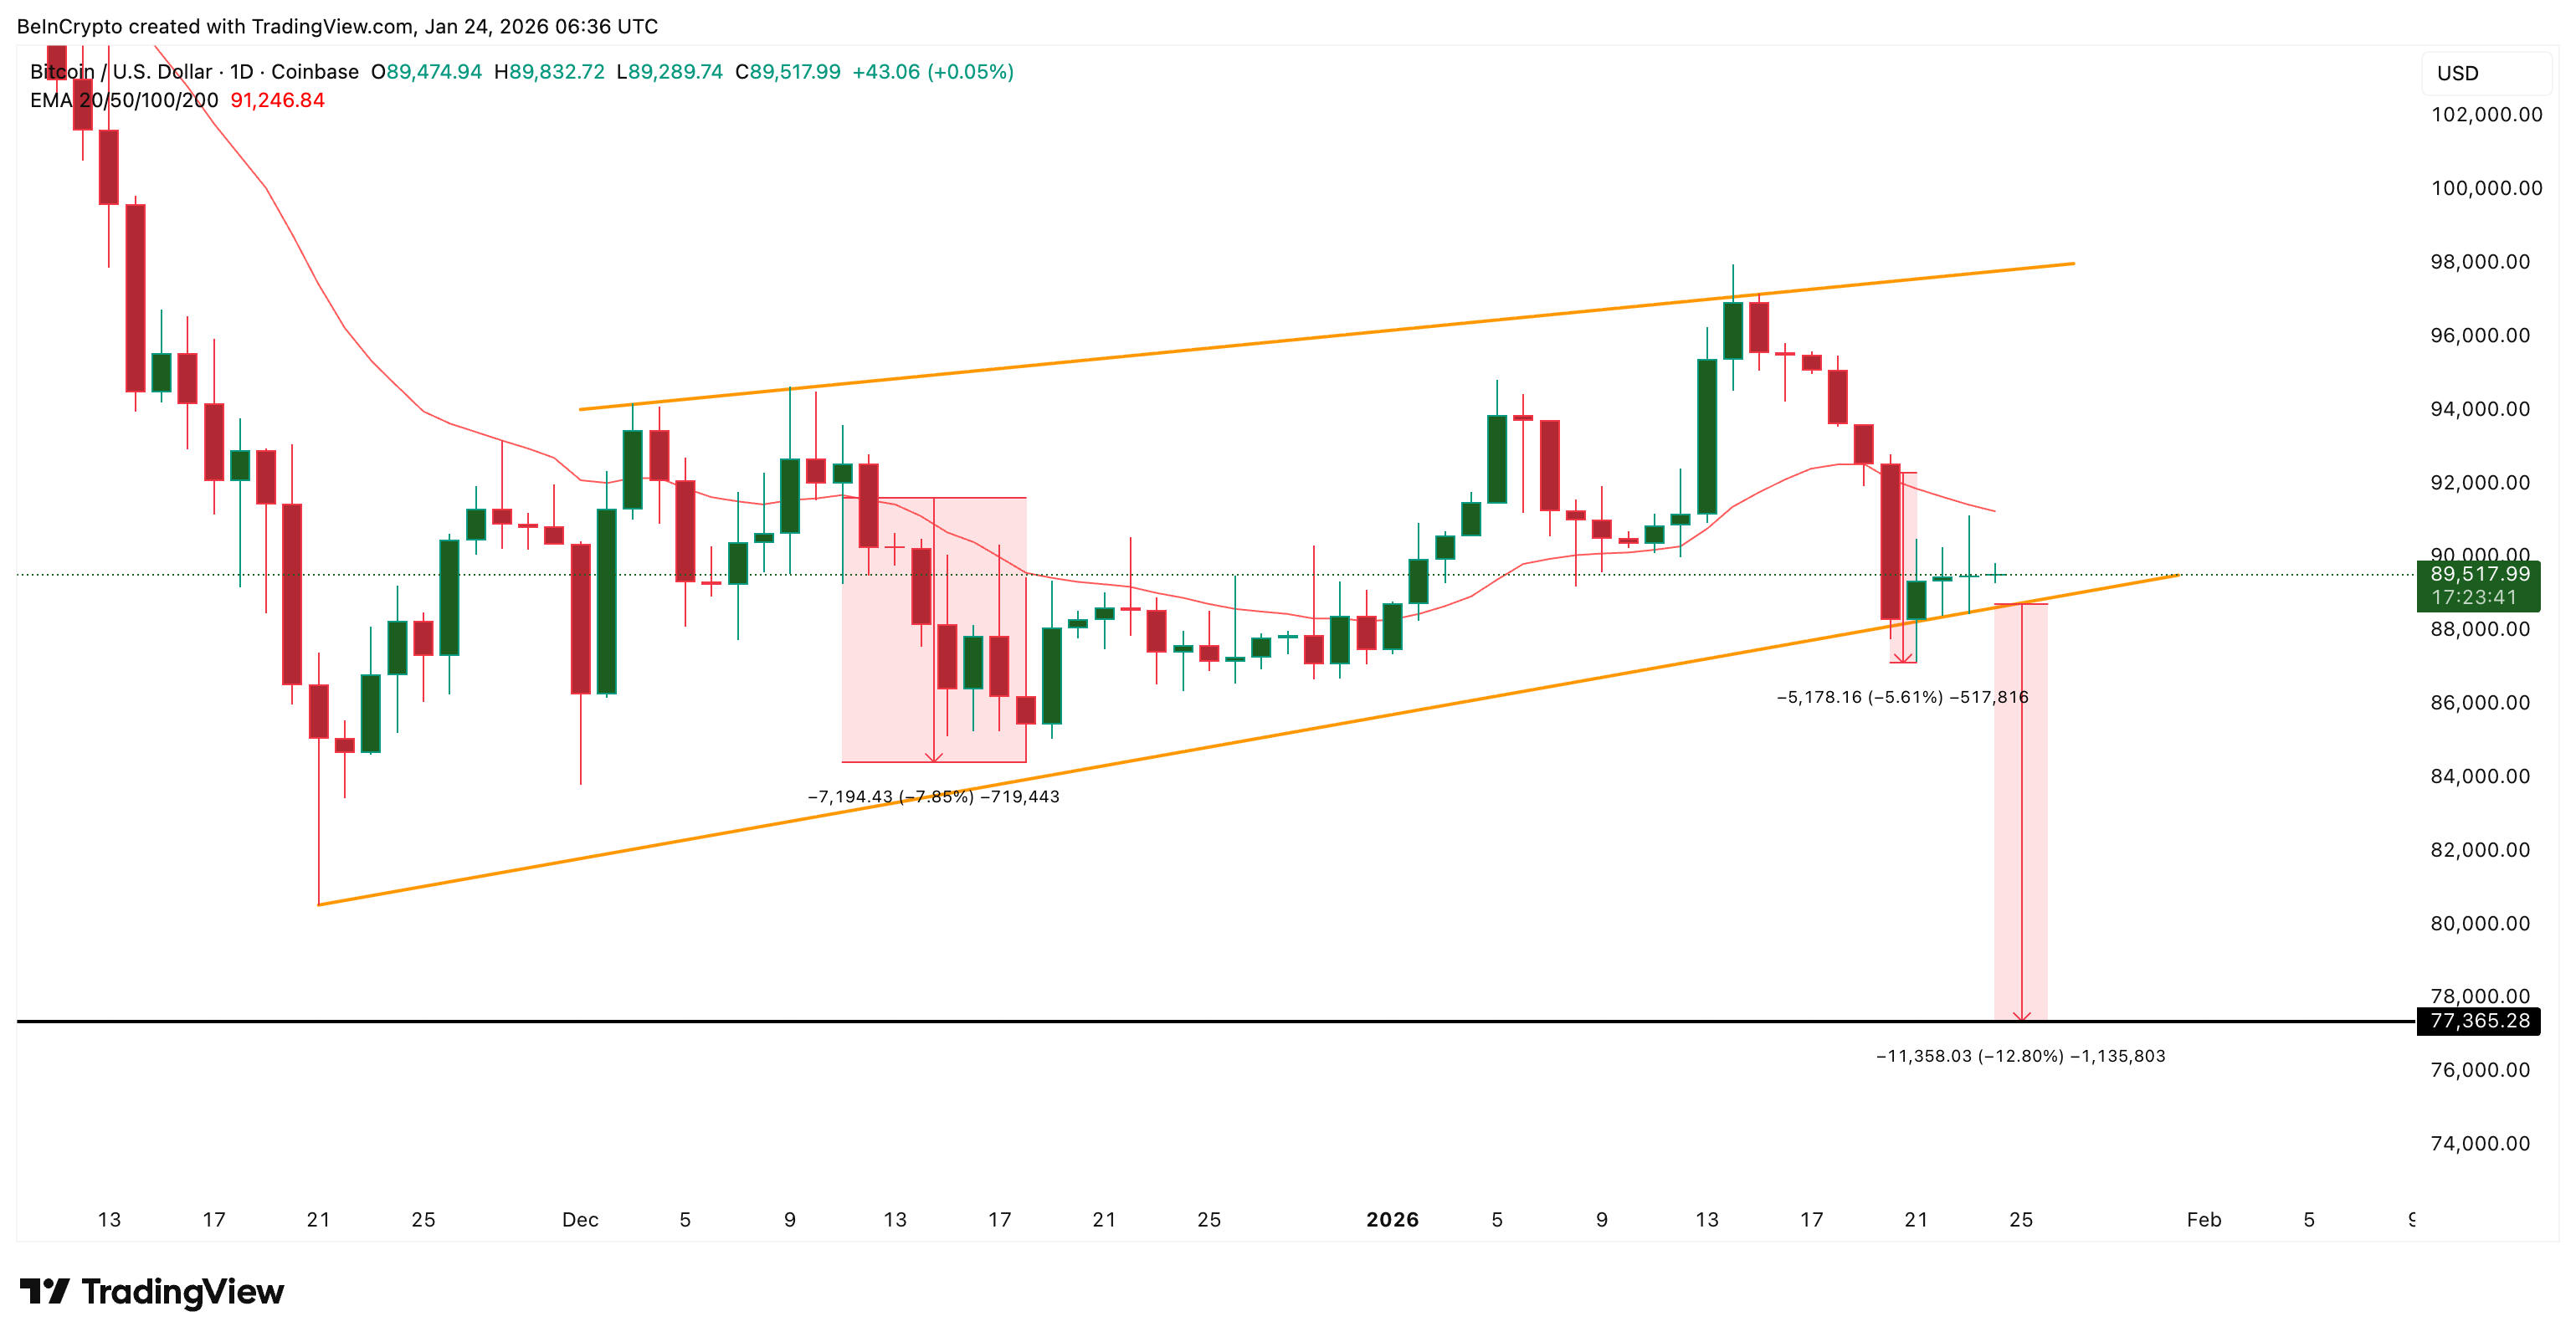
In short, this is not indecision between bulls and bears. It is buyers attempting to delay a larger move lower.
So who is still buying, and why is that support weakening?
Long-Term Holders Are Still Buying, but the Pace Is Slowing
On-chain data shows that long-term holders, wallets holding Bitcoin for 155 days or more, are still net buyers. This cohort is tracked using the Holder Net Position Change metric, which measures how many coins long-term investors add or remove over time.
Over the past two weeks, this metric has remained positive. That buying helps explain why Bitcoin has not broken down yet.
But the strength is fading.
On January 19, long-term holders added roughly 22,618 BTC. By January 23, that daily net buying had dropped to about 17,109 BTC. That is a roughly 24% decline in buying intensity in just four days.
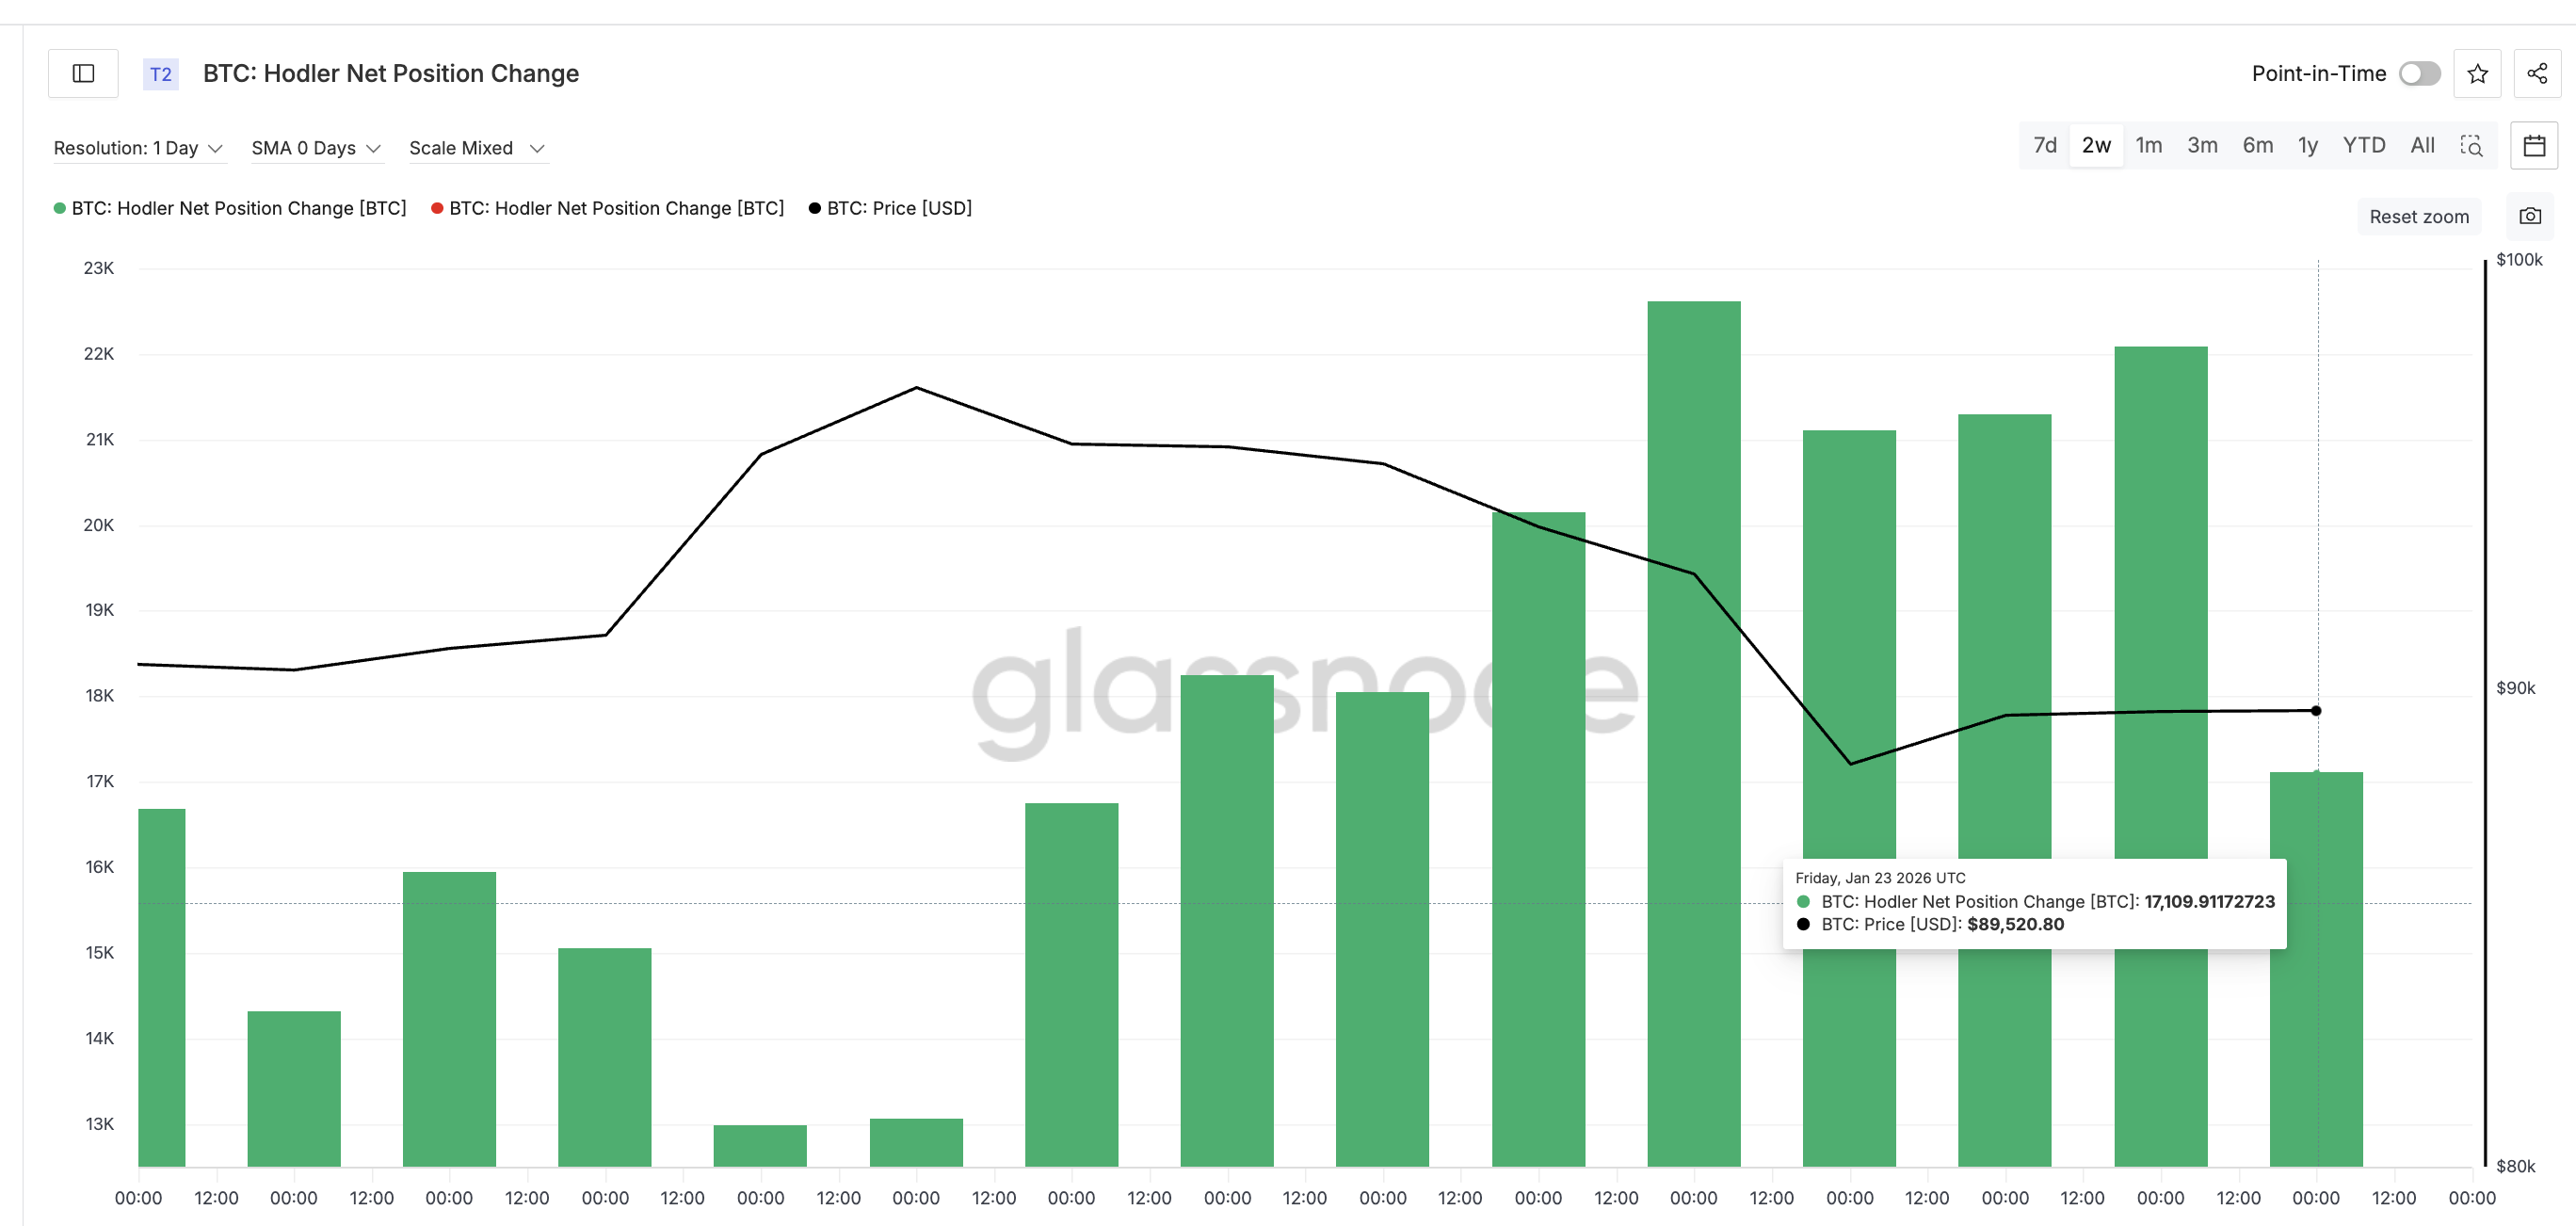
So while holders are still supporting the price, they are doing so with less force. That lines up with the doji-like candles seen on the chart. Support exists, but it is thinning.
This slowdown would not be dangerous on its own. The problem is that a new source of pressure is rising at the same time.
Miners Emerge as the Lesser-Known Adversary Behind Rising Risk
The most underappreciated shift right now is coming from Bitcoin miners.
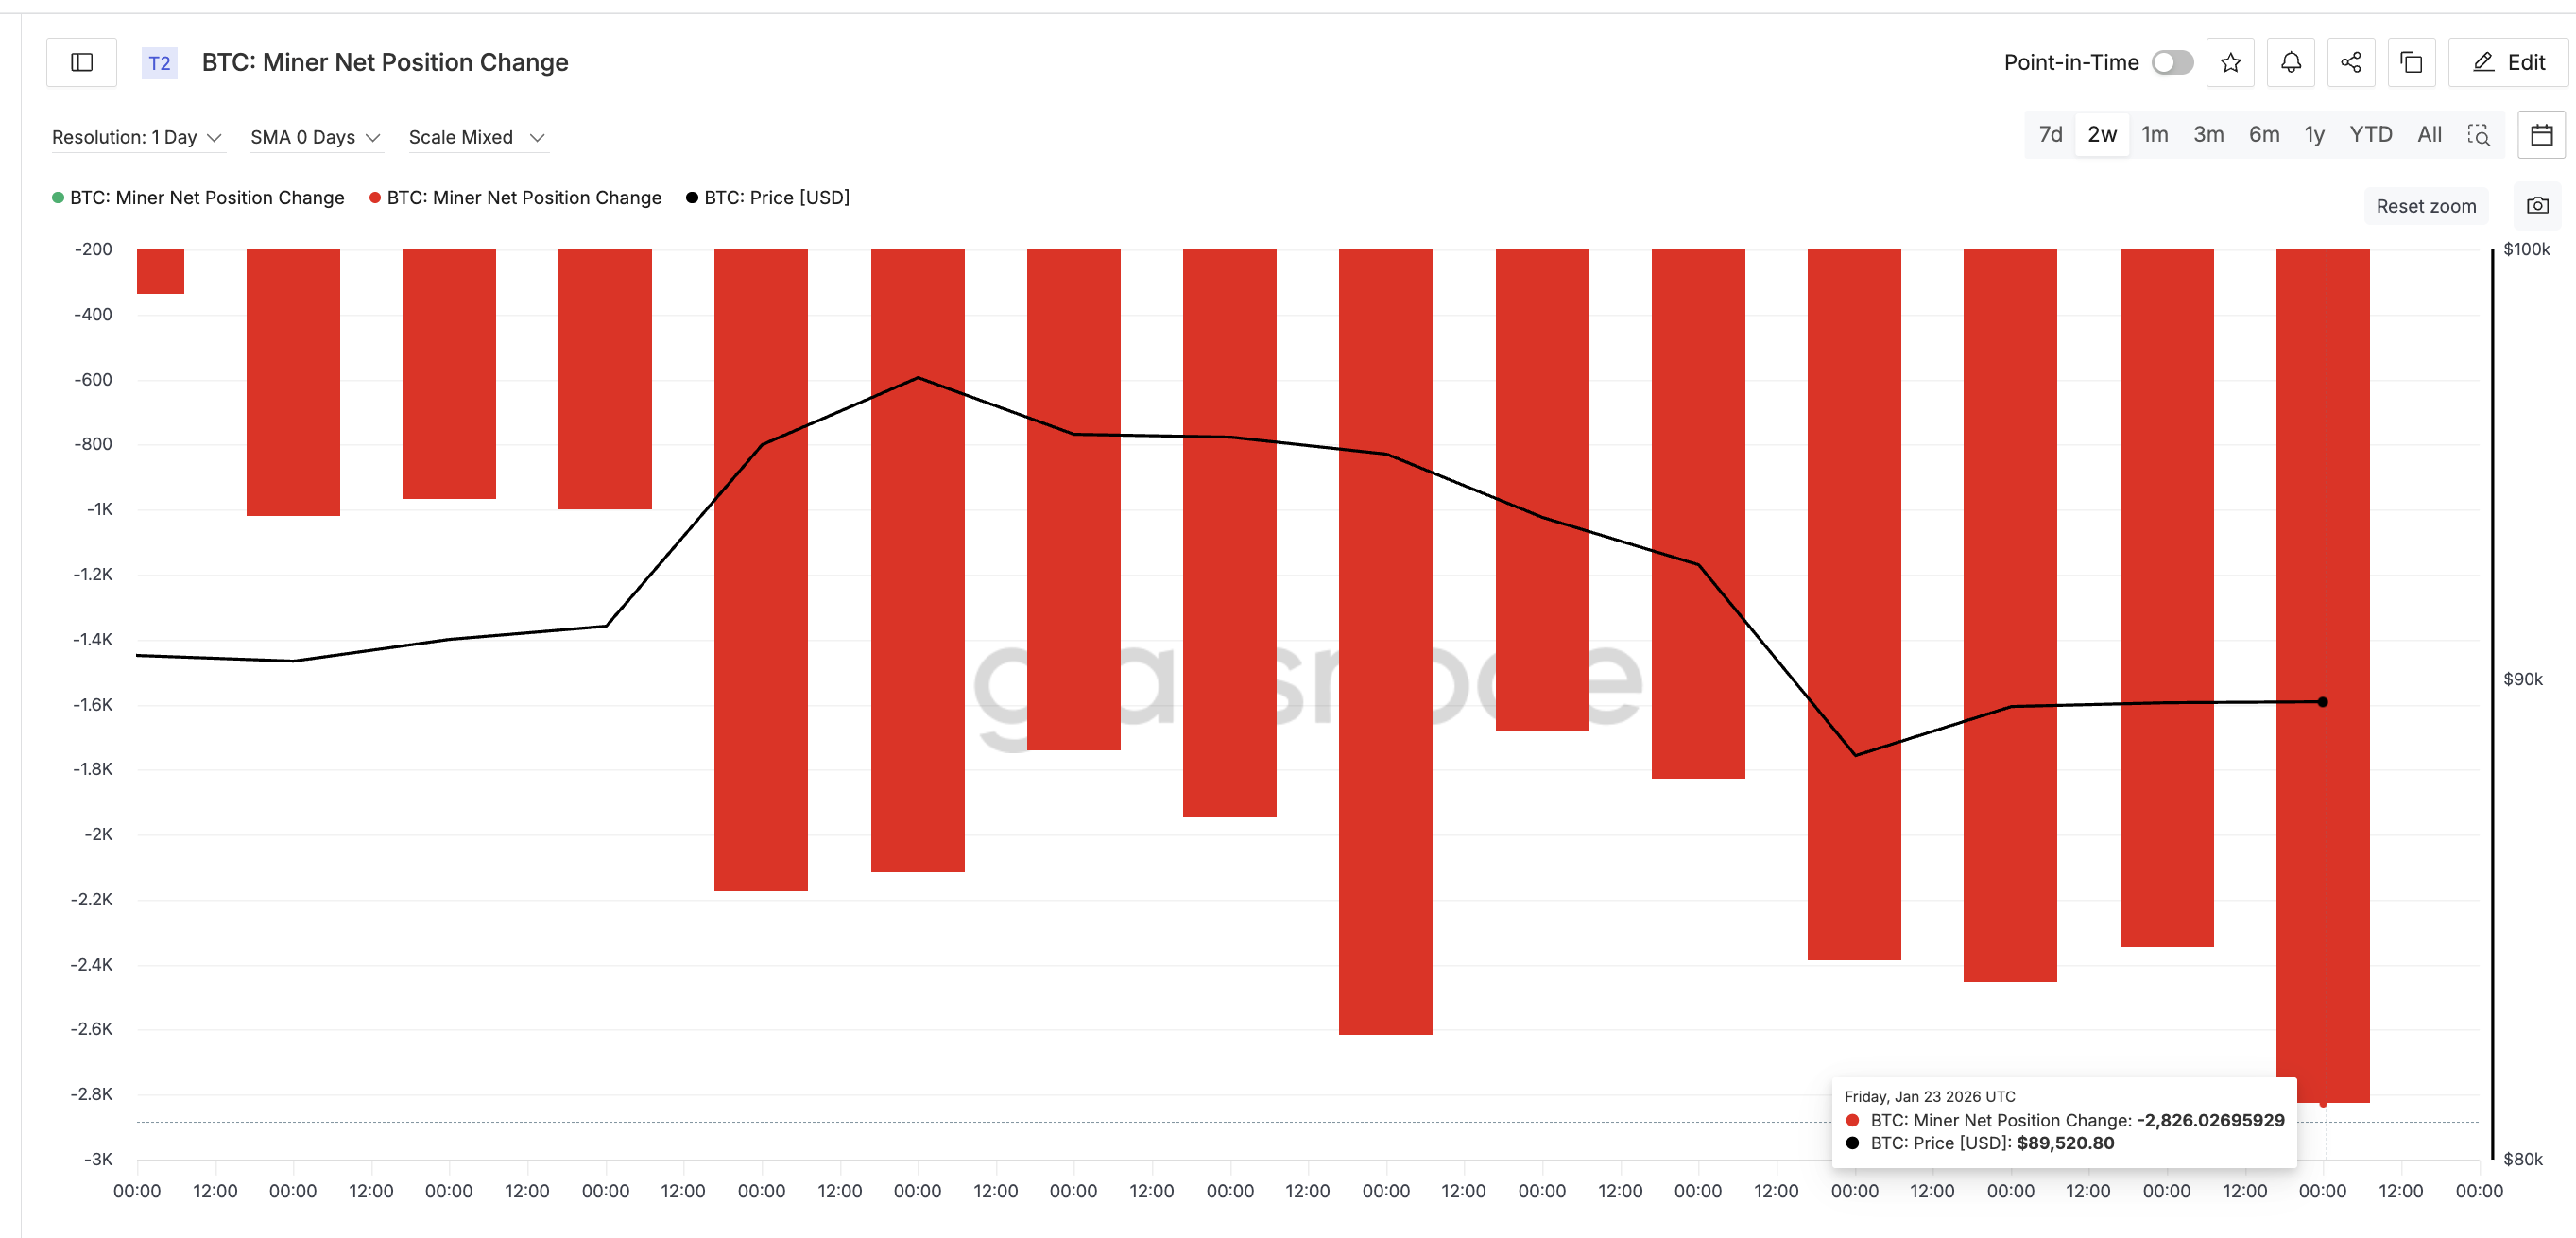
Miner Net Position Change tracks the 30-day change in supply held by miner wallets. When the value turns more negative, it means miners are selling more Bitcoin over time.
On January 9, miners were reducing holdings by roughly 335 BTC. By January 23, that figure had surged to about 2,826 BTC. That is more than an eightfold increase in selling pressure within two weeks.
The reason becomes clearer when network fees are considered.
Bitcoin’s monthly network fees have collapsed sharply, according to BeInCrypto analysts. In May 2025, miners earned roughly 194 BTC in monthly fees. By January 2026, that figure had steadily dropped to about 59 BTC. That is a roughly 70% decline in fee income.
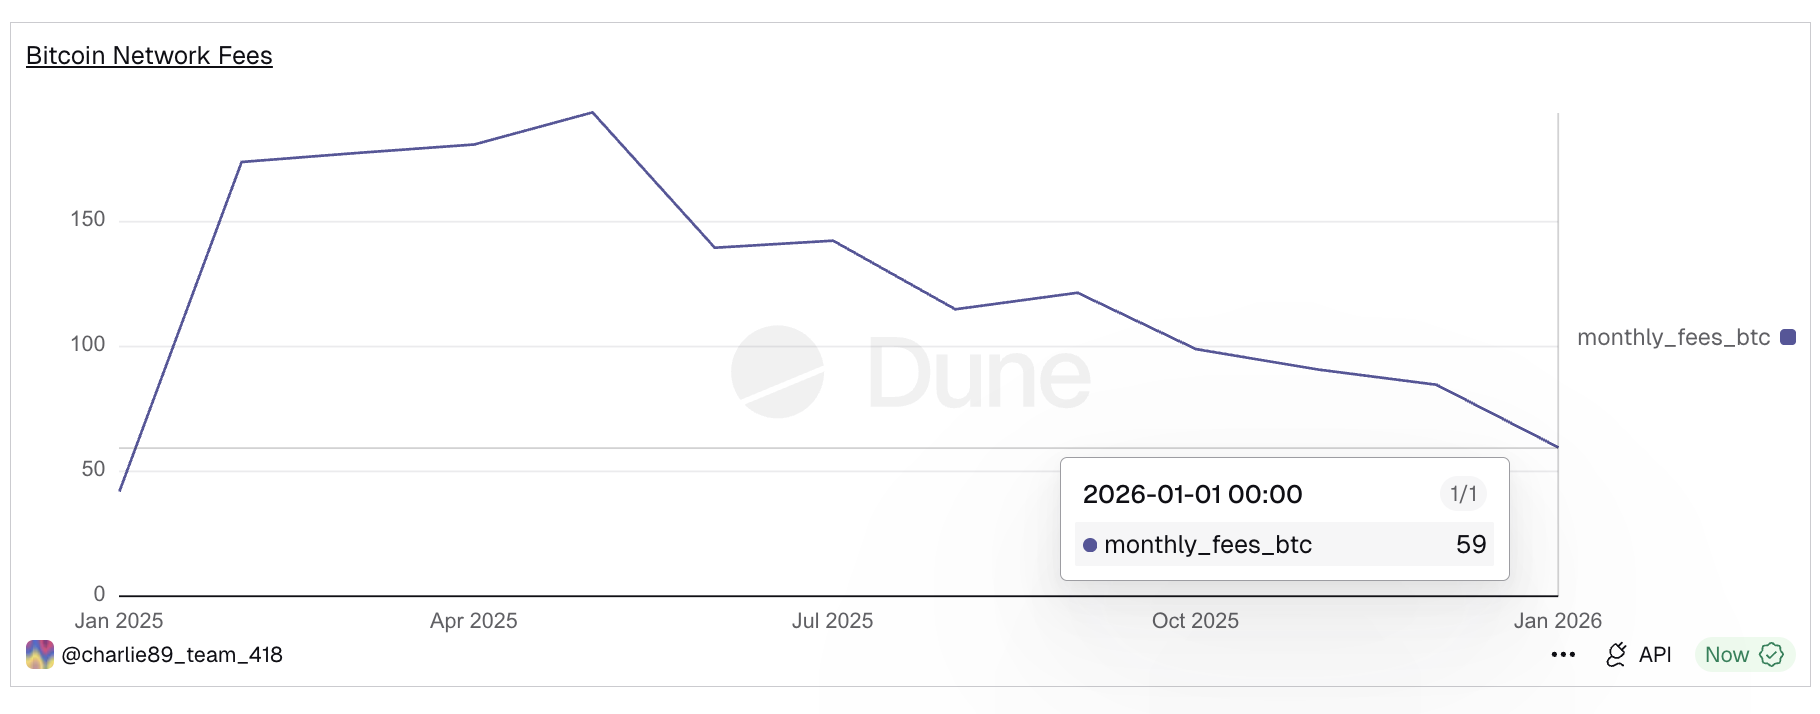
Lower fees squeeze miner margins. When revenue falls, miners are more likely to sell Bitcoin to cover operating costs, which seems to be happening. But their selling strength doesn’t seem too strong, yet.
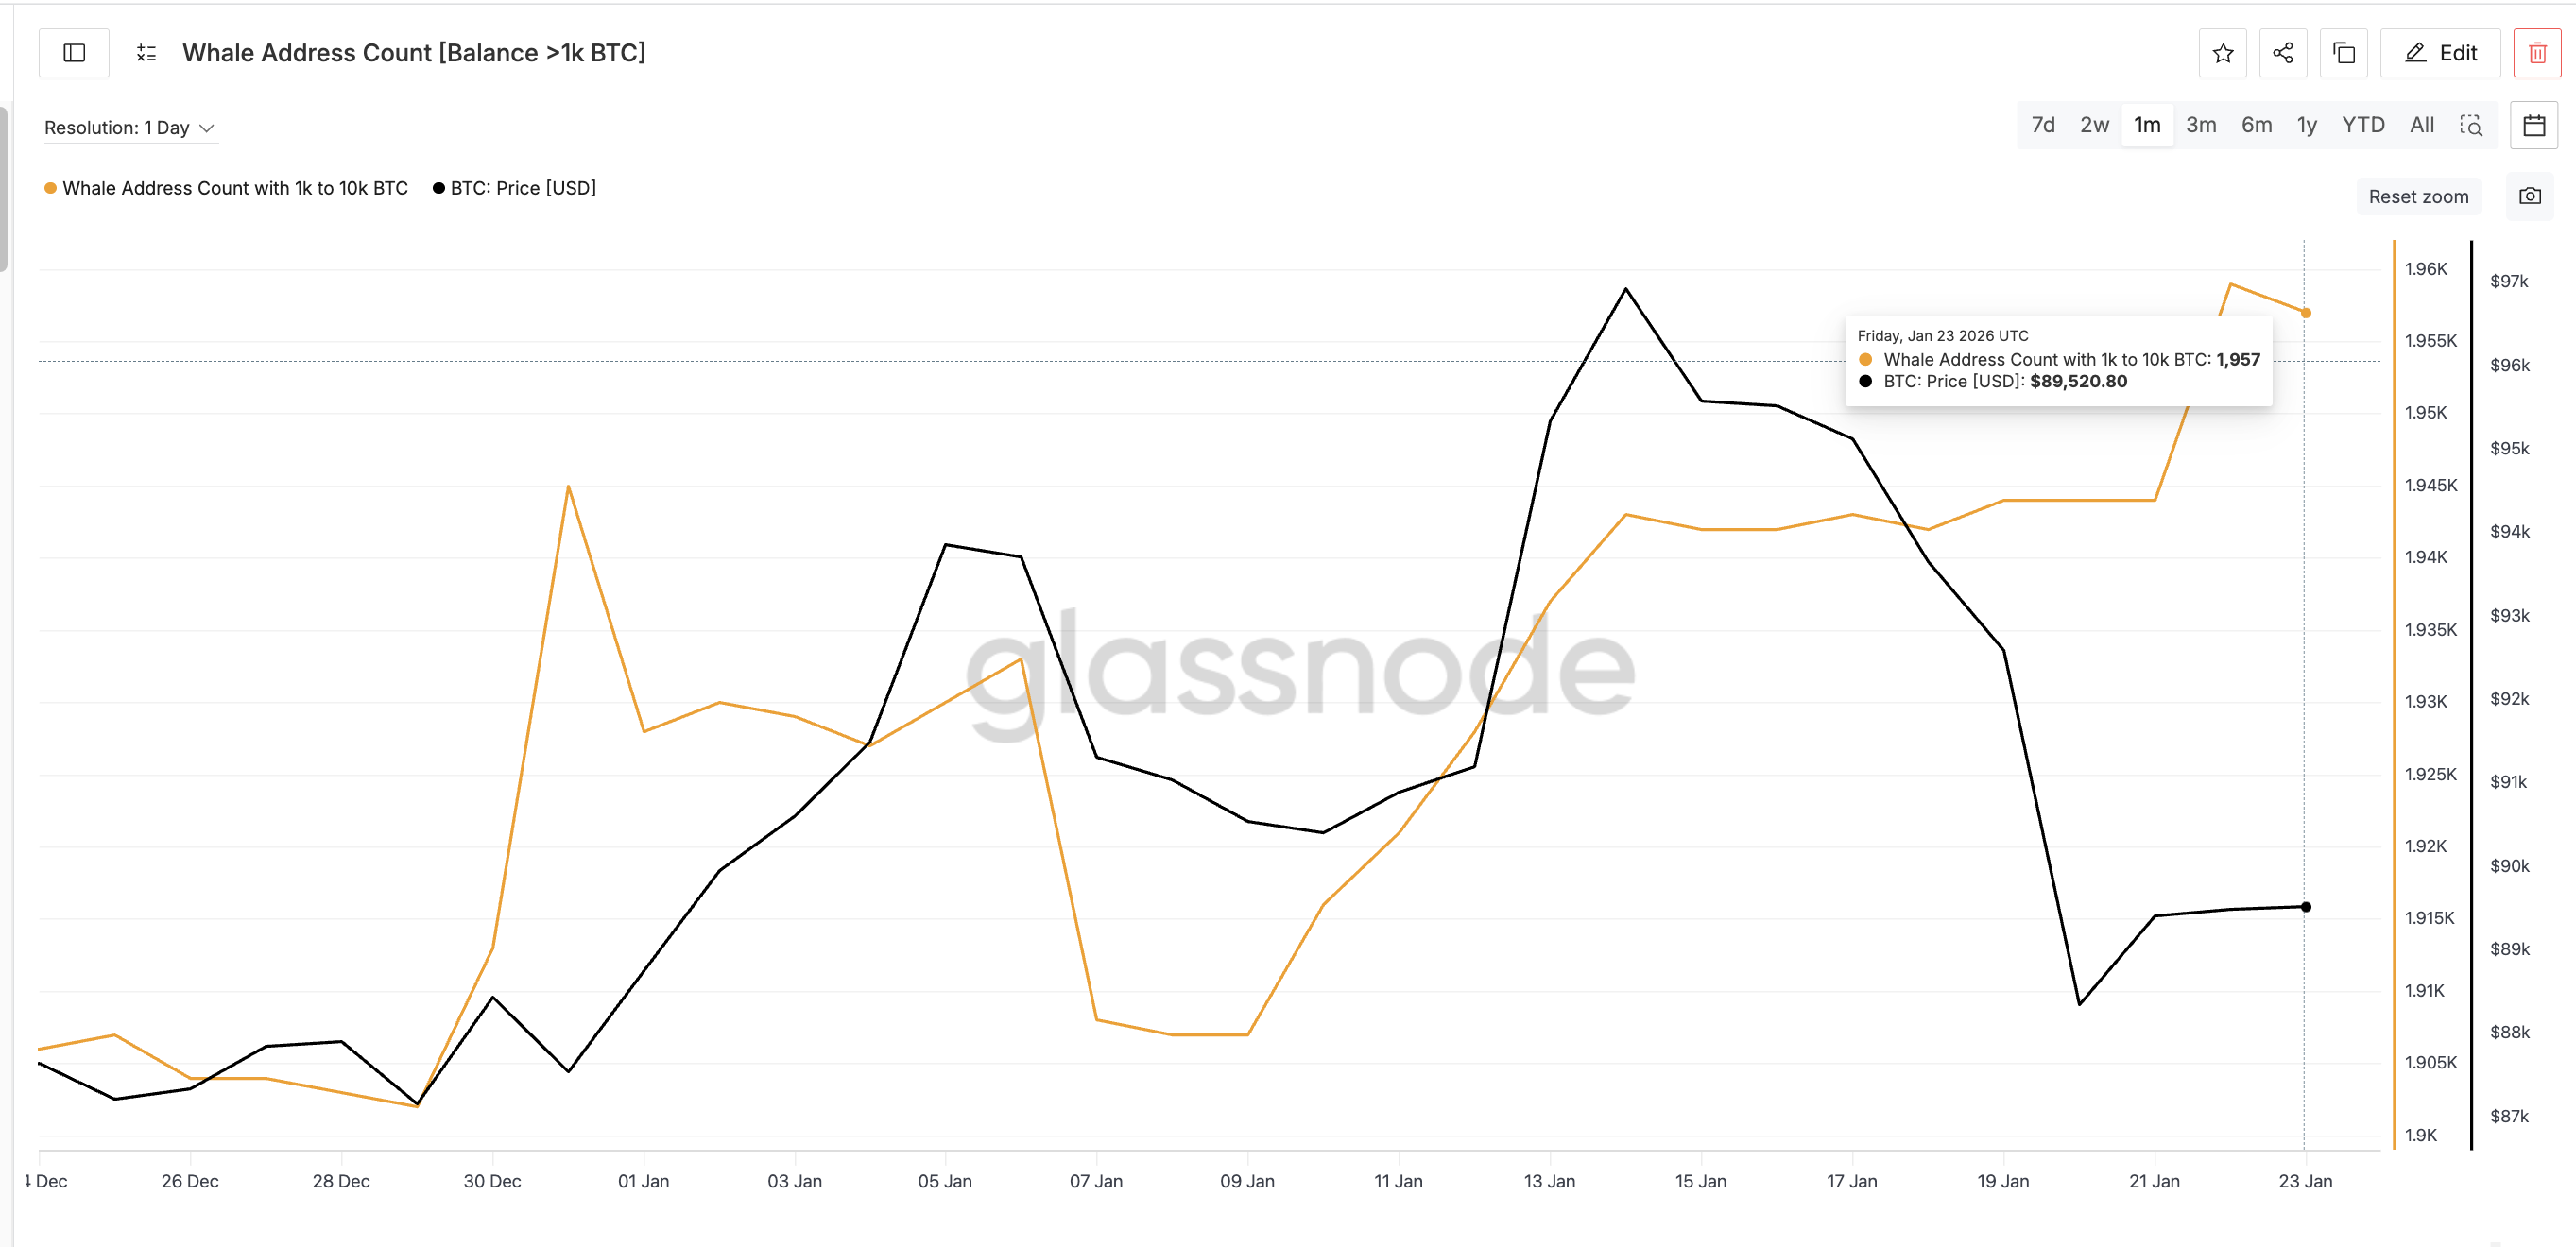
At the same time, whale behavior is starting to soften. Whale address counts rose steadily from January 9 through January 22, then began to flatten and slightly decline. This suggests early distribution, not aggressive dumping, but it adds to the pressure miners are creating.
The market now hinges on price levels.
Bitcoin Price Levels Decide Whether the Standoff Breaks
At the current price near $89,500, Bitcoin needs a daily close above $91,000, roughly a 1.79% move, to reclaim the 20-day EMA. That would ease immediate downside pressure and signal that buyers are regaining control.
The risk is closer.
A daily close below $88,500, about 1% lower, would place Bitcoin back under rising-wedge support. If that happens, downside targets open quickly.
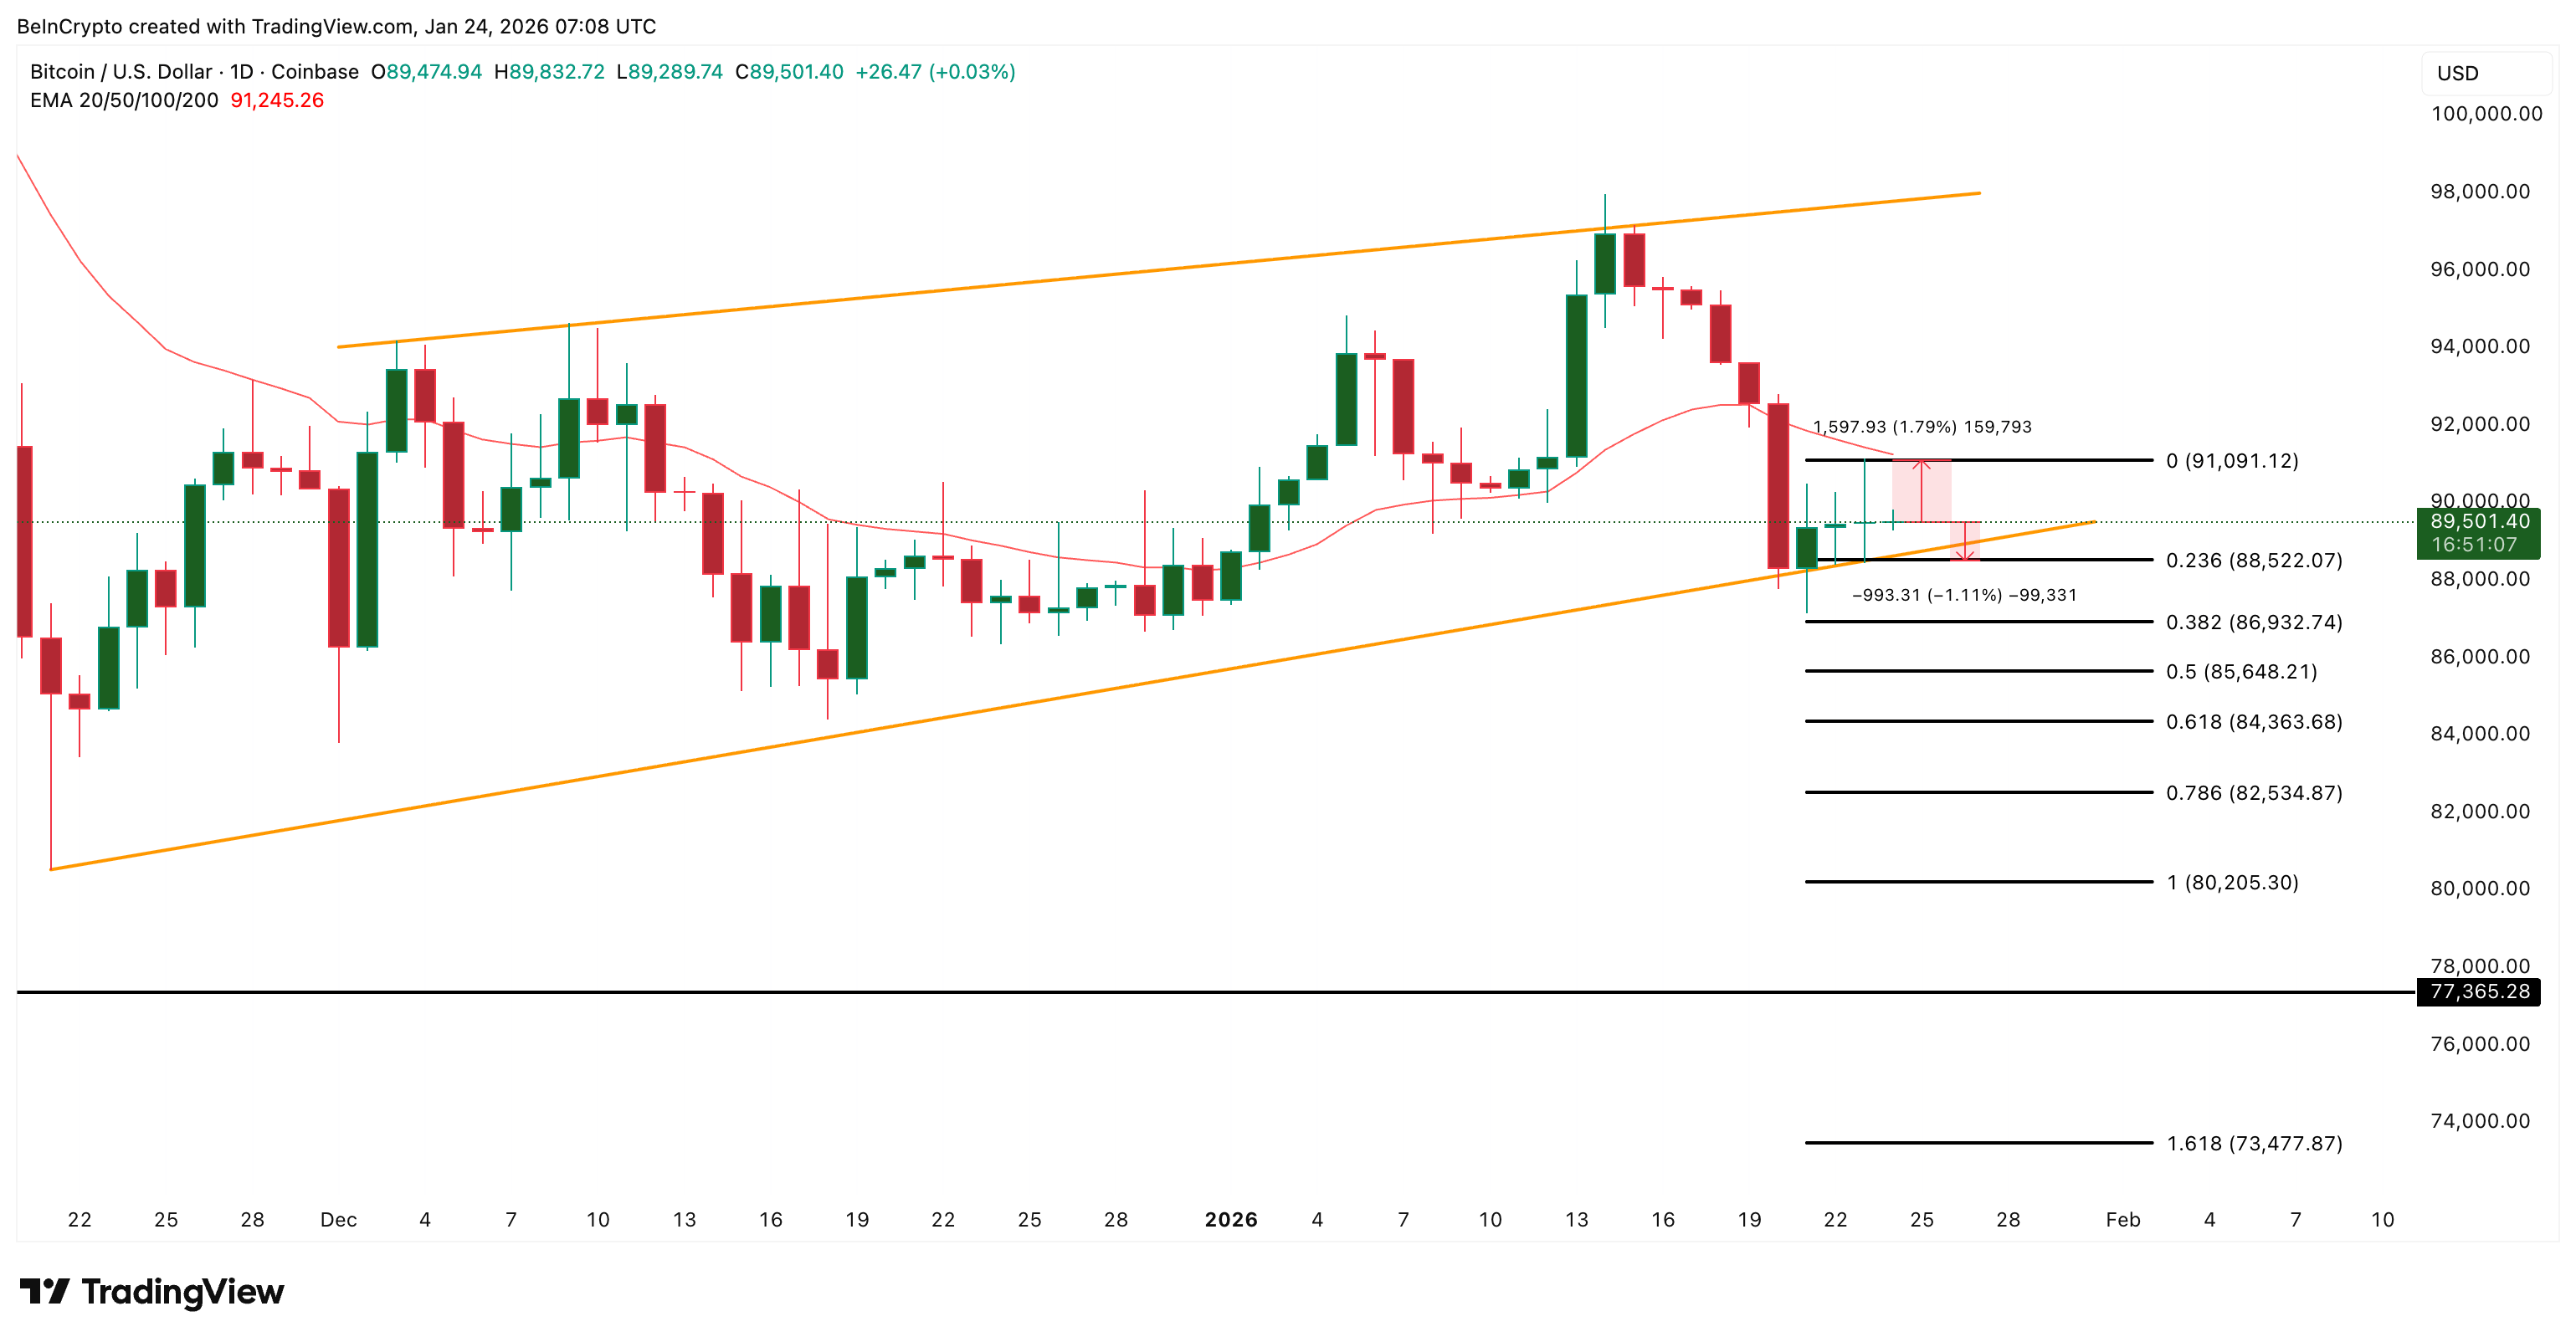
Key Bitcoin price levels to watch include $84,300 first, followed by the wedge projection near $77,300. If long-term holder buying continues to slow while miner selling persists, those levels become increasingly relevant.
The post Bitcoin Flat at $89,000, but Charts Warn Buyers Are Losing Ground appeared first on BeInCrypto.
Read moreLatest News